High-resolution records of sea surface temperature and salinity in the East China Sea in the last 14.2 ka: Implication from alkenone and its hydrogen isotopes
-
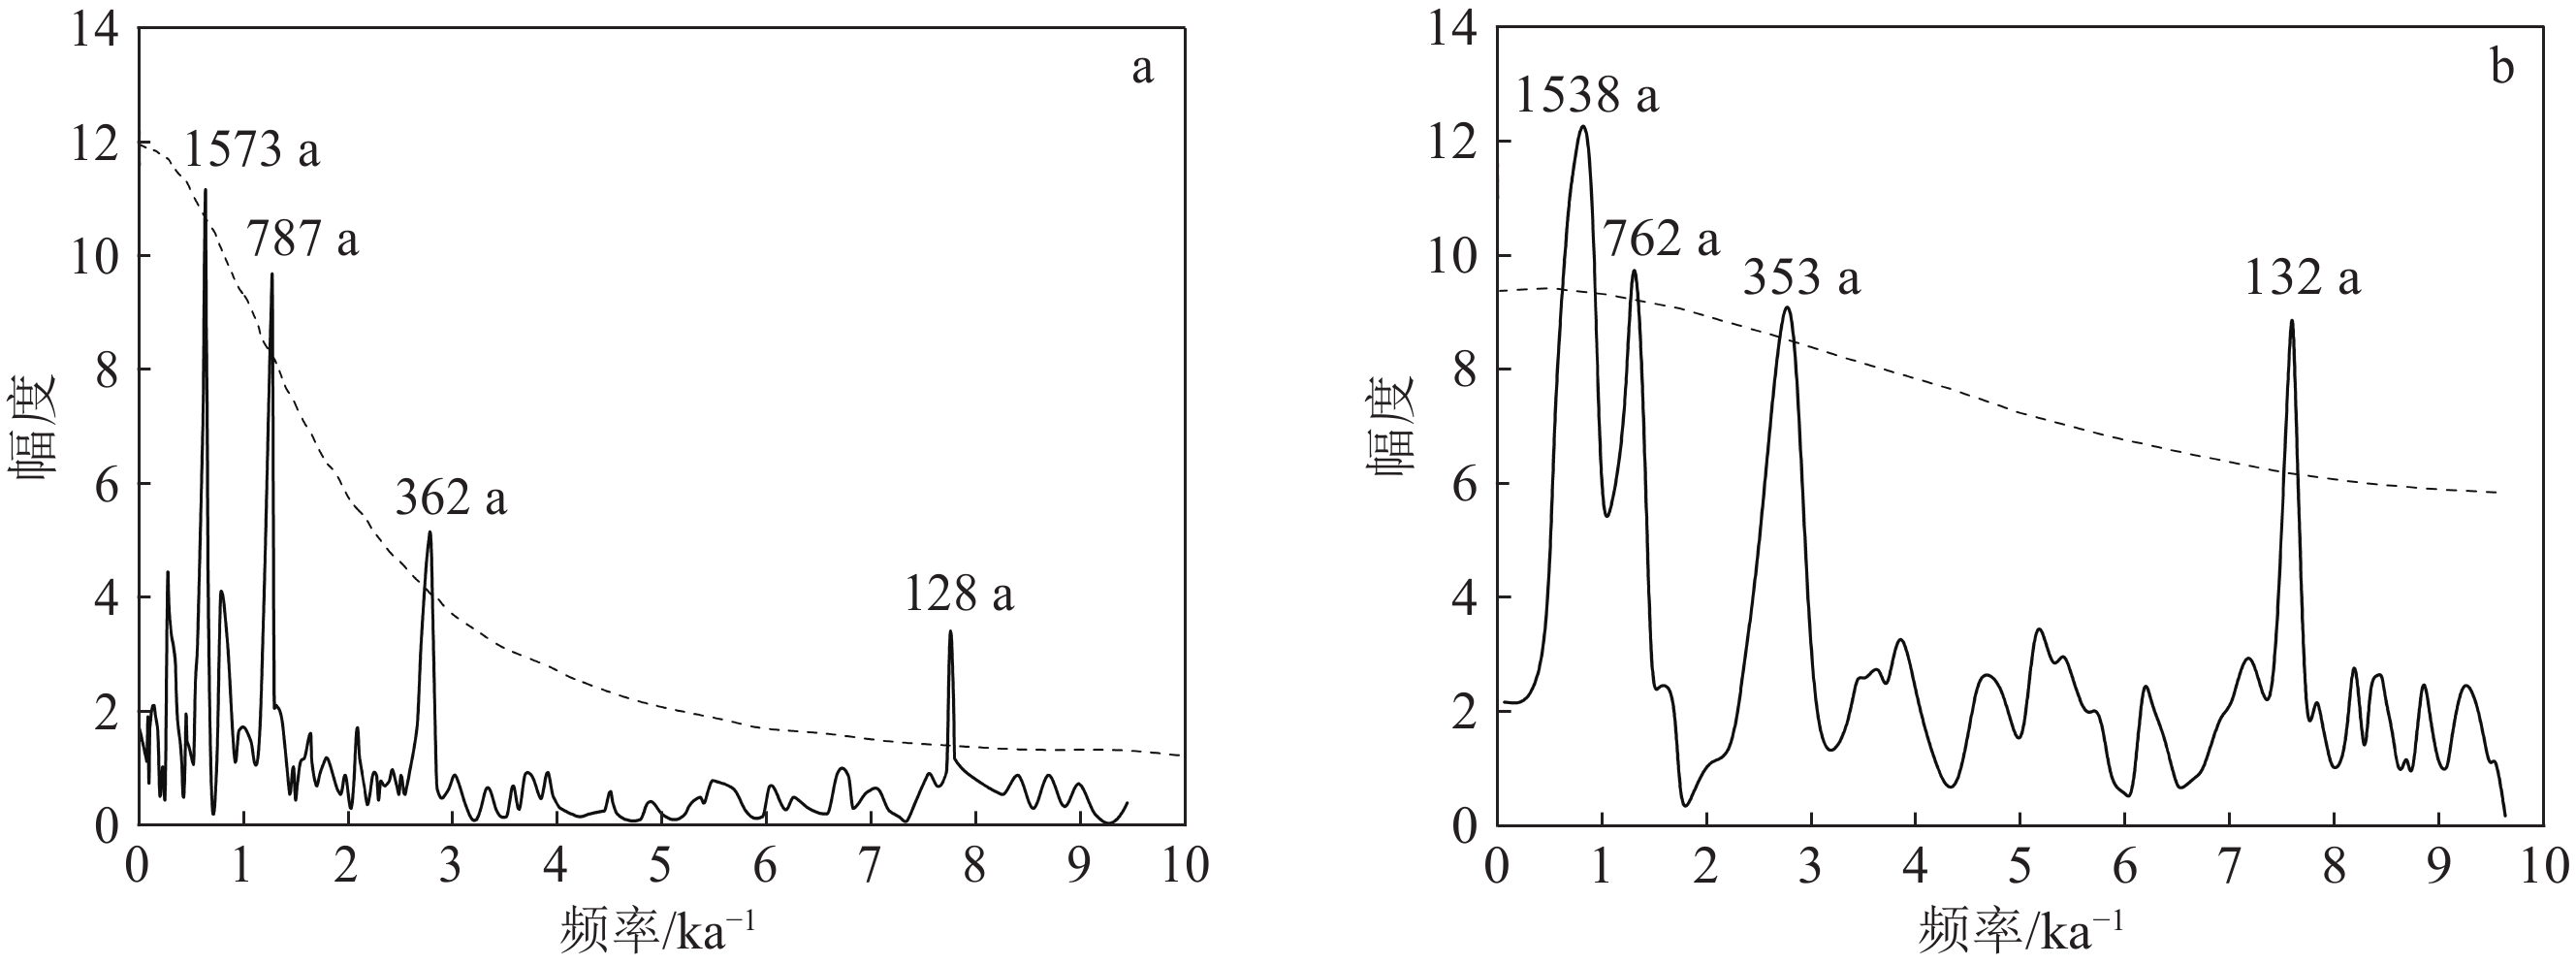
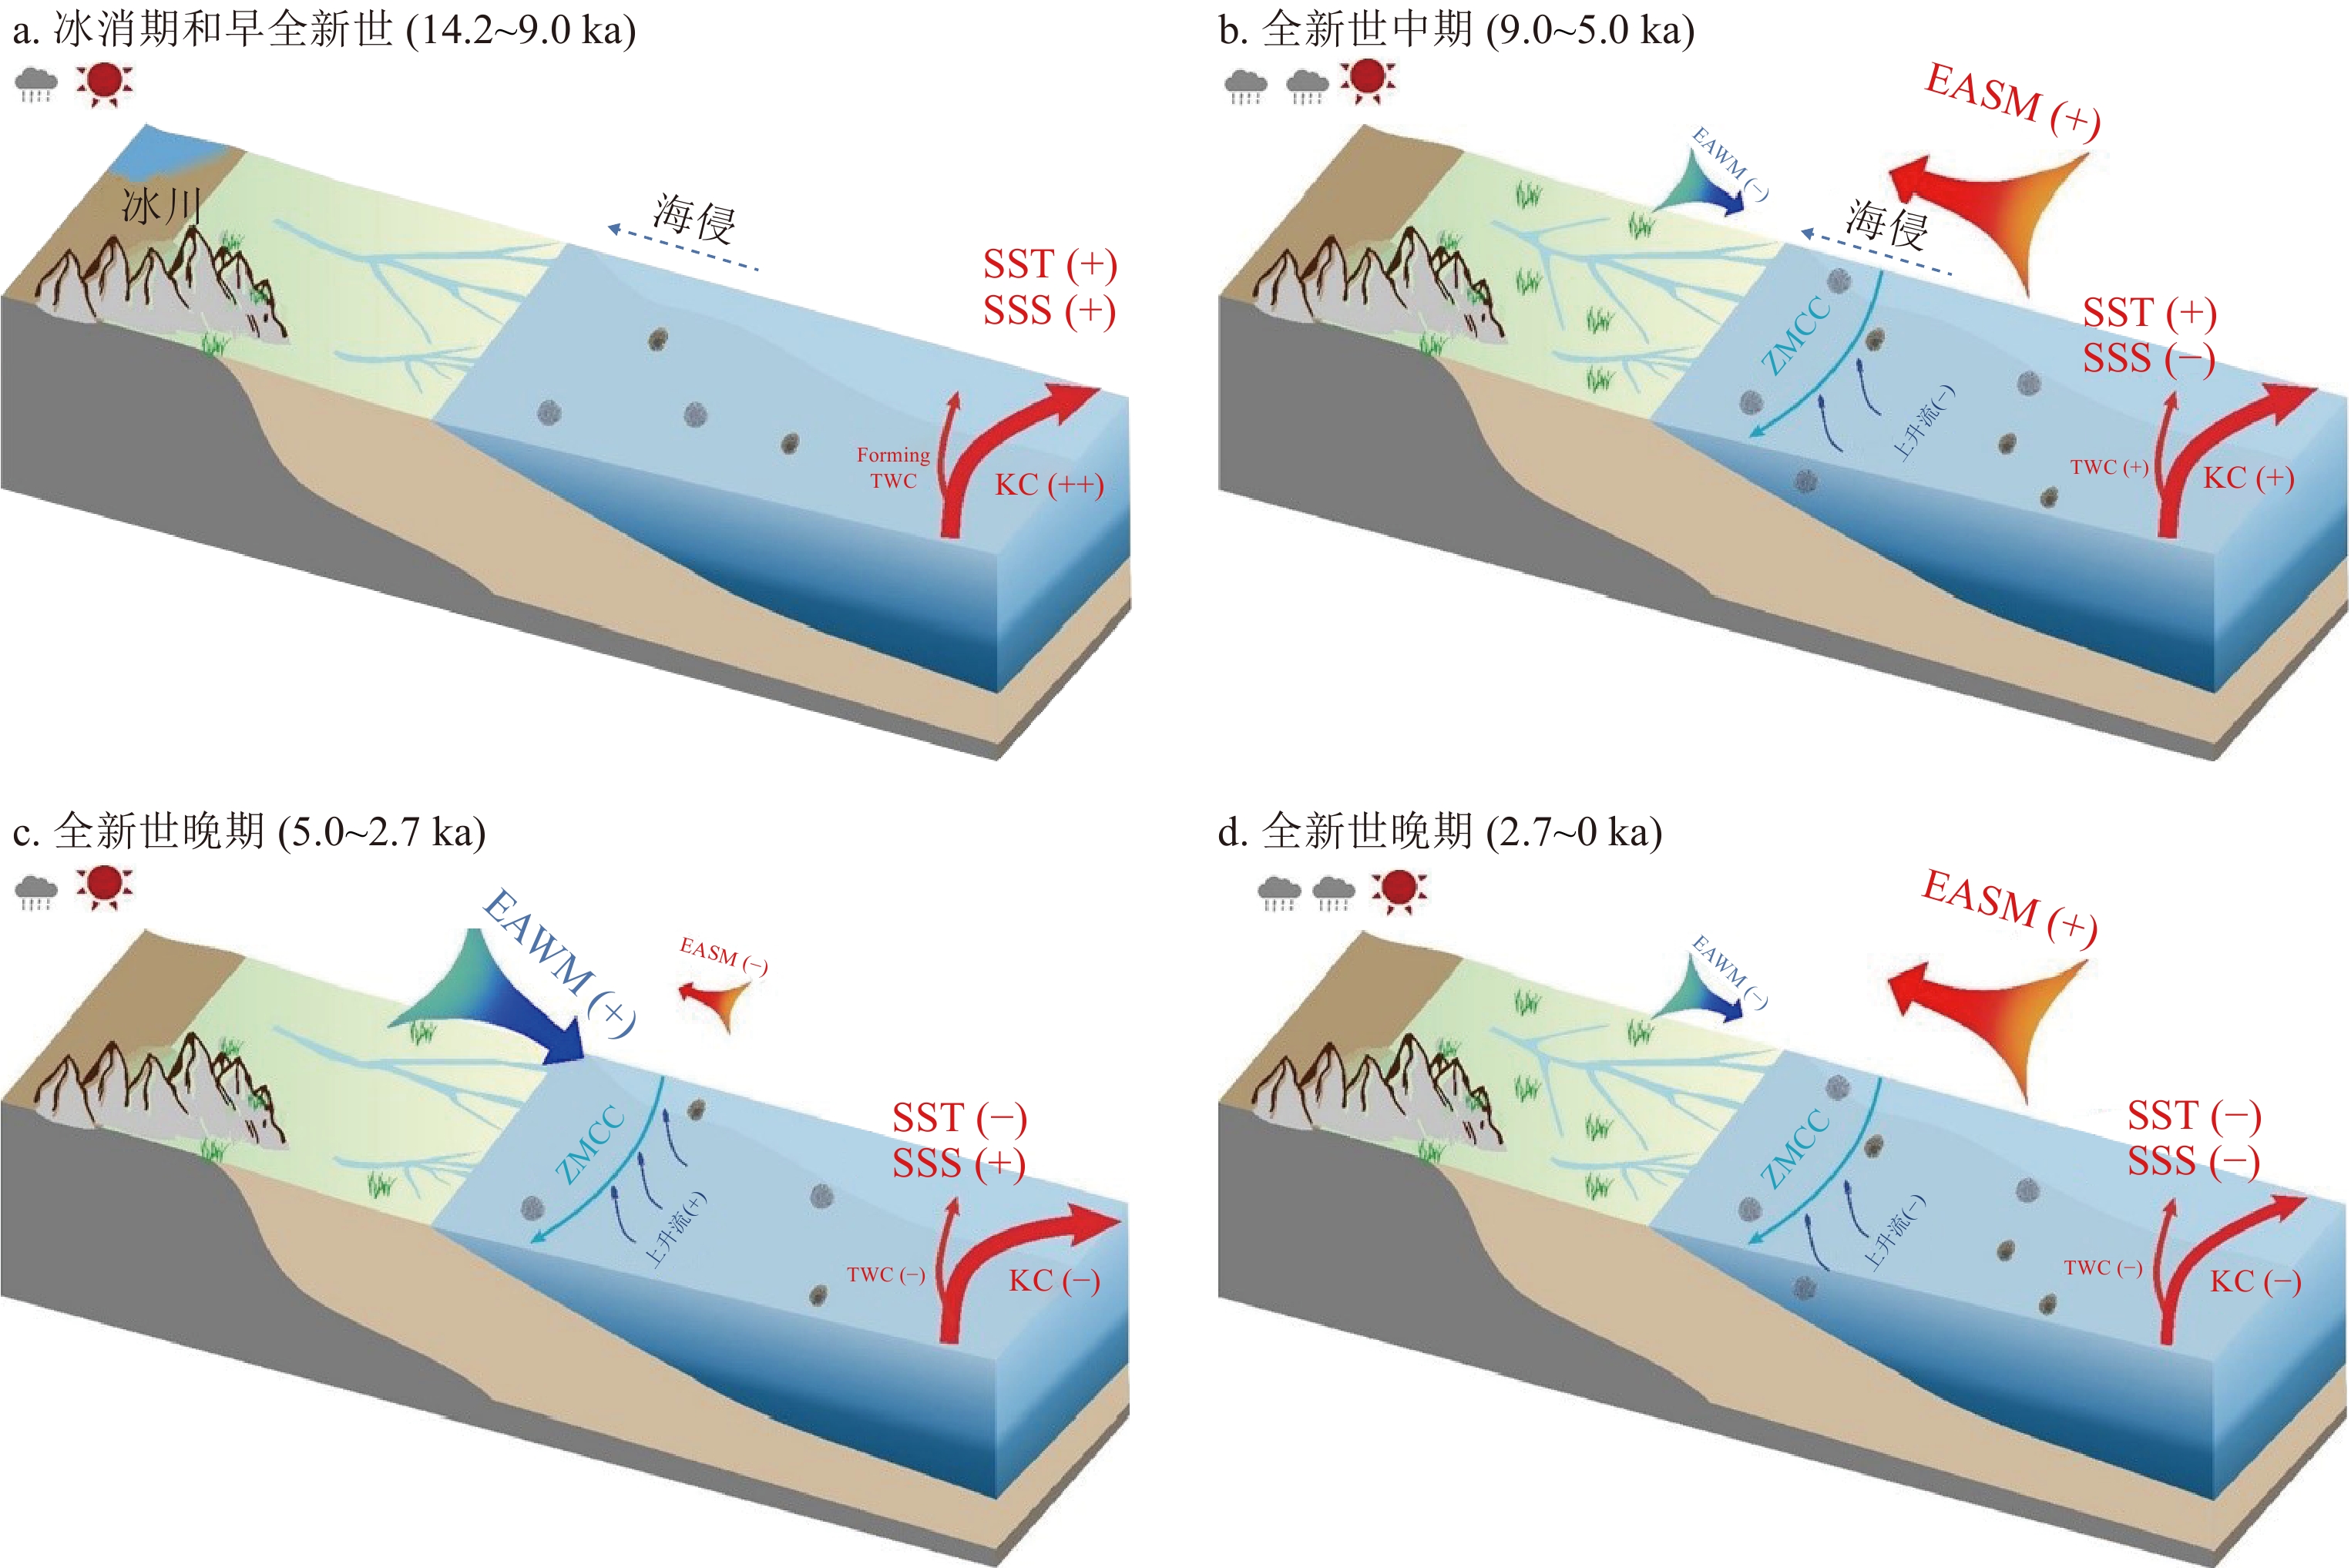
摘要: 东海古海洋环境条件(如海表温度(SST)和盐度(SSS))研究显示其与低纬热带大洋和东亚季风(EAM)的水文气候变化存在不同步的特征。然而末次冰消期以来,东海表层水温和表层盐度如何对东亚季风和低纬热带大洋的协同作用作出响应,目前尚不清楚。本文基于近1.4万年来东海的高分辨率岩芯中长链烯酮及其氢同位素(δDalkenone)的表层温盐记录,以了解不同时间尺度上的驱动机制。结果表明,东海表层水温、盐度具有不同时间尺度的变化,为约1500 a的千年尺度以及约750、350和120 a的百年尺度的周期波动。在末次冰消期和全新世早期,由于黑潮增强将高温、高盐海水带入东海,导致表层水温度、盐度均较高。在全新世早中期(9.0~5.0 kaBP),由于东海水动力环流形成,并受高纬大气变化和低纬热带大洋环流的双重影响,从而引起显著的海洋层化现象,导致海表出现高而稳定的表层水温和相对较低的表层盐度。5.0~2.7 kaBP,东亚冬季风似乎有所增强,而东亚夏季风减弱,从而导致东海的上升流增强。这可能是由于黑潮势力减弱,随后导致东海的低SST和高SSS现象。全新世晚期,东海表层水温和表层盐度呈下降趋势,这与黑潮变化几乎同步。Abstract: Palaeoceanographic environmental conditions in the East China Sea (ECS) shown as sea surface temperature (SST) and salinity (SSS) may reveal asynchronous hydroclimate changes from low-latitude warm ocean and East Asian monsoon (EAM). However, it remains unclear whether the SST and SSS in the ECS showed a notable response to the spatiotemporal patterns of hydroclimate with the synergistic impacts of the EAM and tropical ocean since the last deglaciation. The SST and SSS records based on alkenone and its hydrogen isotopes (δDalkenone) with a high-resolution core from the ECS over the last 14 ka were analyzed to understand the forcing mechanisms on different timescales. Results indicate that the SST and SSS of the ECS fluctuated in millennial (~1500 a) and centennial (~750 a, ~350 a , and ~ 120 a) scales. During the last deglaciation and early Holocene, the Kuroshio was strengthened and carried relatively warm and salty seawater into the ECS, thus the SST and SSS were generally higher than normal ones. During the middle Holocene (9.0~5.0 kaBP), freshwater discharged into the ECS, followed by the regulation of its hydrodynamic circulations, which might create strong upper-ocean stratification, high and stable SST, and relatively low SSS. During 5.0~2.7 kaBP, the East Asian Winter Monsoon seemed to be strengthened, while the East Asian Summer Monsoon weakened, which enhanced the upwelling in the ECS due probably to the weakening of the Kuroshio, and subsequently led to the low SST and high SSS in the ECS. In the late Holocene, the surface water temperature and salinity in the ECS showed a decreasing trend, which was almost synchronous with the changes in the Kuroshio. This study presents new lights for further understanding of the low-latitude forcing on the paleoenvironmental evolution in marginal sea.
-
Keywords:
- alkenone /
- δD /
- Kuroshio /
- millennial and centennial scales /
- East Asian monsoon /
- East China Sea
-
南海位于欧亚板块、菲律宾板块和印度洋板块的交汇处,是西太平洋最大的边缘海域,其独特的地理位置和复杂的构造环境形成了南海鲜明的区域性沉积特征[1]。因此,南海沉积和深海古环境研究也是国际海洋研究的热点之一[2]。
南海属热带海洋季风气候,东亚季风盛行,具有鲜明的季节变化特征,雨量丰沛,大部分海区的平均年降雨量为1 500~2 000 mm。在气候变化期间海平面也发生了变化。海平面的微小变化可能导致海岸线的大规模进退,这反过来将对邻近海域的沉积物供应产生巨大影响,造成沉积物供应的不稳定[3-4]。
南海北部陆坡整体呈北东向展布,北部为海南岛,西部为越南大陆架,南部为西沙群岛北部岛屿,东部为神狐陆坡段。该区坡度最陡,水深急剧变化,由200 m猛然增加到约2 500 m,物质来源和水流体系更复杂。斜坡十分不稳定,活动断裂发育,对陆坡地貌的控制比较明显,发育广泛的三角洲堆积地貌和滑坡地貌。
浊流活动是一种海底重力流活动,非常普遍且极具破坏性。这是陆源物质搬运到深海的主要方式。当大量碎屑物堆积在陆坡附近时,一些阵发性事件如坍塌、山体滑坡等会导致浊流发生。浊流具有很强的破坏力,可以重塑海底地形,切割斜坡形成海底峡谷,影响海床稳定性。
在国内文献中有许多关于南海浊流沉积的报道,在南海的北部陆坡、北部深海盆地、中沙群岛和南部陆坡都发现了浊流沉积[5]。浊流沉积对于海底扇、海底峡谷和深海油气藏的形成以及古气候的变化记录具有重要意义[6-7]。本文对南海西北部莺琼陆坡区ZK3岩心进行了分析,结合前人的研究,对南海西北部陆坡海域的浊流沉积进行探讨。
1. 材料与方法
1.1 样品采集
本文岩心ZK3位于南海西北部莺琼陆坡上,为沉积物滑塌、浊流易发区,距离海南岛约150 km。岩心长度约30 m,钻孔水深为840 m(图1)。ZK3岩心主要发育了36.6 kaBP以来的晚更新世和全新世地层,该岩心主要由粉砂组成,沉积不连续,有明显的沉积间断和浊流沉积层出现[8]。
1.2 分析方法
本文研究为柱状样,考虑到样品代表性即反映信息全面,对ZK3柱状沉积物样品按照约100 cm间隔取样,共取得33个样品,并对其进行AMS14C测年、沉积物粒度、地球化学元素等综合分析。粒度实验在中国海洋大学海底科学与探测技术教育部重点实验室完成,样品的前处理、粒度测量以及粒度数据的处理严格遵守实验规范。AMS14C测年在美国迈阿密Beta测年实验室完成。地球化学元素在澳实分析检测(广州)有限公司实验室完成。
1.2.1 AMS14C测年
选取适量样品放到小烧杯里,加入蒸馏水、30%的H2O2进行浸泡,充分分散后,过0.063 mm筛进行冲洗,然后把<0.063 mm的部分样品烘干,在体视显微镜下尽量挑选0.025~0.035 mm的浮游有孔虫单种Globigerinoides ruber;在挑选时一般选取保存完好、干净的壳体,样品量一般约为20 mg。将挑选出的浮游有孔虫壳体压碎,将碎屑收集到小塑料管中,在里面加入少量浓度大于99.7%的无水酒精,在振荡频率为40 kHz的超声波清洗器中清洗,约10~20 s后,用针管吸去管内上覆液,重新加入少量酒精进行超声振荡,重复该步骤2~3次,洗涤完毕后将样品放在约60 ℃的烘箱中烘烤5 h。处理完的干净的有孔虫壳体送往美国迈阿密的Beta测年实验室完成测试。
1.2.2 粒度测试
使用英国Malvern公司生产的Mastersizer2000激光粒度仪进行粒度测试。首先,取适量沉积物样品于烧杯中,加入过量30% 的H2O2 15 mL,静置24 h,以去除样品中的有机质;然后再向烧杯中加入0.25 mol/L的HCl 5 mL,静置24 h,以去除样品中的钙质胶结物和生物壳体;待反应完全后,多次离心清洗至溶液呈中性;向烧杯中加入5 mL 0.5 mol/L的六偏磷酸钠溶液,通过超声波振动使颗粒充分分散后,上机测试。使用图解法计算粒度参数,根据谢帕德的分类命名法命名沉积物类型。
1.2.3 地球化学元素测试
本文地球化学元素测试包括常量元素和微量元素测试。处理过程如下:采用四酸消解,取低温烘干后的样品50 mg,加入1∶1的HNO3 1 mL,充分反应;加入纯HF 3 mL,然后放入160~180 ℃的自动控温电热板上加热48 h,蒸至近干;加纯化过的HClO4 1 mL,蒸至白烟冒尽;冷却后加2 mL HCl,同样蒸至近干;再加2 mL 1∶1的HNO3,蒸至近干;加入1∶1的HNO3约1.5 mL,置于电热板上加热溶解12 h,冷却至室温;加入0.5 mL铑内标溶液,置于电热板上保温12 h,冷却至室温;用1∶1 HNO3移至50 mL容量瓶中,并用其稀释至刻度,摇匀待测[9]。使用电感耦合等离子体质谱仪分析法(ICP-MS)对处理后的样品进行了元素分析,分析测试工作在澳实分析检测(广州)有限公司实验室完成,主要是利用美国热电公司生产的电感耦合等离子体质谱仪XSERIESⅡ完成测定。
2. 结果
2.1 年代框架
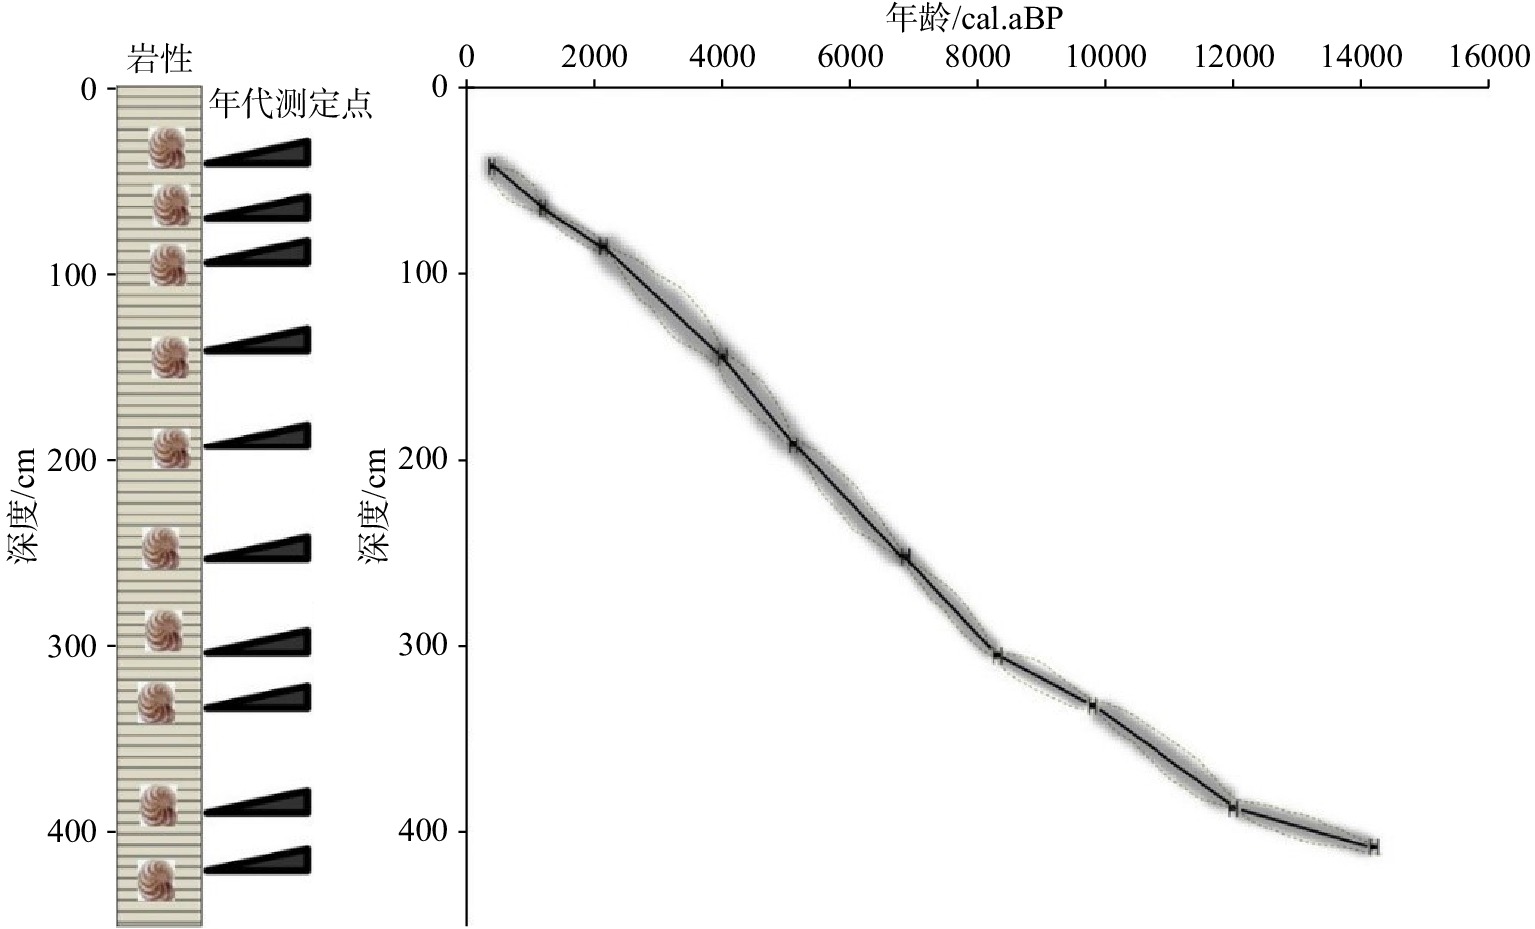
根据ZK3岩心AMS14C测年结果(图2a),按照线性内插法和外延法确定了样品所在深度的年龄,以此计算了不同时间段的沉积速率,校正后ZK3岩心底部年龄约为36 ka。年代框架建立在测年结果的基础上,将ZK3岩心中倒转的层位去掉,进行了年代沉积速率作图(如图2b)所示。
2.2 粒度参数特征
根据谢帕德的分类命名方法,ZK3岩心沉积物类型为粉砂,黏土质粉砂,主要以粉砂粒级为主(图3)。
粒度分析结果显示,砂粒级(>63 µm)沉积物含量小于4%,黏土(<4 µm)及粉砂(4~63 µm)粒级沉积物的含量平均约为29%和70%。ZK3整个岩心分选系数为1.525~1.756,平均值为1.625,各层位的分选普遍较差;沉积物平均粒径为0.006~0.009 mm,沉积物较细;中值粒径为0.006~0.009 mm(表1);沉积物偏态主要表现为正偏及近对称,大部分层位峰态主要表现为中等。
表 1 ZK3岩心沉积物组成与粒度参数Table 1. Composition and grain size parameters of the sediments from core ZK3粒度参数 砂/% 粉砂/% 黏土/% Md Mz σI SkI Kg 平均值 1.16 69.83 29.01 0.008 0.007 1.625 0.161 1.016 最大值 3.85 74.80 33.79 0.009 0.008 1.756 0.223 1.122 最小值 0.00 64.28 23.78 0.006 0.006 1.525 0.100 0.965 3. 讨论
3.1 ZK3岩心中浊流沉积层的识别
浊流沉积很难在海洋沉积物中完整地保存下来,其判别对于沉积学家来说一直是一个难题。1962年,Bouma[10]提出了浊流沉积的理想沉积序列,即所谓的“鲍马序列”,以识别浊流沉积。但是,完整的鲍马序列很难保存下来,在沉积物中最常见的仅是鲍马序列的一部分,由于鲍马序列的部分片段具有很大的多解性,海洋中的其他沉积活动也可以形成同样的沉积。因此,很难作为判别浊流沉积的标志。Shanmugam[11]对世界各海区长达6 000多米的岩心进行了重新研究,发现大多数被确定为浊流成因的沉积层均具有一个标志性的向上变细的正粒序层。因此,他将向上变细的正粒序层以及下覆的冲刷构造作为判别浊流沉积的标志。
南海莺琼陆坡浊积层的厚度比较小,并不能发育完整的鲍马序列。我们依据Shanmugam等的标准对浊积层进行识别,并结合AMS14C测年、沉积物粒度分析、地球化学元素分析、萨哈-兰迪姆相浊流环境判别及C-M图的分析结果,从ZK3岩心初步可识别出4层特征明显的浊流沉积:浊积层1(7.4~8.3 m)、浊积层2(12.8~13.5 m)、浊积层3(15.5~17.2 m)和浊积层4(18.7~20.7 m)。
3.1.1 AMS14C测年
通过AMS14C测年可知,ZK3岩心0~6.25 m呈现很好的由新到老的时间序列,沉积基本连续,没有出现显著的沉积间断。初步观察ZK3岩心有4个主要的沉积间断面:7.4~8.3、12.8~13.5、15.5~17.2、18.7~20.7 m,沉积间断大致发生时间分别为7.81~12.28、18.97~20.46、20.46~22.95、22.95~26.12 kaBP。每个间断面大约有1.5~4.5 ka的沉积缺失,推测岩心出现的年代倒转可能与地层发生局部滑塌或者小规模浊流事件相关。
从图2中可以看出ZK3岩心沉积速率为22.55~175.53 cm/ka,全新世平均沉积速率大约为78.94 cm/ka,晚更新世平均沉积速率大约为93.05 cm/ka。最低平均沉积速率出现在间冰期(12.28~18.04 kaBP),仅为22.55 cm/ka。最高的沉积速率出现在晚更新世末次盛冰期(18.97~20.46 kaBP),为175.53 cm/ka。沉积速率的这种变化趋势可能与海平面升降变化引起的陆源输入有关[12]。
3.1.2 沉积物粒度分析
浊流沉积最显著的特征是沉积物粒度特征的突然变化[13],这在ZK3岩心粒度参数的垂向变化曲线上有清晰的反映,依据粒度参数的变化我们可以较容易地区分出浊积层与正常沉积。
岩心沉积物的各粒度参数随深度的垂向变化中可以分辨出可能的浊流沉积层(图4)。平均粒径与分选系数和中值粒径具有相似的变化趋势,平均粒径、分选系数、偏态、峰态、中值粒径自下而上波动比较大,表现出多个峰值。ZK3岩心分选系数在7.4、13.5 m处出现两个高峰值,而分选系数较大的层位可能代表了分选性很差的浊积层;中值粒径在7.4、13.5、16.2、20.7 m 4个层位出现高峰值,粒径偏粗,可能有粗粒物质未经改造加入到沉积环境中。层1(7.4~8.3 m)、层2(12.8~13.5 m)、层3(15.5~17.2 m)沉积物粒度参数发生显著变化,平均粒径、中值粒径和分选系数明显变大,分选变差;峰态(Kg)、偏态(SkI)值都有明显波动,每一次波动可能代表了一次小的事件沉积,推测该些层位可能是一个非正常沉积层。
![图 4 岩心沉积物组成与粒度参数垂向变化]() 图 4 岩心沉积物组成与粒度参数垂向变化Figure 4. Vertical variation of sediment composition and grain size parameters
图 4 岩心沉积物组成与粒度参数垂向变化Figure 4. Vertical variation of sediment composition and grain size parameters整个ZK3岩心单层浊流沉积的厚度虽不大(0.7~2.0 m),但其总厚度达到5.6 m,约占ZK3孔沉积总量的19%,可见浊流沉积对正常沉积的干扰作用极为显著,同时也大大促进了陆源物质向莺琼陆坡的输运。
3.1.3 C-M图
C-M图是识别浊流沉积物的有效手段之一,其中C是概率粒度累计曲线上颗粒含量1%处对应的粒径,C值代表了水动力搅动开始搬运的最大能量,其对应于样品中最粗颗粒粒径;M值是概率粒度累计曲线上50%处对应的粒径,即粒度中值,代表了水动力的平均能量[14-15]。利用ZK3岩心的33个样品的粒度分析资料,我们获得了该岩心的粒度C-M图(图5)。可以看出浊积层位在C-M图上的分布点的明显特征,样品点主要分布在M值7~10、C值50~70的范围之内,其整体趋势表现为与C=M基线近似于平行的特征(下方椭圆区),其C值与M值始终成比例增加,两者协调一致,这是比较典型的浊流沉积层(图5)。
3.1.4 判别指标
萨哈-兰迪姆相浊流环境判别指标Y小于9.8433为浊流沉积,大于9.8433为河流沉积。判别方程[16]为:
Y=0.7215Mz−0.4030δi+6.7322Ski+5.2927Kg 式中Mz为平均粒径;σi为分选系数;SKi为偏差;Kg为峰态。对ZK3整个岩心的潜在浊流层样品进行了计算(表2),发现4个层位的Y值为5.60~5.90,均小于9.8433的判定值,再次说明该些层位为浊流沉积层。
表 2 ZK3岩心各层位萨哈-兰迪姆相浊流环境判别结果Table 2. Identification of Turbidity current environment with Sakha-Landim facies diagram for each layer of core ZK3层位 Y值 层位 Y值 ZK3 S-9-7.40 5.619 ZK3 S-29-16.20 5.697 ZK3 S-10-7.70 5.606 ZK3 S-31-17.20 5.741 ZK3 S-11-8.30 5.657 ZK3 S-35-18.70 5.885 ZK3 S-22-12.80 5.530 ZK3 S-37-19.40 5.748 ZK3 S-24-13.50 5.549 ZK3 S-41-20.70 5.860 ZK3 S-28-15.50 5.521 − − 3.2 浊积层沉积特征
ZK3岩心浊积层中以粉砂和黏土占绝对优势,砂含量很低。虽然ZK3岩心总体上粒度特征未发生大的变化,但是中间小规模浊流沉积的频繁发生,大大干扰了正常的沉积层序特征,使陆源碎屑的各粒度参数发生显著变化。
浊积层1:出现在岩心7.4~8.3 m处,是ZK3岩心中参数变化最显著的层序,该段地层测年结果比6.25 m处的测年年龄要新,显示地层发生了倒转。粒度参数的垂直变化表现出与正常沉积层位不同的分布特征(图4),自下而上砂含量先增大后减小,为0.19%~3.24%~0.69%;粉砂含量逐渐增加,为67.07%~67.95%~69.93%;黏土含量先减小后增大,为32.73%~28.81%~29.38%;平均粒径由细到粗,在7.7 m处达到最大值,然后再逐渐变细;分选系数(1.62~1.75~1.71)、峰态(0.98~1.02~0.96)也显示了先增大后减小的变化过程。本层中由细-粗-细的粒径变化和高的粉砂含量代表了一次规模较大的浊流沉积。在末次冰期南海南部巽他陆坡底部MD05-2895孔与晚更新世以来冲绳海槽南部发育的浊流沉积中也出现类似粒序变化,这与Shanmugam所总结的海洋中浊流层的特征基本一致。
浊流层2:出现在岩心12.8~13.5 m处,沉积物分选差,分选系数为1.63~1.65 ;自上而下,中值粒径由大变小,为0.0076~0.006 8 mm,砂含量为2.46%~0.63%,粉砂含量为68.25%~66.38%,黏土含量为29.29%~32.98%。中值粒径从底部到顶部逐渐变细,黏土含量越来越高,砂和粉砂含量越来越低,沉积物粒级由粗变细。12.8~13.5 m层位环境判别计算出的Y值为5.53~5.55,Y值在6以下,小于9.843 3的判定值。
浊流层3:出现在岩心15.5~17.2 m处,沉积发生在20.46~22.95 kaBP期间,顶部和底部的年龄相差不大。砂和粉砂含量呈现向上逐渐降低,黏土含量向上逐渐增高,这是较为典型的正粒序沉积层。且萨哈-兰迪姆相浊流环境判别值为5.52~5.74,小于9.843 3的判定值。
浊流层4:出现在岩心18.7~20.7 m处,地层发生倒转,这层浊流层比较难识别。该层段自下而上,砂含量为0.72%~0.42%、粉砂含量为71.78%~68.96%、黏土含量为27.50%~30.61%,具有向上变细的正粒序特点。
3.3 浊流发育成因探讨
浊流是海洋中最常见的重力流活动[17-18],是大陆边缘沉积物向深海区的搬运,在满足一定条件下才能形成。广义上来讲,足够的水深、充足的物质、必要的坡度和触发机制是形成浊流所需的4个条件。足够的水深和充足的物质是浊流发育的物质基础,必要的坡度是浊流发育的动力来源。通常,在海洋环境中,浊流主要形成于陆棚坡折以下较深的水域。触发机制最为关键,是突发性外力对沉积物的不稳定破坏[19-20]。以往的研究表明,浊流形成的触发机制主要包括海平面波动、季节性洪水、地震、火山喷发、海啸巨浪、风暴潮、底辟活动和天然气水合物泄露等。在上述这些事件发生时,处于较陡地形之上的松散沉积物重力失稳,极易发生滑塌,顺着陆坡区搬运,形成浊流沉积。ZK3岩心位于南海西北部莺琼陆坡处,陆坡坡度较陡,珠江水系的泥沙不断堆积和珠江三角洲发育,其物质来源充足[21],为浊流发育提供了有利的地形和必要的物质基础,只要在外力触发作用下,很容易形成浊流。
3.3.1 海平面变化
海平面变化是引发南海浊流的主要原因。ZK3岩心的浊积层1(7.81~12.28 kaBP)、浊积层2(18.97~20.46 kaBP)、浊积层3(20.46~22.95 kaBP)和浊积层4(22.95~26.12 kaBP),可以看出浊积层2、3、4这3层发生于海平面相对较低的末次冰期,全新世以来只发育了浊积层1(图6)。因而推测研究区浊流沉积事件的主要诱因是低海平面时期的海平面波动造成了沉积物不稳定,同时较陡的陆坡为浊流沉积提供了有利地形,因而容易造成向陆坡方向的浊流搬运[22-23]。同时研究南海浊流发生的时期和相对海平面变化曲线,可以看出海平面相对较低的时期浊流发生的频率最高[24]。另外有研究表明,末次冰期以来,在西菲律宾海吕宋岛岸外发现5层浊流沉积,可能是低海平面时期的海平面波动导致沉积物不稳定,从而引发浊流沉积。赵玉龙等[25]对南海南部巽他陆坡底部深海浊流沉积进行研究后,同样认为海平面波动是造成巽他陆坡上浊流形成的原因。
末次冰期以来,全球海平面变化非常活跃,并经历了多次海平面的快速变化[4,26]。在末次冰期,全球海平面降低,全球相对海平面比现在低一百多米,陆架大面积出露,陆源物质搬运的距离大大缩短。在海平面下降期间,陆坡区物源供给充足,陆坡北部地区的三角洲携带着大量沉积物在陆架坡折地区堆积。大量的陆源沉积物被搬运到陆坡附近,松散的沉积物在火山,地震和强降雨等事件发生时极易发生垮塌,极具形成浊流的潜力[27]。
3.3.2 降雨的增强
进入末次冰期的最后阶段,虽然海平面开始缓慢上升,但这种海陆模式在数千年内并没有太大的变化。随着末次冰期的结束,海平面开始快速上升,岸线开始迅速后退。由于离岸距离的增加陆源物质供应量相应减少,所以ZK3岩心的沉积速率也相应减小。进入全新世后,全球海平面逐渐趋于稳定,浊流发育的频率随之减缓,全新世以来只发育了浊积层1(图6)。陆源有机质的输入减少,沉积物供应也较稳定,沉积物搬运距离没有出现较大的缩短,难以触发浊流,而此时东亚夏季风增强、降雨增多,气候湿润,降雨导致的区域侵蚀对浊流沉积的发育起到了关键性作用[28-30]。全新世阶段的浊流发生频率与台湾南部的夏季降雨量有同步变化的趋势。11.5~7.4 kaBP在湖北神农架石笋中也记录了明显的降水量增加的过程[31]。
ZK3岩心近36 ka以来碳酸钙(CaCO3)在沉积物中的相对含量的垂向变化及元素比值见图7。CaCO3含量变化曲线与以往南海北部浅层碳酸盐含量变化曲线相似[32]。由图可知CaCO3含量为10%~18%,平均为13.91%,总体含量较低,其含量主要受控于河流带来的陆源物质的稀释作用,反映陆源物质输入对其影响较大。可以看出在末次冰期CaCO3含量相对较低,进入全新世CaCO3含量相对增加。在早全新世期间,CaCO3含量在5.4 m层位出现异常低值,同时观察Rb/Sr和Rb/Zr在5.4 m处出现高值,Rb和Sr含量主要受控于降雨量。该处碳酸钙的异常低值(图7),同样显示当时处于一个多降水的阶段。
![图 7 ZK3岩心元素比值及碳酸钙含量垂向变化]() 图 7 ZK3岩心元素比值及碳酸钙含量垂向变化Figure 7. Vertical change in element ratio and calcium carbonate content in core ZK3
图 7 ZK3岩心元素比值及碳酸钙含量垂向变化Figure 7. Vertical change in element ratio and calcium carbonate content in core ZK3降水量的增加会加大对陆地表面的冲刷,尤其是冲刷能力极强的大雨,会将大量陆源物质通过河流带入南海陆坡,对碳酸盐的沉积起到明显的稀释作用。尤其是在南海北部陆坡带,沉积物更易直接受到物源作用的影响,东亚夏季风的增强导致降水量增加,从而使河流的搬运和输送能力增强,地表径流增多,可能是触发浊流的主要因素[33-35]。
3.3.3 海洋深层水流
地震剖面研究发现,在南海北部深水陆坡区存在极其活跃的深水底流沉积,对浊流沉积物有一定的改造作用[35-37],特别是在东北陆坡区最为明显。研究表明,10 kaBP时海平面已上升到相当的高度,约在现在海平面−40 m,海岸线已接近内陆架,暗示当时南海的现代环流系统已开始形成。南海深层水主要为北太平洋深层水经吕宋海峡进入南海海盆,沿着陆架向西做逆时针运动[38],其流速为0.15~0.3 m/s(图8)。19世纪30年代以前,人们普遍认为深水环境(水深>200 m)中没有流体活动,只有深海泥在缓慢地沉积。深海环境中浊流活动的存在是在1929年大西洋海底电缆断裂事件中被证实。在之后浊流学说、鲍马序列的提出推动了后续深水的研究。深水陆坡区是比较陡峭的地貌,沉积物不稳定,在重力及各种触发机制(地震、突发性海流、超压释放、底辟活动等)的作用下,沉积物极易发生滑动、滑塌等重力活动,可进一步发展为碎屑流、颗粒流或是浊流[39]。
![图 8 研究区周边洋流分布图(洋流模式参考文献[40-41])]()
总的来说,末次冰期以来,南海及附近区域的浊流事件频繁发生,浊流事件与海平面的波动有关。除海平面变化因素的影响外,降雨的增强和海洋深层水流也是触发浊流的主要诱因[42]。低海平面时期物质的积累是必要条件,海平面变化引起的沉积物不稳定是其中一个触发因素。由于海平面的变化是十年甚至百年规模的活动,夏季风的变化是季节性甚至更长时间尺度的变化,而浊流是一个持续数小时至数天的短暂事件。因此,不稳定的沉积物供应或夏季风的变化可能不是浊流形成的直接触发机制,它可能是由火山、地震和某些极端气候事件(如暴雨)等引发的,这些事件通常具有较大的随机性和不确定性。在沉积物供应不稳定的背景下,就很容易触发浊流的发生;在相对稳定的沉积物供应期间(例如全新世),即使发生相同强度的火山或地震事件,发生浊流活动的可能性也要小得多[43]。海平面变化引起的沉积物不稳定对该区域浊流活动的重要性在于它增加了浊流活动发生的概率,使得浊流活动更易于发生,并不直接触发浊流活动。
4. 结论
(1)ZK3岩心主要发育了36 kaBP以来的晚更新世和全新世地层。该岩心晚更新世地层沉积速率高于全新世地层,全新世平均沉积速率为78.94 cm/ka,晚更新世平均沉积速率为93.05 cm/ka。
(2)通过AMS14C、沉积物粒度特征、地球化学特征、萨哈-兰迪姆相浊流环境判别、C-M图等综合分析,发现ZK3岩心发育了4个小型浊流沉积层,其中3次发生于末次冰期,1次发生于全新世期间。
(3)浊流沉积层在中值粒径、分选系数、偏态、峰态等粒度参数特征和地球化学元素特征上与正常沉积存在明显的差异,这些差异成为识别浊积层的有效标志。
(4)浊流沉积主要来自西北部莺琼陆坡区,较陡的坡度、丰富的物源、活跃的海平面变化及气候变化是触发浊流的主要因素。
-
![]()
图 1 研究区域和采样站
a:东海的表层沉积物和岩芯 CS11(深蓝色方块),b:西太平洋岩芯顶部沉积物。图中显示了东海现代夏、冬季风和主要海表洋流,包括东亚冬季风、东亚夏季风、长江冲淡水、 台湾暖流、黑潮和对马暖流。标记了本研究中相关的岩芯,包括 PC-1[22]、255[11]、1202B[33-34]、A03-B[35]、Oki02[36]和 MD063-05[37]。图b中虚线正方形所划区域是图a的所在区域,灰线画圈区域为浙闽泥质区。
Figure 1. Study area and sampling stations
a: surface sediment and core CS11 in the ECS (dark blue square). b: top-core sediment in the western Pacific. Modern summer and winter monsoon and major surface currents in the East China Sea are shown, including East Asian winter monsoon, East Asian summer monsoon, Changjiang River Diluted Water, Taiwan Warm Current, Kuroshio and Tsushima Warm current. The cores used to correlate in this study are marked, including PC-1[22], 255[11], 1202B [33,34], A03-B[35], Oki02 [36], and MD063–05[37]. The dotted line square is the region of (a). The area of grey line means the Zhe-Min mud area. The color in (b) is the sea surface salinity.
![]()
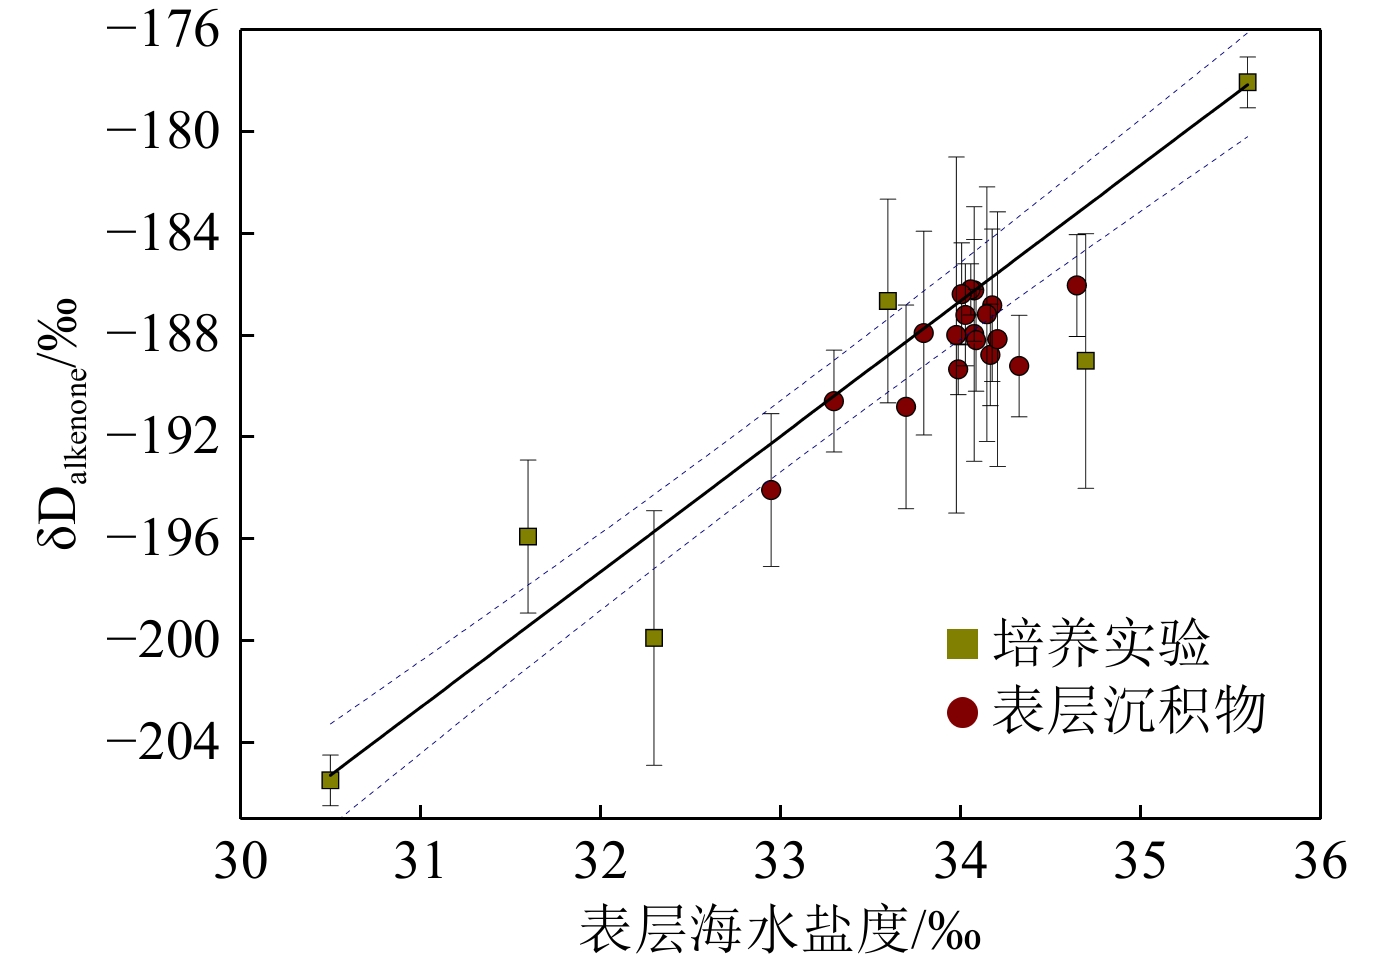
图 3 海表盐度与烯酮的氢同位素比率
Figure 3. Surface water salinity vs hydrogen isotope ratios of alkenones
![]()
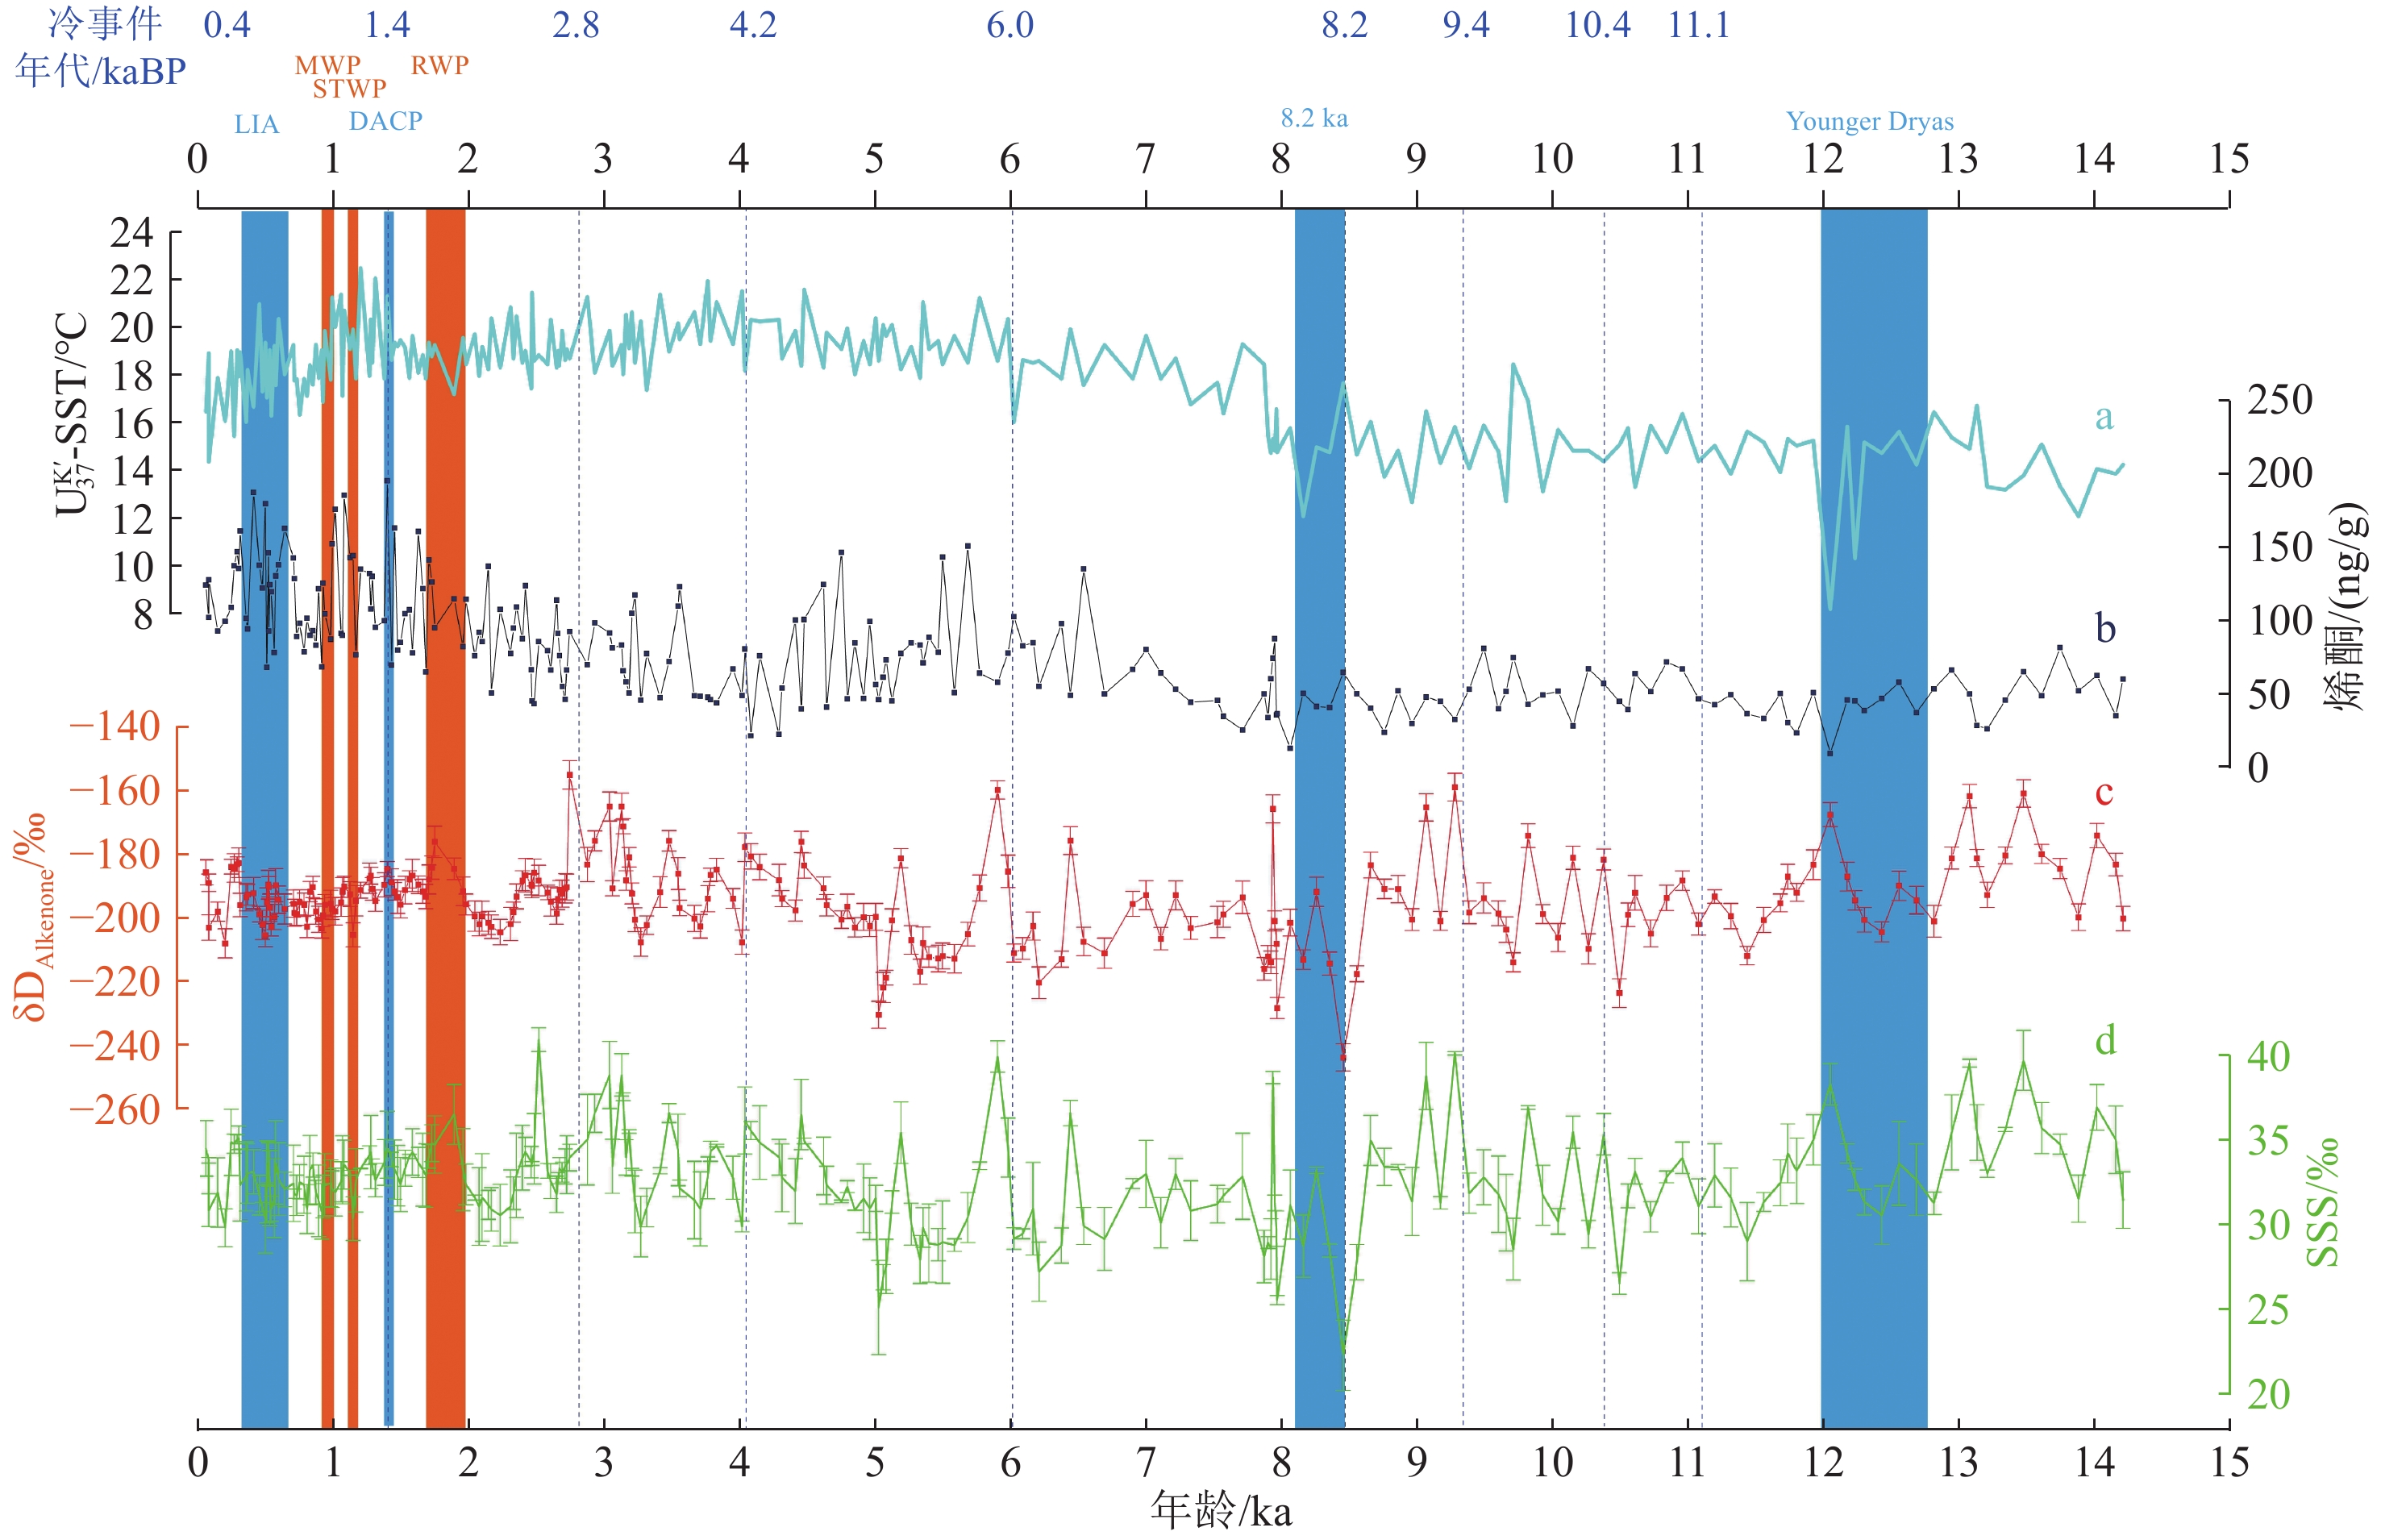
图 4 烯酮浓度的变化、
Uk'37 -SST、δDAlkenone与东海δDAlkenone的表层盐度a:Uk'37-SST,b:烯酮浓度,c:δDAlkenone,d:表层盐度(SSS)。浅蓝色和橙色阴影分别表示变冷事件和变暖事件。
Figure 4. Variations of alkenone concentrations, SST based on
Uk'37 , δDAlkenones, and SSS derived from δDAlkenones in the ECSa:Uk'37-SST, b: alkenone concentrations, c: δDAlkenones, d: SSS. The light blue and orange shadows indicate the cold and warm events, respectively.
![]()
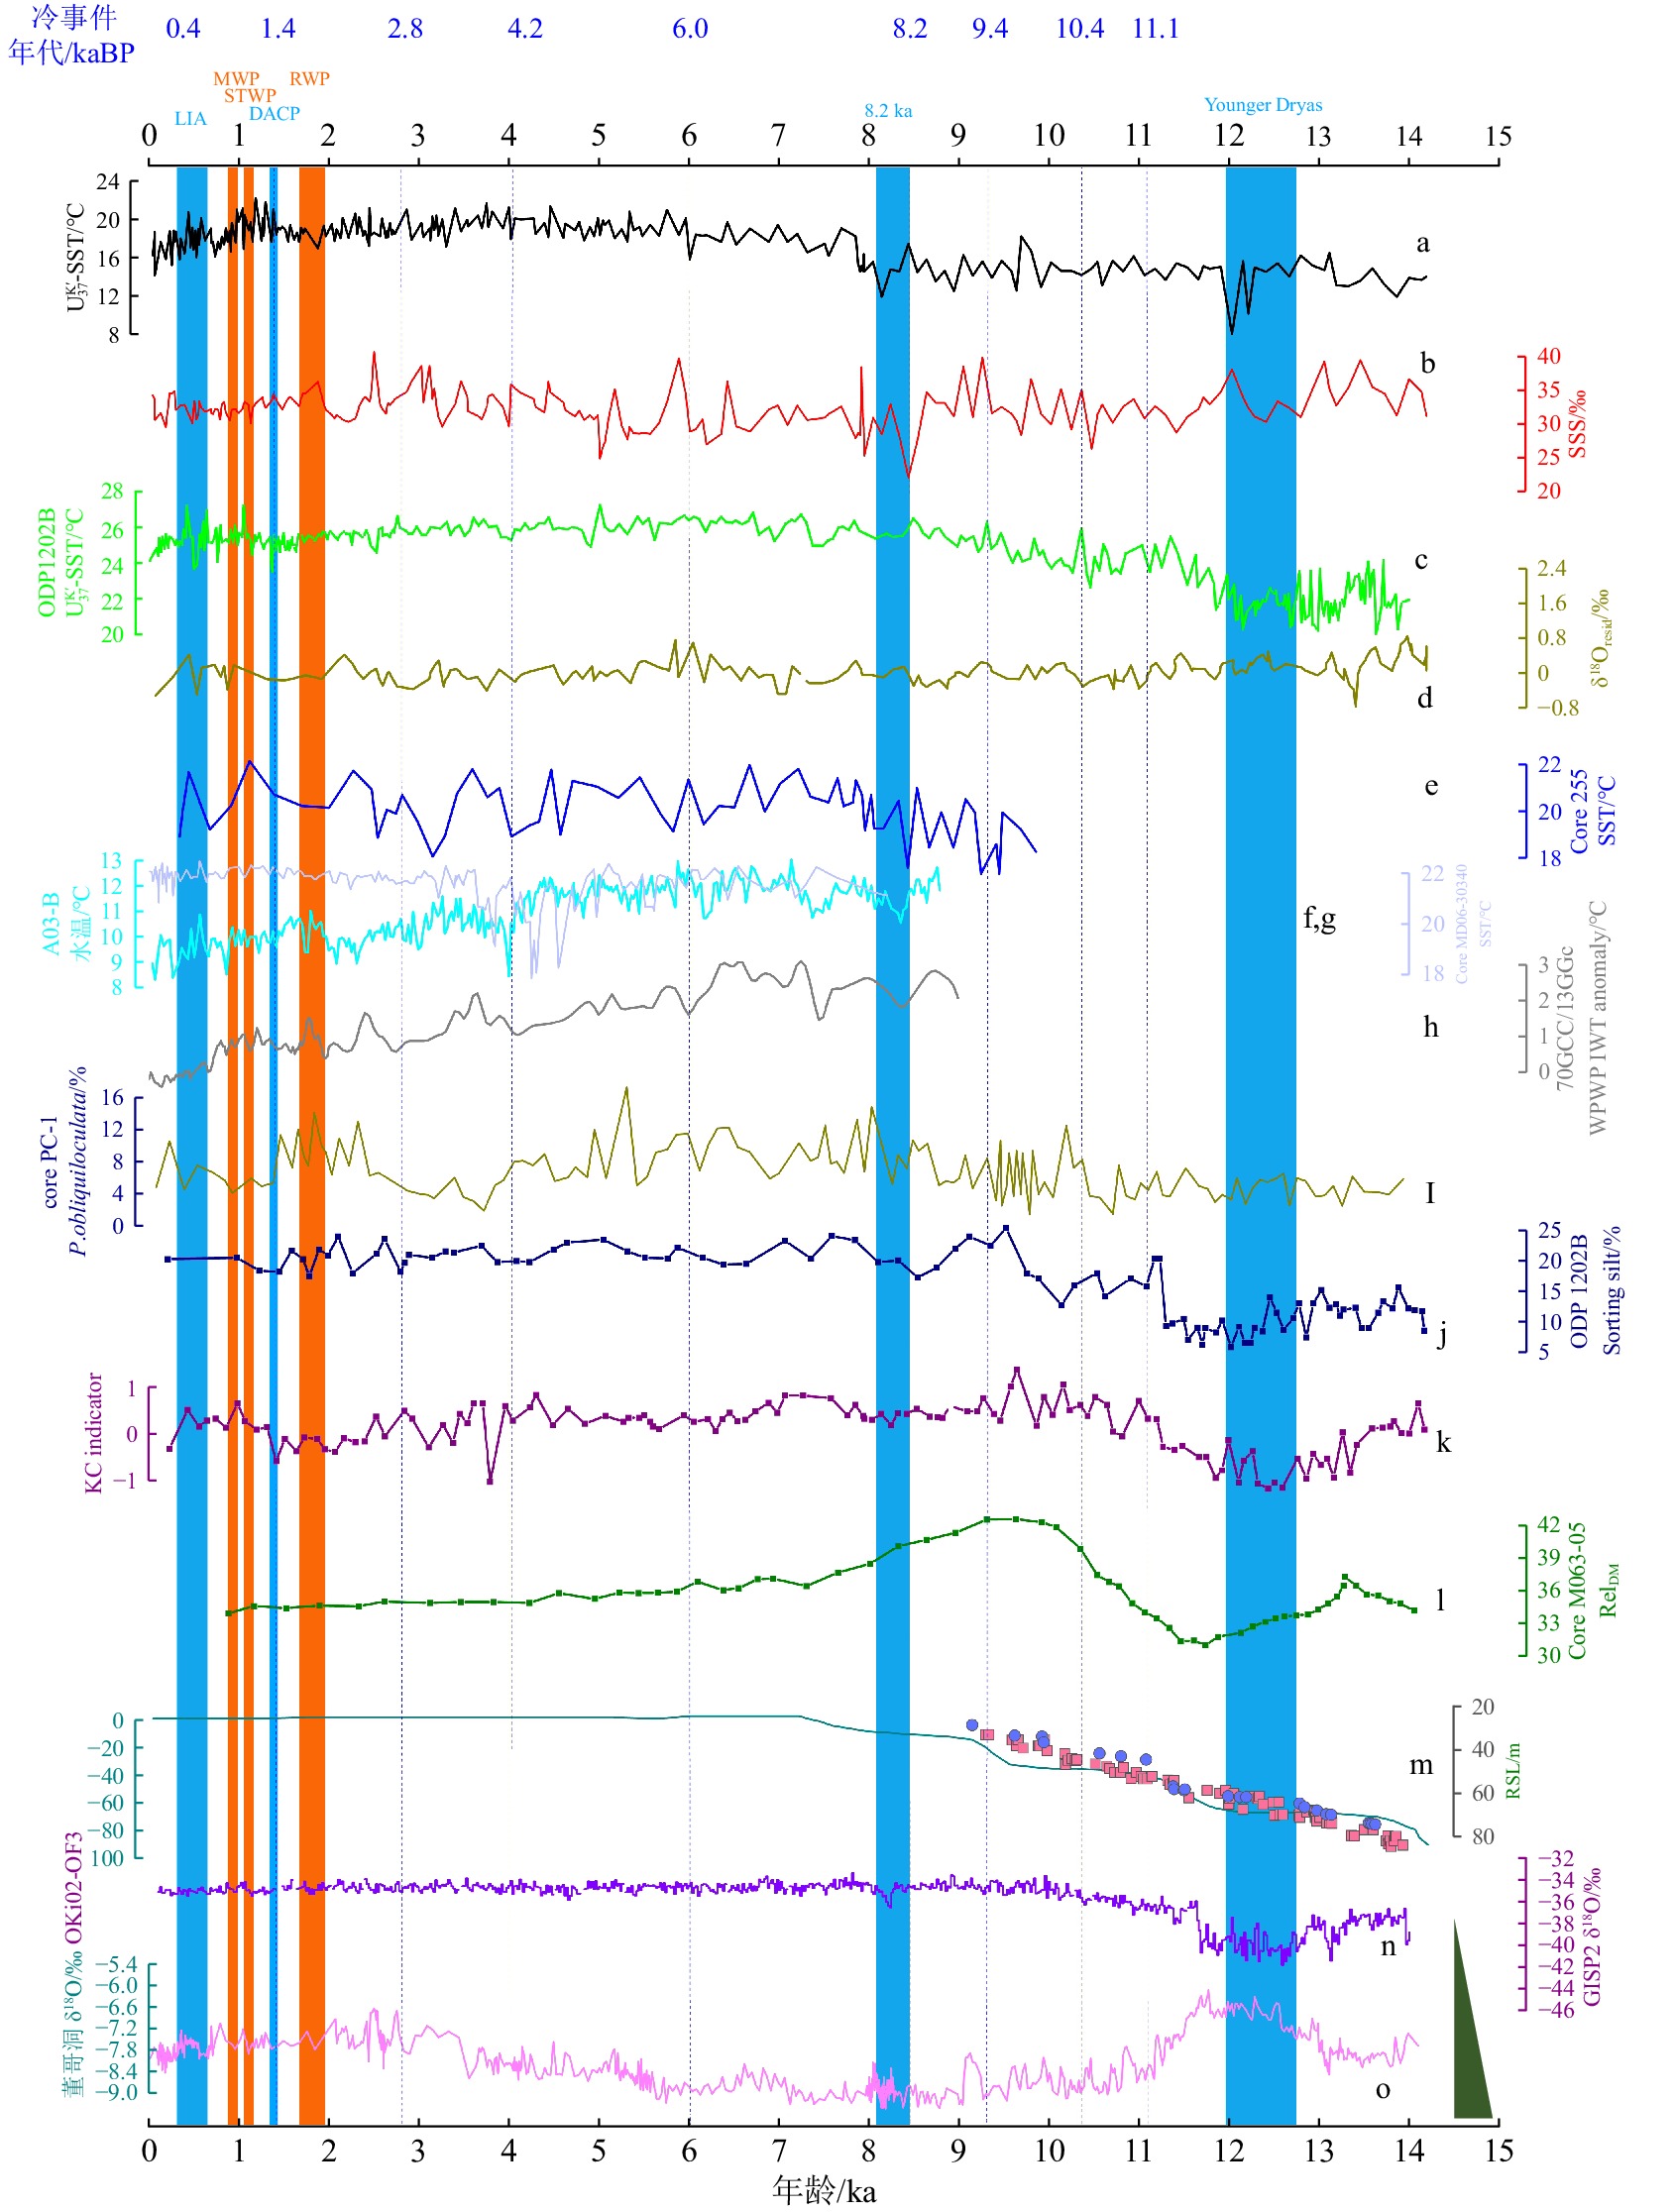
图 5 东海古环境演化与选定古气候数据的比较
a:东海的Uk'37-SST,b:东海的δDAlkenone,c:ODP1202B的Uk'37-SST[33],d:KY07-04- 01 岩芯的 δ18Oresid 记录[63],e:255岩芯表层水温记录[11],f:A03-B 的水温[35],g:MD06-3040 的表层水温[48],h:来自 70GGC 和 13GGC 的西太平洋暖池中间水温(IWT)异常[60],i:PC-1中 P. obliquilocatata 丰度[17],j:ODP 1202B 岩芯淤泥分拣[34],k:Oki02 的黑潮(KC)指标[36],l:岩芯 M063-05的RelDM[87],m:东海海平面(SL)[49]和巴巴多斯岛(RSL,粉色方块)和大溪地岛(蓝色圆点)的相对海平面[64],n:格陵兰岛冰芯δ 18O 记录,o:董哥洞石笋 δ 18O记录[65-66]。
Figure 5. Comparisons of the paleoenvironmental evolution from the ECS with selected paleoclimatic data
a:Uk'37-SST record from the ECS, b: δDAlkenones-SSS record from the ECS, c:Uk'37-SST from core ODP 1202B[33], d: δ18Oresid record from core KY07–04-01[63], e: SST record from core 255[11], f: water temperature from A03-B[35], g: SST in core MD06–3040[48], h: WPWP intermediate water temperature (IWT) anomaly from cores 70GGC and 13GGC[60], i: abundance (%) of P. obliquiloculatata from core PC-1[17], j: sorting silt in Core ODP 1202B[34], k: KC indicator in core Oki02[36], l: RelDM in core M063–05[87], m: sea level of the ECS (SL)[49] and the relative sea level of Barbados (RSL, pink square) and Tahiti (blue dot)[64], n: Ice core δ18O record from Greenland, o: Stalagmites δ18O records in the Dongge Cave[65-66].
![]()
图 6 岩芯 CS11的表层水温(a)和表层盐度(b)时间序列的频谱分析结果
峰值上方的数字表示周期,虚线表示 95% 的置信水平。
Figure 6. Spectral analysis of SST (a) and SSS (b) time series of Core CS11
Numbers above peaks denote respective periods. The dotted lines indicate the confidence levels of 95%.
![]()
图 7 全新世期间与高纬度气候过程和热带太平洋作用力有关的东海的表层水温和表层盐度变化模式
KC:黑潮,TWC:台湾暖流,EAWM:东亚冬季风,EASM:东亚夏季风,ZMCC:浙闽沿岸流。
Figure 7. A schematic model of SST and SSS changes in the ECS associated with high-latitude climate processes and tropical Pacific forcing during the Holocene
KC: Kuroshio Currents; TWC: Taiwan Warm Current; EAWM: East Asian Winter monsoon; EASM: East Asian Summer monsoon; ZMCC: Zhe-Min Coastal Current.
-
[1] 王丹. 全新世以来西北大西洋沉积物记录的古气候变化研究[D]. 上海海洋大学硕士学位论文, 2021 WANG Dan. Research on paleoclimate changes recorded by sediments in the Northwest Atlantic since Holocene[D]. Master Dissertation of Shanghai Ocean University, 2021.
[2] 姜大膀, 田芝平, 王娜, 等. 末次冰盛期和中全新世气候模拟分析进展[J]. 地球科学进展, 2022, 37(1): 1-13 JIANG Dabang, TIAN Zhiping, WANG Na, et al. Progress of Last Glacial Maximum and Mid-Holocene climate modeling analyses[J]. Advances in Earth Science, 2022, 37(1): 1-13.
[3] 赵亮. 早、中、晚全新世气候年代际变化特征及成因分析[D]. 南京师范大学硕士学位论文, 2021 ZHAO Liang. Interdecadal variation and attribution of climate during Early, Middle and Late Holocene[D]. Master Dissertation of Nanjing Normal University, 2021.
[4] Alley R B, Marotzke J, Nordhaus W D, et al. Abrupt climate change[J]. Science, 2003, 299(5615): 2005-2010. doi: 10.1126/science.1081056
[5] IPCC. Climate Change 2007: The Physical Science Basis[C]. Geneva: IPCC, 2007.
[6] Liu J P, Xu K H, Li A C, et al. Flux and fate of Yangtze River sediment delivered to the East China Sea[J]. Geomorphology, 2007, 85(3-4): 208-224. doi: 10.1016/j.geomorph.2006.03.023
[7] Li X Y, Jian Z M, Shi X F, et al. A Holocene record of millennial-scale climate changes in the mud area on the inner shelf of the East China Sea[J]. Quaternary International, 2015, 384: 22-27. doi: 10.1016/j.quaint.2014.11.030
[8] 石学法, 刘升发, 乔淑卿, 等. 中国东部近海沉积物地球化学: 分布特征、控制因素与古气候记录[J]. 矿物岩石地球化学通报, 2015, 34(5): 885-894 SHI Xuefa, LIU Shengfa, QIAO Shuqing, et al. Geochemical characteristics, controlling factor and record of paleoclimate in sediments from Eastern China Seas[J]. Bulletin of Mineralogy, Petrology and Geochemistry, 2015, 34(5): 885-894.
[9] 李超, 蓝东兆, 方琦. 东海陆架晚第四纪沉积硅藻及其古海洋学意义[J]. 台湾海峡, 2002, 21(3): 351-359 LI Chao, LAN Dongzhao, FANG Qi. Late Quaternary sedimentary diatom from East China Sea continental shelf and its paleoceanographical significance[J]. Journal of Oceanography in Taiwan Strait, 2002, 21(3): 351-359.
[10] 程振波, 刘振夏, 石学法, 等. 东海DGKS96-03岩心中微体化石的古海洋学特点、δ18O曲线与AMS14C测年[J]. 沉积学报, 2000, 18(4): 501-505 CHENG Zhenbo, LIU Zhenxia, SHI Xuefa, et al. Paleoceanographic characteristics of microfossils, δ18O curve and AMS14C dating in the core DGKS96-03 from the East China Sea[J]. Acta Sedimentologica Sinica, 2000, 18(4): 501-505.
[11] Jian Z M, Wang P X, Saito Y, et al. Holocene variability of the Kuroshio current in the Okinawa Trough, northwestern Pacific Ocean[J]. Earth and Planetary Science Letters, 2000, 184(1): 305-319. doi: 10.1016/S0012-821X(00)00321-6
[12] 史光辉. 东海陆架泥质区底栖有孔虫记录及其环境意义[D]. 中国海洋大学硕士学位论文, 2013 SHI Guanghui. Benthic foraminifera response to changes in paleoenviornments of Mud area on the East China Sea shelf[D]. Master Dissertation of Ocean University of China, 2013.
[13] Liu S F, Shi X F, Liu Y G, et al. Records of the East Asian winter monsoon from the mud area on the inner shelf of the East China Sea since the mid-Holocene[J]. Chinese Science Bulletin, 2010, 55(21): 2306-2314. doi: 10.1007/s11434-010-3215-3
[14] 贾培蒙, 庄振业, 叶银灿, 等. 东海陆架中南部末次盛冰期以来的沉积地层及环境演变[J]. 海洋地质前沿, 2012, 28(8): 20-26 JIA Peimeng, ZHUANG Zhenye, YE Yincan, et al. Sedimentary strata after last glacial maximum on central and South East China Sea shelf and environmental evolution[J]. Marine Geology Frontiers, 2012, 28(8): 20-26.
[15] Xu K H, Li A C, Liu J P, et al. Provenance, structure, and formation of the mud wedge along inner continental shelf of the East China Sea: a synthesis of the Yangtze dispersal system[J]. Marine Geology, 2012, 291-294: 176-191. doi: 10.1016/j.margeo.2011.06.003
[16] Li G X, Li P, Liu Y, et al. Sedimentary system response to the global sea level change in the East China Seas since the last glacial maximum[J]. Earth-Science Reviews, 2014, 139: 390-405. doi: 10.1016/j.earscirev.2014.09.007
[17] Xu F J, Hu B Q, Dou Y G, et al. Sediment provenance and paleoenvironmental changes in the northwestern shelf mud area of the South China Sea since the mid-Holocene[J]. Continental Shelf Research, 2017, 144: 21-30. doi: 10.1016/j.csr.2017.06.013
[18] Jia Y H, Li D W, Yu M, et al. High- and low-latitude forcing on the south Yellow Sea surface water temperature variations during the Holocene[J]. Global and Planetary Change, 2019, 182: 103025. doi: 10.1016/j.gloplacha.2019.103025
[19] Huang J, Wan S M, Zhang J, et al. Mineralogical and isotopic evidence for the sediment provenance of the western South Yellow Sea since MIS 3 and implications for paleoenvironmental evolution[J]. Marine Geology, 2019, 414: 103-117. doi: 10.1016/j.margeo.2019.05.011
[20] Xu Y, Chang F M, Li T G, et al. High-resolution sea surface temperature and salinity dynamics in the northern Okinawa trough over the last 24 Kyr[J]. Palaeoworld, 2021, 30(4): 770-785. doi: 10.1016/j.palwor.2020.12.005
[21] 王郑雷, 曾阳, 刘力宽, 等. 生物标志物在全新世古气候和古环境研究中的应用进展[J]. 环境监测管理与技术, 2022, 34(6): 9-13 WANG Zhenglei, ZENG Yang, LIU Likuan, et al. Application of biomarkers in Holocene paleoclimate and paleoenvironment: A review[J]. The Administration and Technique of Environmental Monitoring, 2022, 34(6): 9-13.
[22] 陈立雷. 东海闽浙沿岸全新世古气候和古环境演变的生物标志物记录[D]. 中国地质大学博士学位论文, 2018 CHEN Lilei. Biomarker records from the Zhejiang-Fujian Coast, East China Sea: Implications for paleoclimatic and palaeoenvironmental changes in Holocene[D]. Doctor Dissertation of China University of Geosciences, 2018.
[23] Nan Q Y, Li T G, Chen J X, et al. High resolution unsaturated alkenones sea surface temperature records in the Yellow Sea during the period of 3500-1300 cal. yr BP[J]. Quaternary International, 2017, 441: 107-116. doi: 10.1016/j.quaint.2016.10.025
[24] Chen C T A. Chemical and physical fronts in the Bohai, Yellow and East China seas[J]. Journal of Marine Systems, 2009, 78(3): 394-410. doi: 10.1016/j.jmarsys.2008.11.016
[25] Li D W, Zhao M X, Tian J. Low-high latitude interaction forcing on the evolution of the 400 kyr cycle in East Asian winter monsoon records during the last 2.8 Myr[J]. Quaternary Science Reviews, 2017, 172: 72-82. doi: 10.1016/j.quascirev.2017.08.005
[26] Webster P J, Magaña V O, Palmer T N, et al. Monsoons: Processes, predictability, and the prospects for prediction[J]. Journal of Geophysical Research: Oceans, 1998, 103(C7): 14451-14510. doi: 10.1029/97JC02719
[27] Hsueh Y, Schultz J R, Holland W R. The Kuroshio flow-through in the East China Sea: A numerical model[J]. Progress in Oceanography, 1997, 39(2): 79-108. doi: 10.1016/S0079-6611(97)00008-6
[28] 王建丰, 司广成, 于非. 台湾暖流变化特征及机制研究进展[J]. 海洋科学, 2020, 44(5): 141-148 WANG Jianfeng, SI Guangcheng, YU Fei. Progress in studies of the characteristics and mechanisms of variations in the Taiwan warm current[J]. Marine Sciences, 2020, 44(5): 141-148.
[29] Che H, Zhang J. Water mass analysis and end–member mixing contribution using coupled radiogenic Nd isotopes and Nd concentrations: Interaction between marginal seas and the northwestern Pacific[J]. Geophysical Research Letters, 2018, 45(5): 2388-2395. doi: 10.1002/2017GL076978
[30] Zhang J, Liu S M, Ren J L, et al. Nutrient gradients from the eutrophic Changjiang (Yangtze River) Estuary to the oligotrophic Kuroshio waters and re-evaluation of budgets for the East China Sea Shelf[J]. Progress in Oceanography, 2007, 74(4): 449-478. doi: 10.1016/j.pocean.2007.04.019
[31] Chen C T A. Downwelling then upwelling again of the upwelled Kuroshio water in the southern East China Sea[J]. Journal of Geophysical Research: Oceans, 2011, 116: C07003.
[32] Xing L, Zhao M X, Zhang T, et al. Ecosystem responses to anthropogenic and natural forcing over the last 100 years in the coastal areas of the East China Sea[J]. The Holocene, 2016, 26(5): 669-677. doi: 10.1177/0959683615618248
[33] Ruan J P, Xu Y P, Ding S, et al. A high resolution record of sea surface temperature in southern Okinawa Trough for the past 15, 000 years[J]. Palaeogeography, Palaeoclimatology, Palaeoecology, 2015, 426: 209-215. doi: 10.1016/j.palaeo.2015.03.007
[34] Diekmann B, Hofmann J, Henrich R, et al. Detrital sediment supply in the southern Okinawa Trough and its relation to sea-level and Kuroshio dynamics during the late Quaternary[J]. Marine Geology, 2008, 255(1-2): 83-95. doi: 10.1016/j.margeo.2008.08.001
[35] Li D W, Yu M, Jia Y H, et al. Gradually cooling of the Yellow Sea Warm Current driven by tropical Pacific subsurface water temperature changes over the past 5 kyr[J]. Geophysical Research Letters, 2021, 48(10): e2021GL093534. doi: 10.1029/2021GL093534
[36] Zheng X F, Li A C, Kao S, et al. Synchronicity of Kuroshio current and climate system variability since the Last Glacial Maximum[J]. Earth and Planetary Science Letters, 2016, 452: 247-257. doi: 10.1016/j.jpgl.2016.07.028
[37] Li Q, Li G X, Chen M T, et al. New insights into Kuroshio current evolution since the last deglaciation based on paired organic paleothermometers from the middle Okinawa Trough[J]. Paleoceanography and Paleoclimatology, 2020, 35(12): e2020PA004140.
[38] Stuiver M, Reimer P J. Extended 14C data base and revised CALIB 3.0 14C age calibration program[J]. Radiocarbon, 1993, 35(1): 215-230. doi: 10.1017/S0033822200013904
[39] Reimer P J, Bard E, Bayliss A, et al. IntCal13 and Marine13 radiocarbon age calibration curves 0-50, 000 years cal BP[J]. Radiocarbon, 2013, 55(4): 1869-1887. doi: 10.2458/azu_js_rc.55.16947
[40] Yoneda M, Uno H, Shibata Y, et al. Radiocarbon marine reservoir ages in the western Pacific estimated by pre-bomb molluscan shells[J]. Nuclear Instruments and Methods in Physics Research Section B: Beam Interactions with Materials and Atoms, 2007, 259(1): 432-437. doi: 10.1016/j.nimb.2007.01.184
[41] Bai J, Gu X Y, Feng Y Y, et al. Autumn living coccolithophores in the Yellow Sea and the East China Sea[J]. Acta Oceanologica Sinica, 2014, 33(8): 83-94. doi: 10.1007/s13131-014-0481-y
[42] Sun J, Gu X Y, Feng Y Y, et al. Summer and winter living coccolithophores in the Yellow Sea and the East China Sea[J]. Biogeosciences, 2014, 11(3): 779-806. doi: 10.5194/bg-11-779-2014
[43] Weiss G M, Pfannerstill E Y, Schouten S, et al. Effects of alkalinity and salinity at low and high light intensity on hydrogen isotope fractionation of long-chain alkenones produced by Emiliania huxleyi[J]. Biogeosciences, 2017, 14(24): 5693-5704. doi: 10.5194/bg-14-5693-2017
[44] Weiss G M, Schouten S, Sinninghe Damsté J S, et al. Constraining the application of hydrogen isotopic composition of alkenones as a salinity proxy using marine surface sediments[J]. Geochimica et Cosmochimica Acta, 2019, 250: 34-48. doi: 10.1016/j.gca.2019.01.038
[45] Schulz M, Mudelsee M. REDFIT: estimating red-noise spectra directly from unevenly spaced paleoclimatic time series[J]. Computers & Geosciences, 2002, 28(3): 421-426.
[46] 秦蕴珊, 赵一阳, 陈丽蓉, 等. 东海地质[M]. 北京: 科学出版社, 1987 QIN Yunshan, ZHAO Yiyang, CHEN Lirong, et al. Geology in the East China Sea[M]. Beijing: Science Press, 1987.
[47] Li G X, Sun X Y, Liu Y, et al. Sea surface temperature record from the north of the East China Sea since late Holocene[J]. Chinese Science Bulletin, 2009, 54(23): 4507-4513.
[48] Kajita H, Kawahata H, Wang K, et al. Extraordinary cold episodes during the mid-Holocene in the Yangtze delta: Interruption of the earliest rice cultivating civilization[J]. Quaternary Science Reviews, 2018, 201: 418-428. doi: 10.1016/j.quascirev.2018.10.035
[49] Zheng X F, Li A C, Wan S M, et al. ITCZ and ENSO pacing on east Asian winter monsoon variation during the Holocene: Sedimentological evidence from the Okinawa Trough[J]. Journal of Geophysical Research: Oceans, 2014, 119(7): 4410-4429. doi: 10.1002/2013JC009603
[50] 张军强, 唐璐璐, 邹昊. 晚更新世以来古气候与海平面变化在东海地区的响应[J]. 海洋湖沼通报, 2008(1): 25-31 doi: 10.3969/j.issn.1003-6482.2008.01.004 ZHANG Junqiang, TANG Lulu, ZOU Hao. The response to the variety of paleoclimate and sea level in the East China Sea after the late pleistocence[J]. Transactions of Oceanology and Limnology, 2008(1): 25-31. doi: 10.3969/j.issn.1003-6482.2008.01.004
[51] 庄丽华. 黄东海陆架晚第四纪古环境演化及海平面变化[D]. 中国科学院研究生院(海洋研究所)博士学位论文, 2002 ZHUANG Lihua. The Late Quaternary paleo-environmental evolution and sea level change in the Yellow sea and the East China Sea[D]. Doctor Dissertation of Graduate School of Chinese Academy of Sciences (Institute of Oceanography), 2002.
[52] He W, Liu J G, Huang Y, et al. Sea level change controlled the sedimentary processes at the makran continental margin over the past 13, 000yr[J]. Journal of Geophysical Research: Oceans, 2020, 125(3): e2019JC015703. doi: 10.1029/2019JC015703
[53] Marlowe I T, Brassell S C, Eglinton G, et al. Long chain unsaturated ketones and esters in living algae and marine sediments[J]. Organic Geochemistry, 1984, 6: 135-141. doi: 10.1016/0146-6380(84)90034-2
[54] Thiagarajan N, Subhas A V, Southon J R, et al. Abrupt pre-Bølling-Allerød warming and circulation changes in the deep ocean[J]. Nature, 2014, 511(7507): 75-78. doi: 10.1038/nature13472
[55] Li T G, Sun R T, Zhang D Y, et al. Evolution and variation of the Tsushima warm current during the late quaternary: evidence from planktonic foraminifera, oxygen and carbon isotopes[J]. Science in China Series D: Earth Sciences, 2007, 50(5): 725-735. doi: 10.1007/s11430-007-0003-2
[56] Liu X, Chiang K P, Liu S M, et al. Influence of the Yellow Sea warm current on phytoplankton community in the Central Yellow Sea[J]. Deep Sea Research Part I: Oceanographic Research Papers, 2015, 106: 17-29. doi: 10.1016/j.dsr.2015.09.008
[57] Wang Y J, Cheng H, Edwards R L, et al. A high-resolution absolute-dated late Pleistocene monsoon record from Hulu Cave, China[J]. Science, 2001, 294(5550): 2345-2348. doi: 10.1126/science.1064618
[58] 王江月, 白伟明, 王照波, 等. 中国东部地区全新世气候演化及其与气候事件的对应性[J]. 海洋地质与第四纪地质, 2022, 42(2): 167-177 doi: 10.16562/j.cnki.0256-1492.2021122001 WANG Jiangyue, BAI Weiming, WANG Zhaobo, et al. The Holocene climatic evolution in Eastern China and its bearing on climatic events[J]. Marine Geology & Quaternary Geology, 2022, 42(2): 167-177. doi: 10.16562/j.cnki.0256-1492.2021122001
[59] Xu X D, Oda M. Surface-water evolution of the eastern East China Sea during the last 36, 000 years[J]. Marine Geology, 1999, 156(1-4): 285-304. doi: 10.1016/S0025-3227(98)00183-2
[60] Rosenthal Y, Linsley B K, Oppo D W. Pacific Ocean heat content during the past 10, 000 years[J]. Science, 2013, 342(6158): 617-621. doi: 10.1126/science.1240837
[61] Stanley D J, Chen Z Y, Song J. Inundation, sea-level rise and transition from Neolithic to Bronze Age cultures, Yangtze Delta, China[J]. Geoarchaeology, 1999, 14(1): 15-26. doi: 10.1002/(SICI)1520-6548(199901)14:1<15::AID-GEA2>3.0.CO;2-N
[62] Marcott S A, Shakun J D, Clark P U, et al. A reconstruction of regional and global temperature for the past 11, 300 years[J]. Science, 2013, 339(6124): 1198-1201. doi: 10.1126/science.1228026
[63] Kubota Y, Kimoto K, Tada R, et al. Variations of East Asian summer monsoon since the last deglaciation based on Mg/Ca and oxygen isotope of planktic foraminifera in the northern East China Sea[J]. Paleoceanography and Paleoclimatology, 2010, 25(4): PA4205.
[64] Bard E, Hamelin B, Delanghe-Sabatier D. Deglacial meltwater pulse 1B and Younger Dryas sea levels revisited with boreholes at Tahiti[J]. Science, 2010, 327(5970): 1235-1237. doi: 10.1126/science.1180557
[65] Dykoski C A, Edwards R L, Cheng H, et al. A high-resolution absolute-dated Holocene and deglacial Asian monsoon record from Dongge Cave, China[J]. Earth and Planetary Science Letters, 2005, 233(1-2): 71-86. doi: 10.1016/j.jpgl.2005.01.036
[66] Wang Y J, Cheng H, Edwards R L, et al. The Holocene Asian monsoon: links to solar changes and North Atlantic climate[J]. Science, 2005, 308(5723): 854-857. doi: 10.1126/science.1106296
[67] Volkman J K, Eglinton G, Corner E D S, et al. Long-chain alkenes and alkenones in the marine coccolithophorid Emiliania huxleyi[J]. Phytochemistry, 1980, 19(12): 2619-2622. doi: 10.1016/S0031-9422(00)83930-8
[68] Volkman J K, Barrerr S M, Blackburn S I, et al. Alkenones in Gephyrocapsa oceanica: implications for studies of paleoclimate[J]. Geochimica et Cosmochimica Acta, 1995, 59(3): 513-520. doi: 10.1016/0016-7037(95)00325-T
[69] Brassell S C, Eglinton G, Marlowe I T, et al. Molecular stratigraphy: a new tool for climatic assessment[J]. Nature, 1986, 320(6058): 129-133. doi: 10.1038/320129a0
[70] Wang P X, Li Q Y, Tian J, et al. Monsoon influence on planktic δ18O records from the South China Sea[J]. Quaternary Science Reviews, 2016, 142: 26-39. doi: 10.1016/j.quascirev.2016.04.009
[71] Zhu Z M, Feinberg J M, Xie S C, et al. Holocene ENSO-related cyclic storms recorded by magnetic minerals in speleothems of central China[J]. Proceedings of the National Academy of Sciences of the United States of America, 2017, 114(5): 852-857.
[72] Milliman J D, Farnsworth K L. River Discharge to the Coastal Ocean: A Global Synthesis[M]. Cambridge: Cambridge University Press, 2013.
[73] Bond G, Kromer B, Beer J, et al. Persistent solar influence on North Atlantic climate during the Holocene[J]. Science, 2001, 294(5549): 2130-2136. doi: 10.1126/science.1065680
[74] Alley R B, Ágústsdóttir A M. The 8k event: cause and consequences of a major Holocene abrupt climate change[J]. Quaternary Science Reviews, 2005, 24(10-11): 1123-1149. doi: 10.1016/j.quascirev.2004.12.004
[75] Sun Y B, Clemens S C, Morrill C, et al. Influence of Atlantic meridional overturning circulation on the East Asian winter monsoon[J]. Nature Geoscience, 2012, 5(1): 46-49. doi: 10.1038/ngeo1326
[76] Soon W, Herrera V M V, Selvaraj K, et al. A review of Holocene solar-linked climatic variation on centennial to millennial timescales: physical processes, interpretative frameworks and a new multiple cross-wavelet transform algorithm[J]. Earth-Science Reviews, 2014, 134: 1-15. doi: 10.1016/j.earscirev.2014.03.003
[77] Russell J M, Johnson T C, Talbot M R. A 725yr cycle in the climate of central Africa during the late Holocene[J]. Geology, 2003, 31(8): 677-680. doi: 10.1130/G19449.1
[78] Stuiver M, Braziunas T F. Sun, ocean, climate and atmospheric 14CO2: an evaluation of causal and spectral relationships[J]. The Holocene, 1993, 3(4): 289-305. doi: 10.1177/095968369300300401
[79] Sagawa T, Kuwae M, Tsuruoka K, et al. Solar forcing of centennial-scale East Asian winter monsoon variability in the mid- to late Holocene[J]. Earth and Planetary Science Letters, 2014, 395: 124-135. doi: 10.1016/j.jpgl.2014.03.043
[80] Walczak M H, Mix A C, Cowan E A, et al. Phasing of millennial-scale climate variability in the Pacific and Atlantic Oceans[J]. Science, 2020, 370(6517): 716-720. doi: 10.1126/science.aba7096
[81] Emile-Geay J, Mark A C, Naomi N, et al. Warren revisited: Atmospheric freshwater fluxes and “Why is no deep water formed in the North Pacific”[J]. Journal of Geophysical Research, 2003, 108(C6): 3178. doi: 10.1029/2001JC001058
[82] Li Z Y, Chen M T, Lin D C, et al. Holocene surface hydroclimate changes in the Indo-Pacific warm pool[J]. Quaternary International, 2018, 482: 1-12. doi: 10.1016/j.quaint.2018.04.027
[83] Broccoli A J, Dahl K A, Stouffer R J. Response of the ITCZ to Northern Hemisphere cooling[J]. Geophysical Research Letters, 2006, 33(1): L01702.
[84] Oppo D W, Rosenthal Y, Linsley B K. 2, 000-year-long temperature and hydrology reconstructions from the Indo-Pacific warm pool[J]. Nature, 2009, 460(7259): 1113-1116. doi: 10.1038/nature08233
[85] Jia W, Zhang P Z, Zhang L L, et al. Highly resolved δ13C and trace element ratios of precisely dated stalagmite from northwestern China: Hydroclimate reconstruction during the last two millennia[J]. Quaternary Science Reviews, 2022, 291: 107473. doi: 10.1016/j.quascirev.2022.107473
[86] Chen F H, Xu Q H, Chen J H, et al. East Asian summer monsoon precipitation variability since the last deglaciation[J]. Scientific Reports, 2015, 5: 11186. doi: 10.1038/srep11186
[87] Li Q, Zhang Q, Li G X, et al. A new perspective for the sediment provenance evolution of the middle Okinawa Trough since the last deglaciation based on integrated methods[J]. Earth and Planetary Science Letters, 2019, 528: 115839. doi: 10.1016/j.jpgl.2019.115839
-
期刊类型引用(7)
1. 赵少泽, 谢虎斌, 芦凤明, 李宜真, 郝越翔, 李勇, 赵亮, 徐正, 张晨博, 刘逸强. 川中隆起东南部下志留统龙马溪组一段页岩形成机制. 中国矿业大学学报. 2025(04)  百度学术
百度学术
2. 张子涵,任宇鹏,陶威,许国辉,靳梓堃. 海底峡谷浊流汇流后含沙量与速度变化研究. 海洋地质与第四纪地质. 2024(04): 78-87 . 本站查看
3. 杨茜,冯秀丽,李梦帅. 南海北部莺琼陆坡浊流沉积数值模拟分析. 地质学报. 2022(04): 1412-1420 . 百度学术
4. 吴丰,罗莹莹,李昱翰,杨宗恒,张洪千,刘建锋,石祥超. 四川盆地公山庙油田大安寨段湖相灰岩-页岩裂缝特征与测井识别. 地质科技通报. 2022(05): 55-67 . 百度学术
5. 王华,陈思,刘恩涛,何杰,甘华军,孟福林,年伟豪. 南海北部莺-琼盆地典型重力流沉积特征与物源体系. 地质科技通报. 2022(05): 5-18 . 百度学术
6. 陈唯,赵彦彦,李三忠,唐智能,杨俊,魏浩天,吴佳庆,朱俊江,刘盛,董涛,张广璐,杨丹丹,孙国静. 南海北部陆坡神狐海域SH-CL38站位的粒度特征及沉积记录. 海洋地质与第四纪地质. 2021(05): 90-100 . 本站查看
7. 肖倩文,冯秀丽,苗晓明. 南海北部神狐海域SH37岩芯浊流沉积及其物源分析. 海洋地质与第四纪地质. 2021(05): 101-111 . 本站查看
其他类型引用(0)

 下载:
下载:


![图 8 研究区周边洋流分布图(洋流模式参考文献[40-41])](/fileHYDZYDSJDZ/journal/article/hydzydsjdz/2023/4/2019112701-8.jpg)