Distribution characteristics and implications of mercury in the surface sediments of the East Siberian Arctic Shelf
-
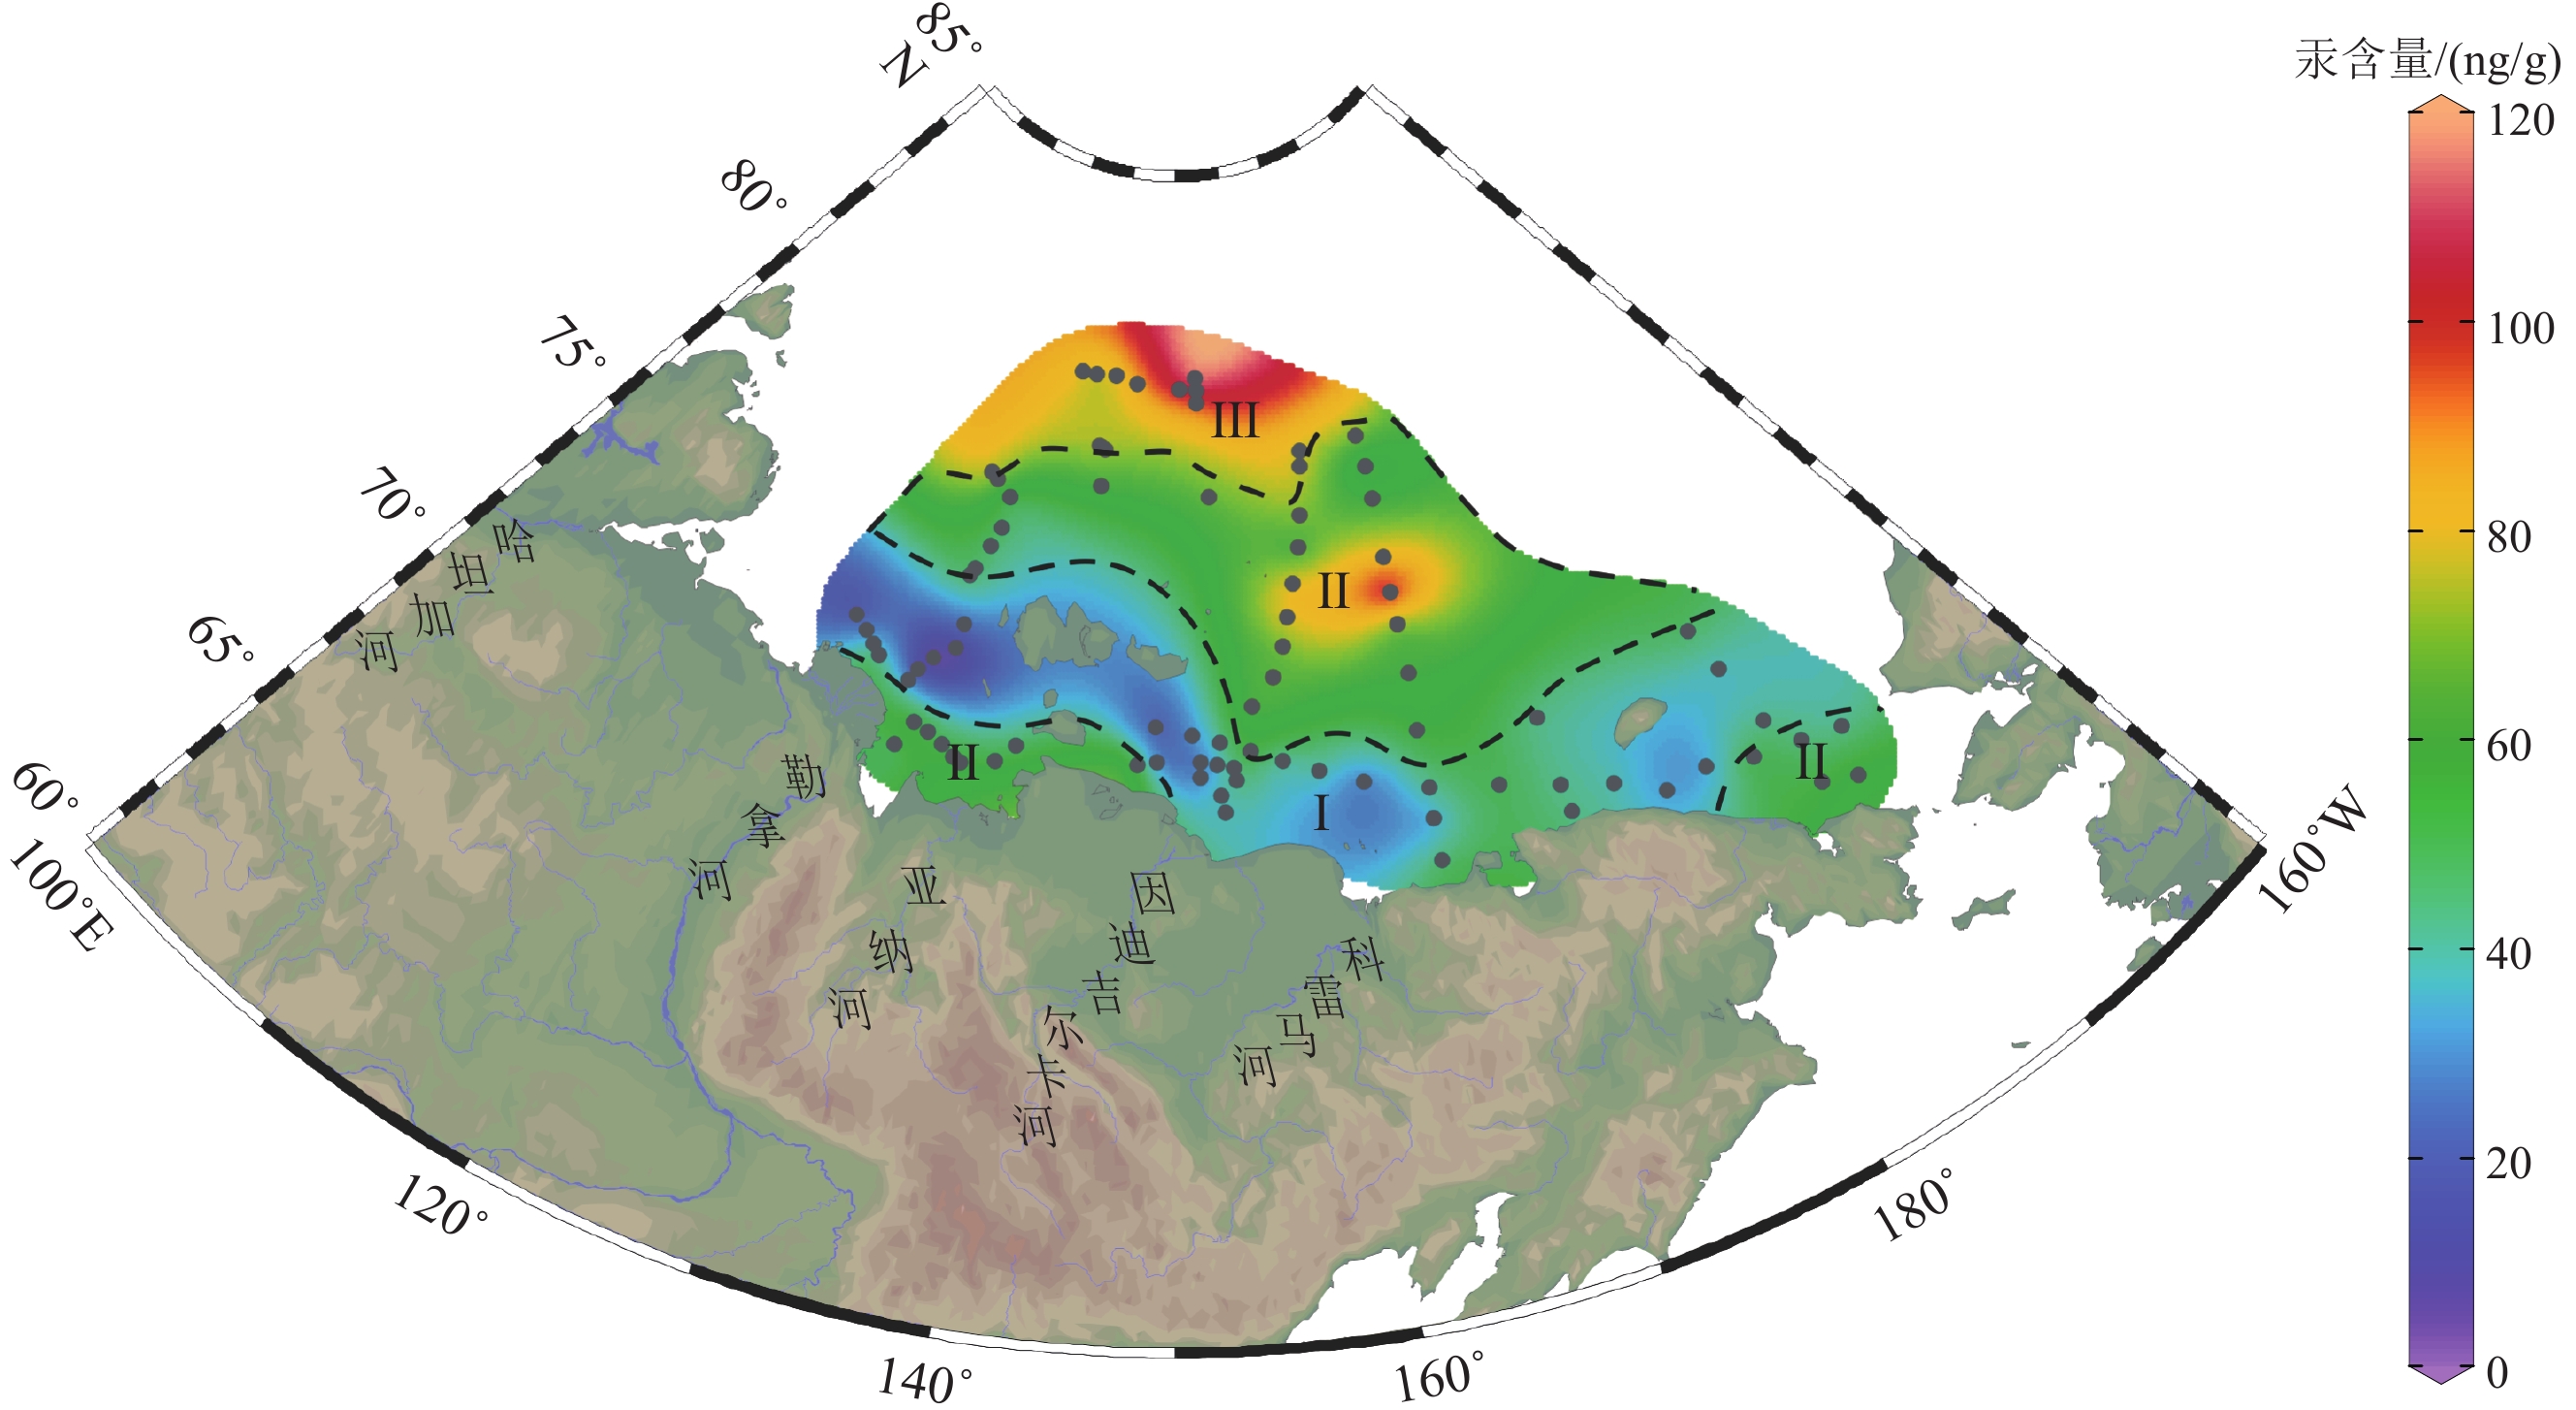
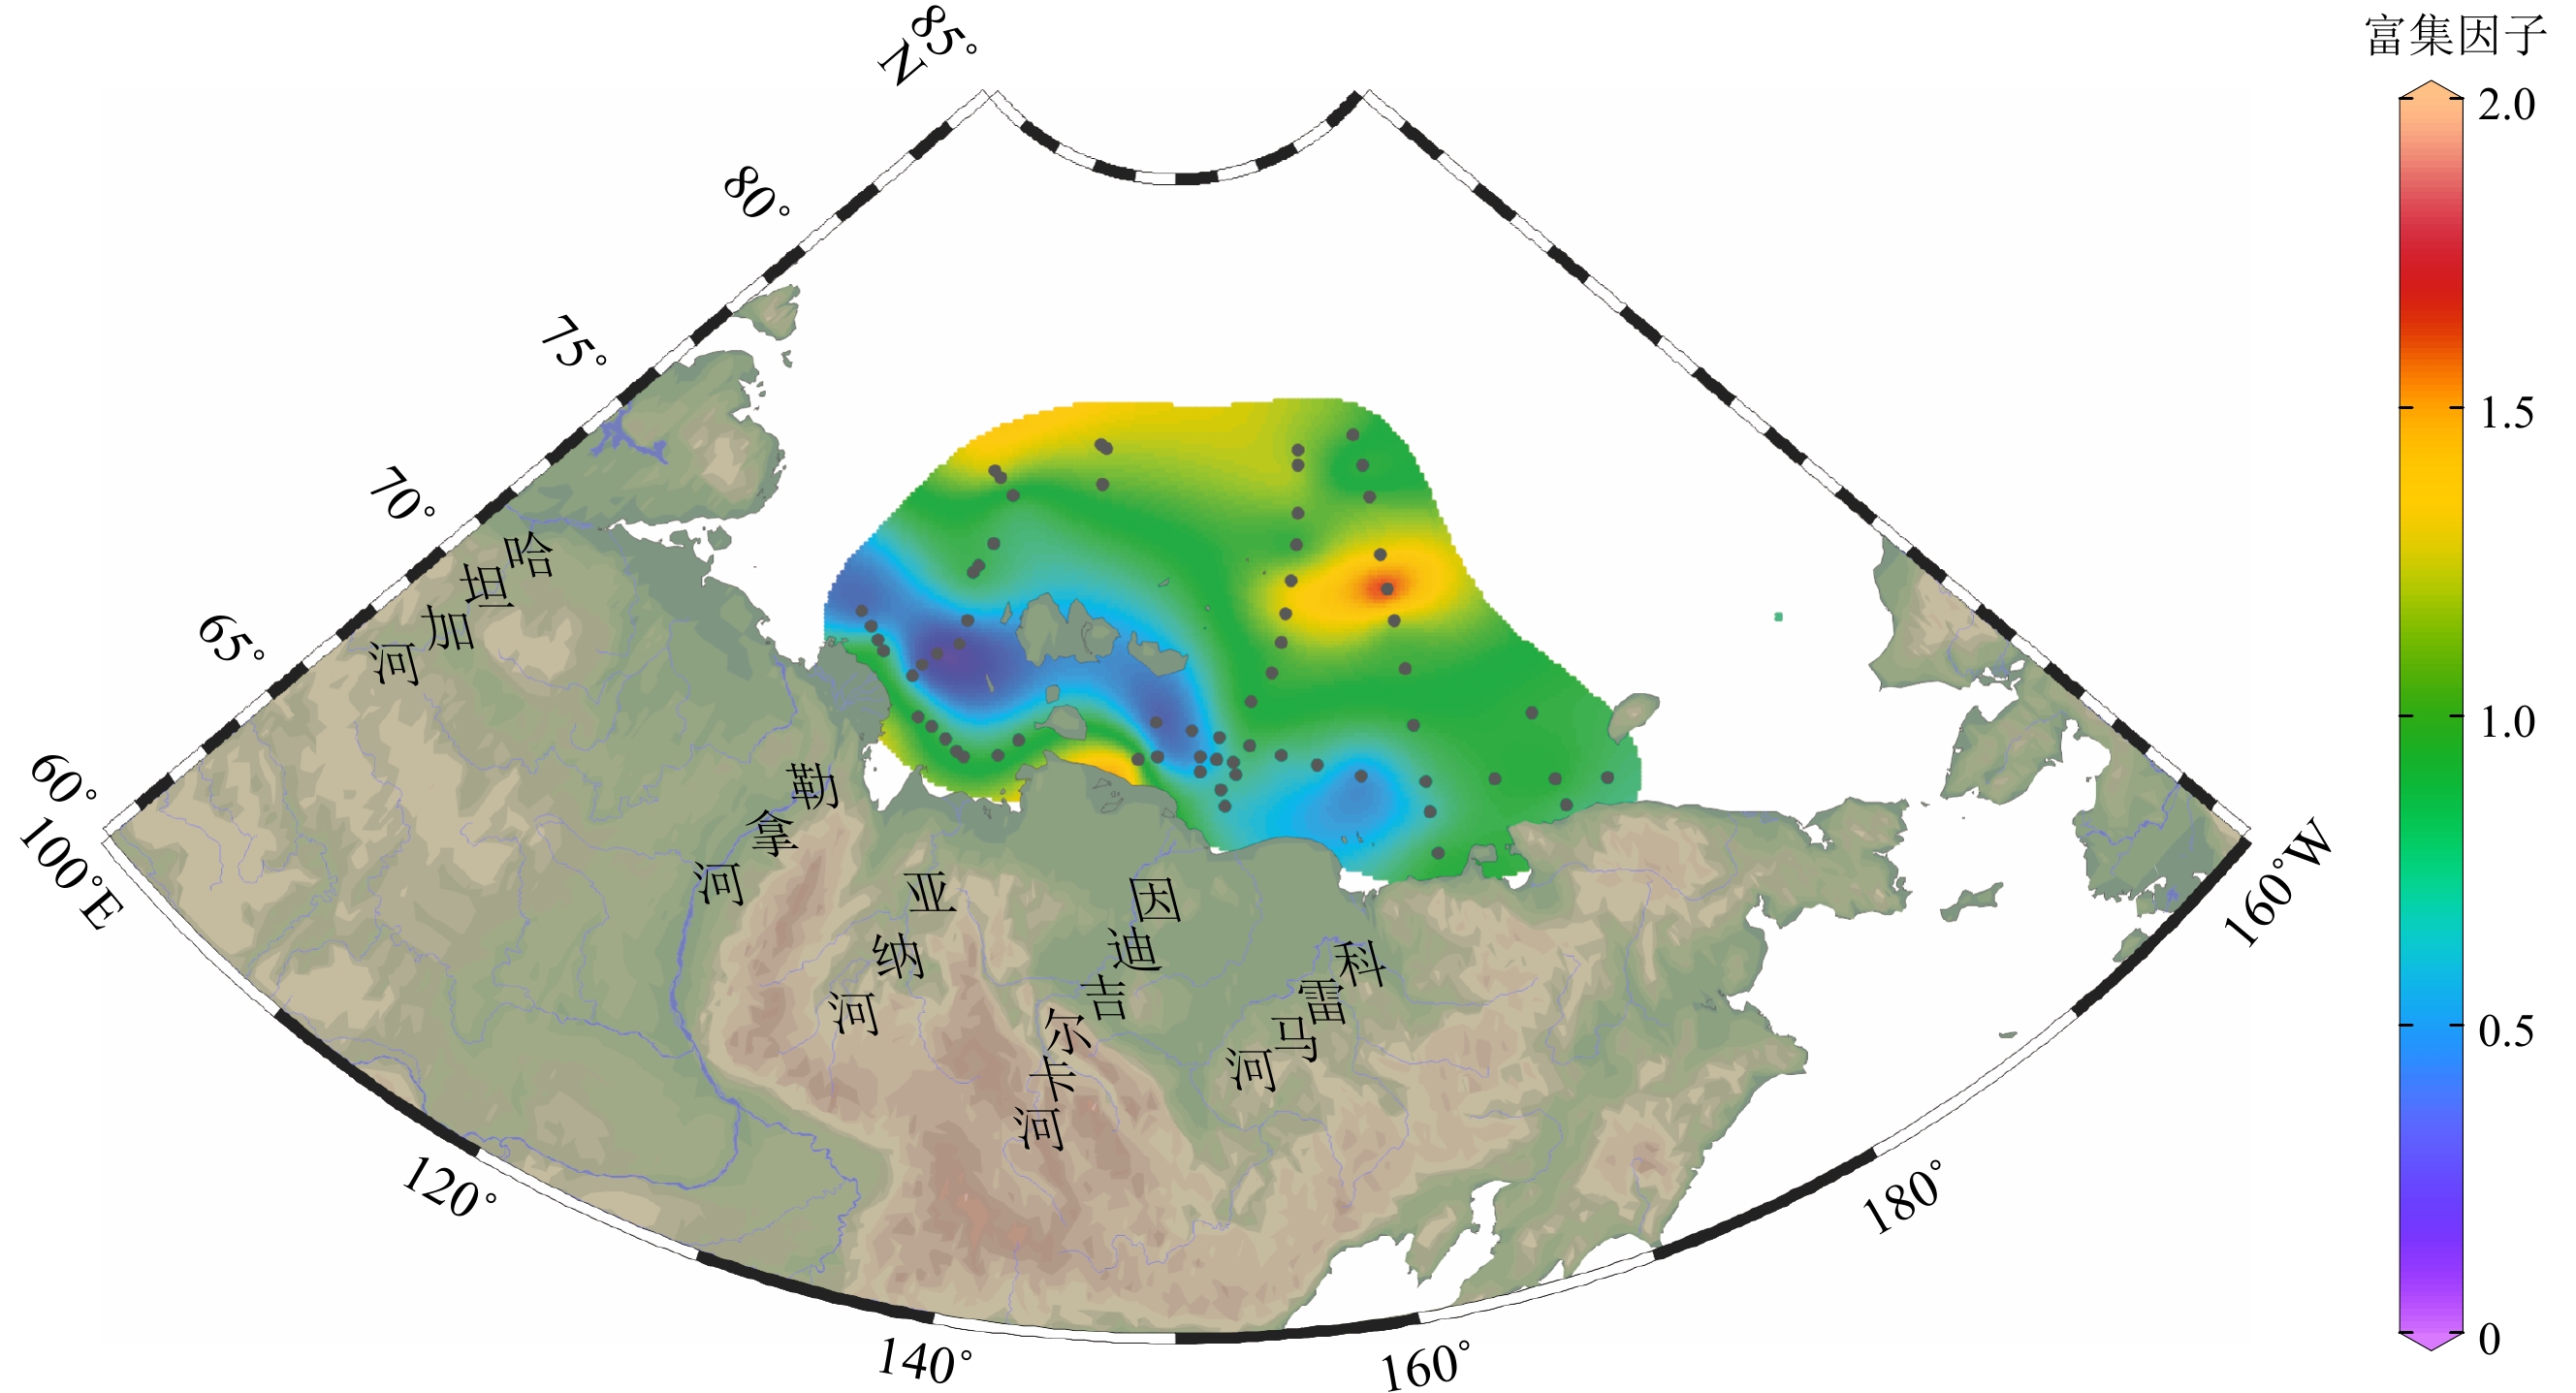
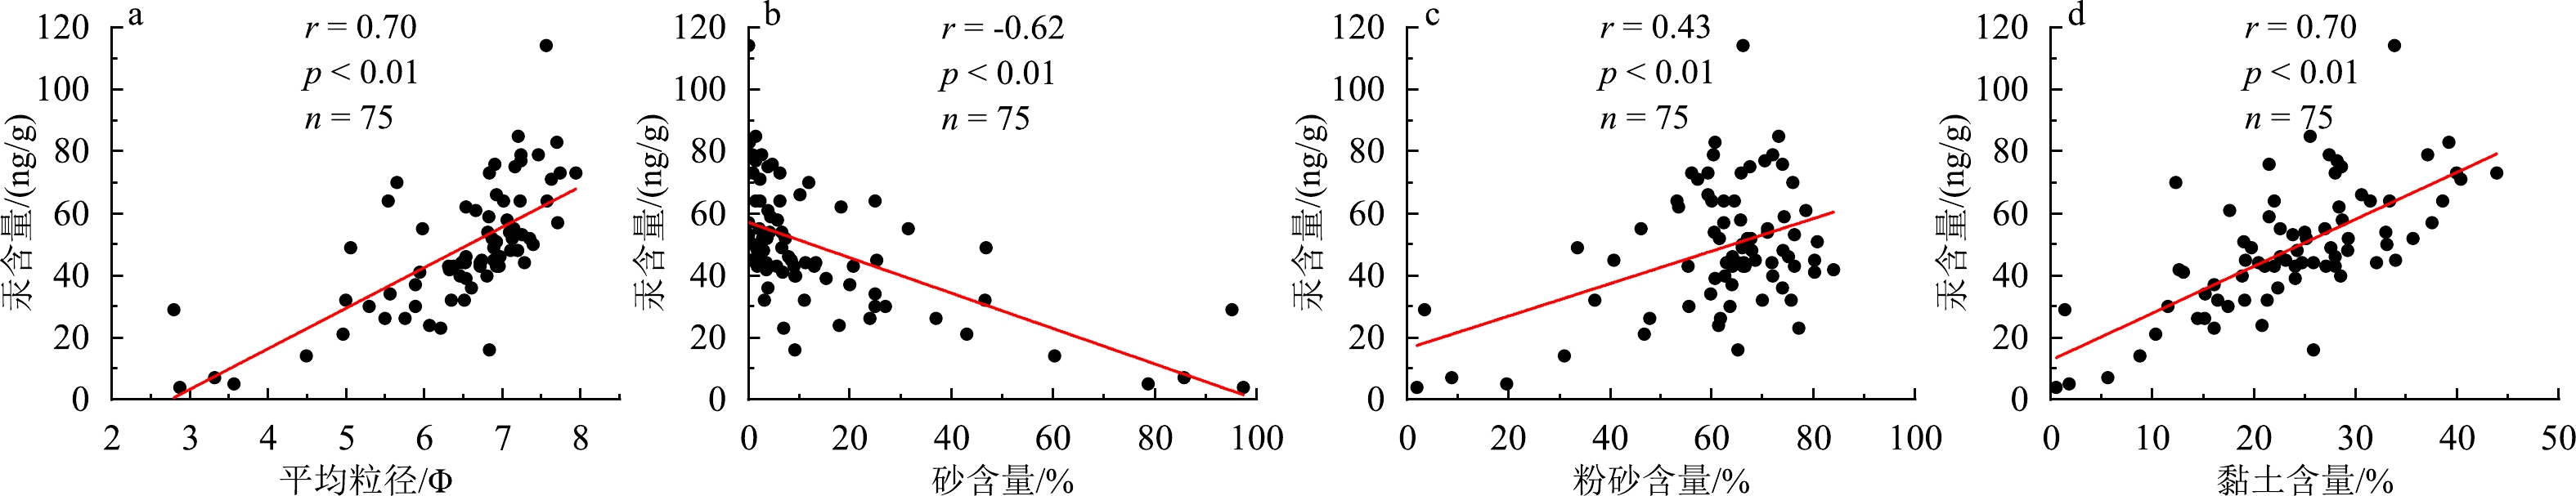
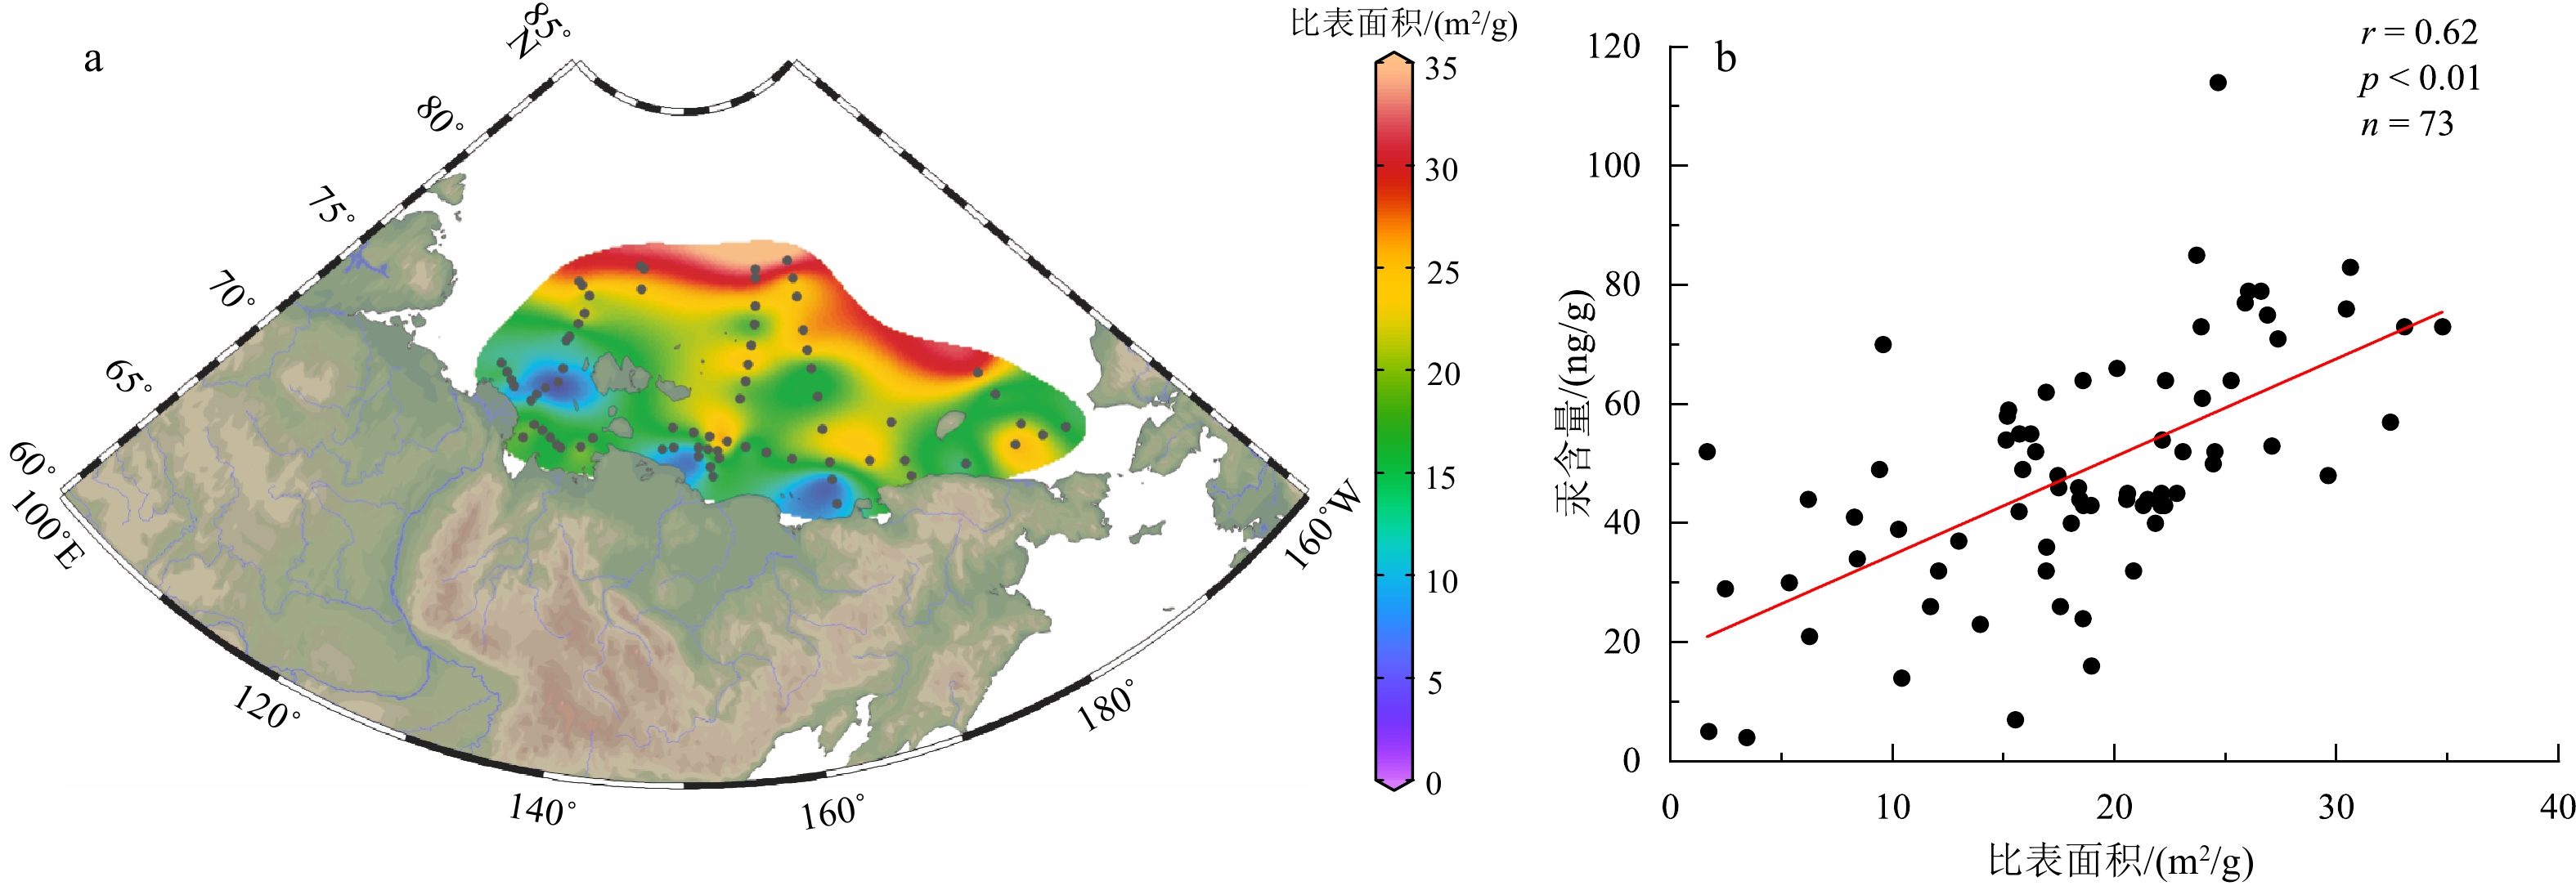
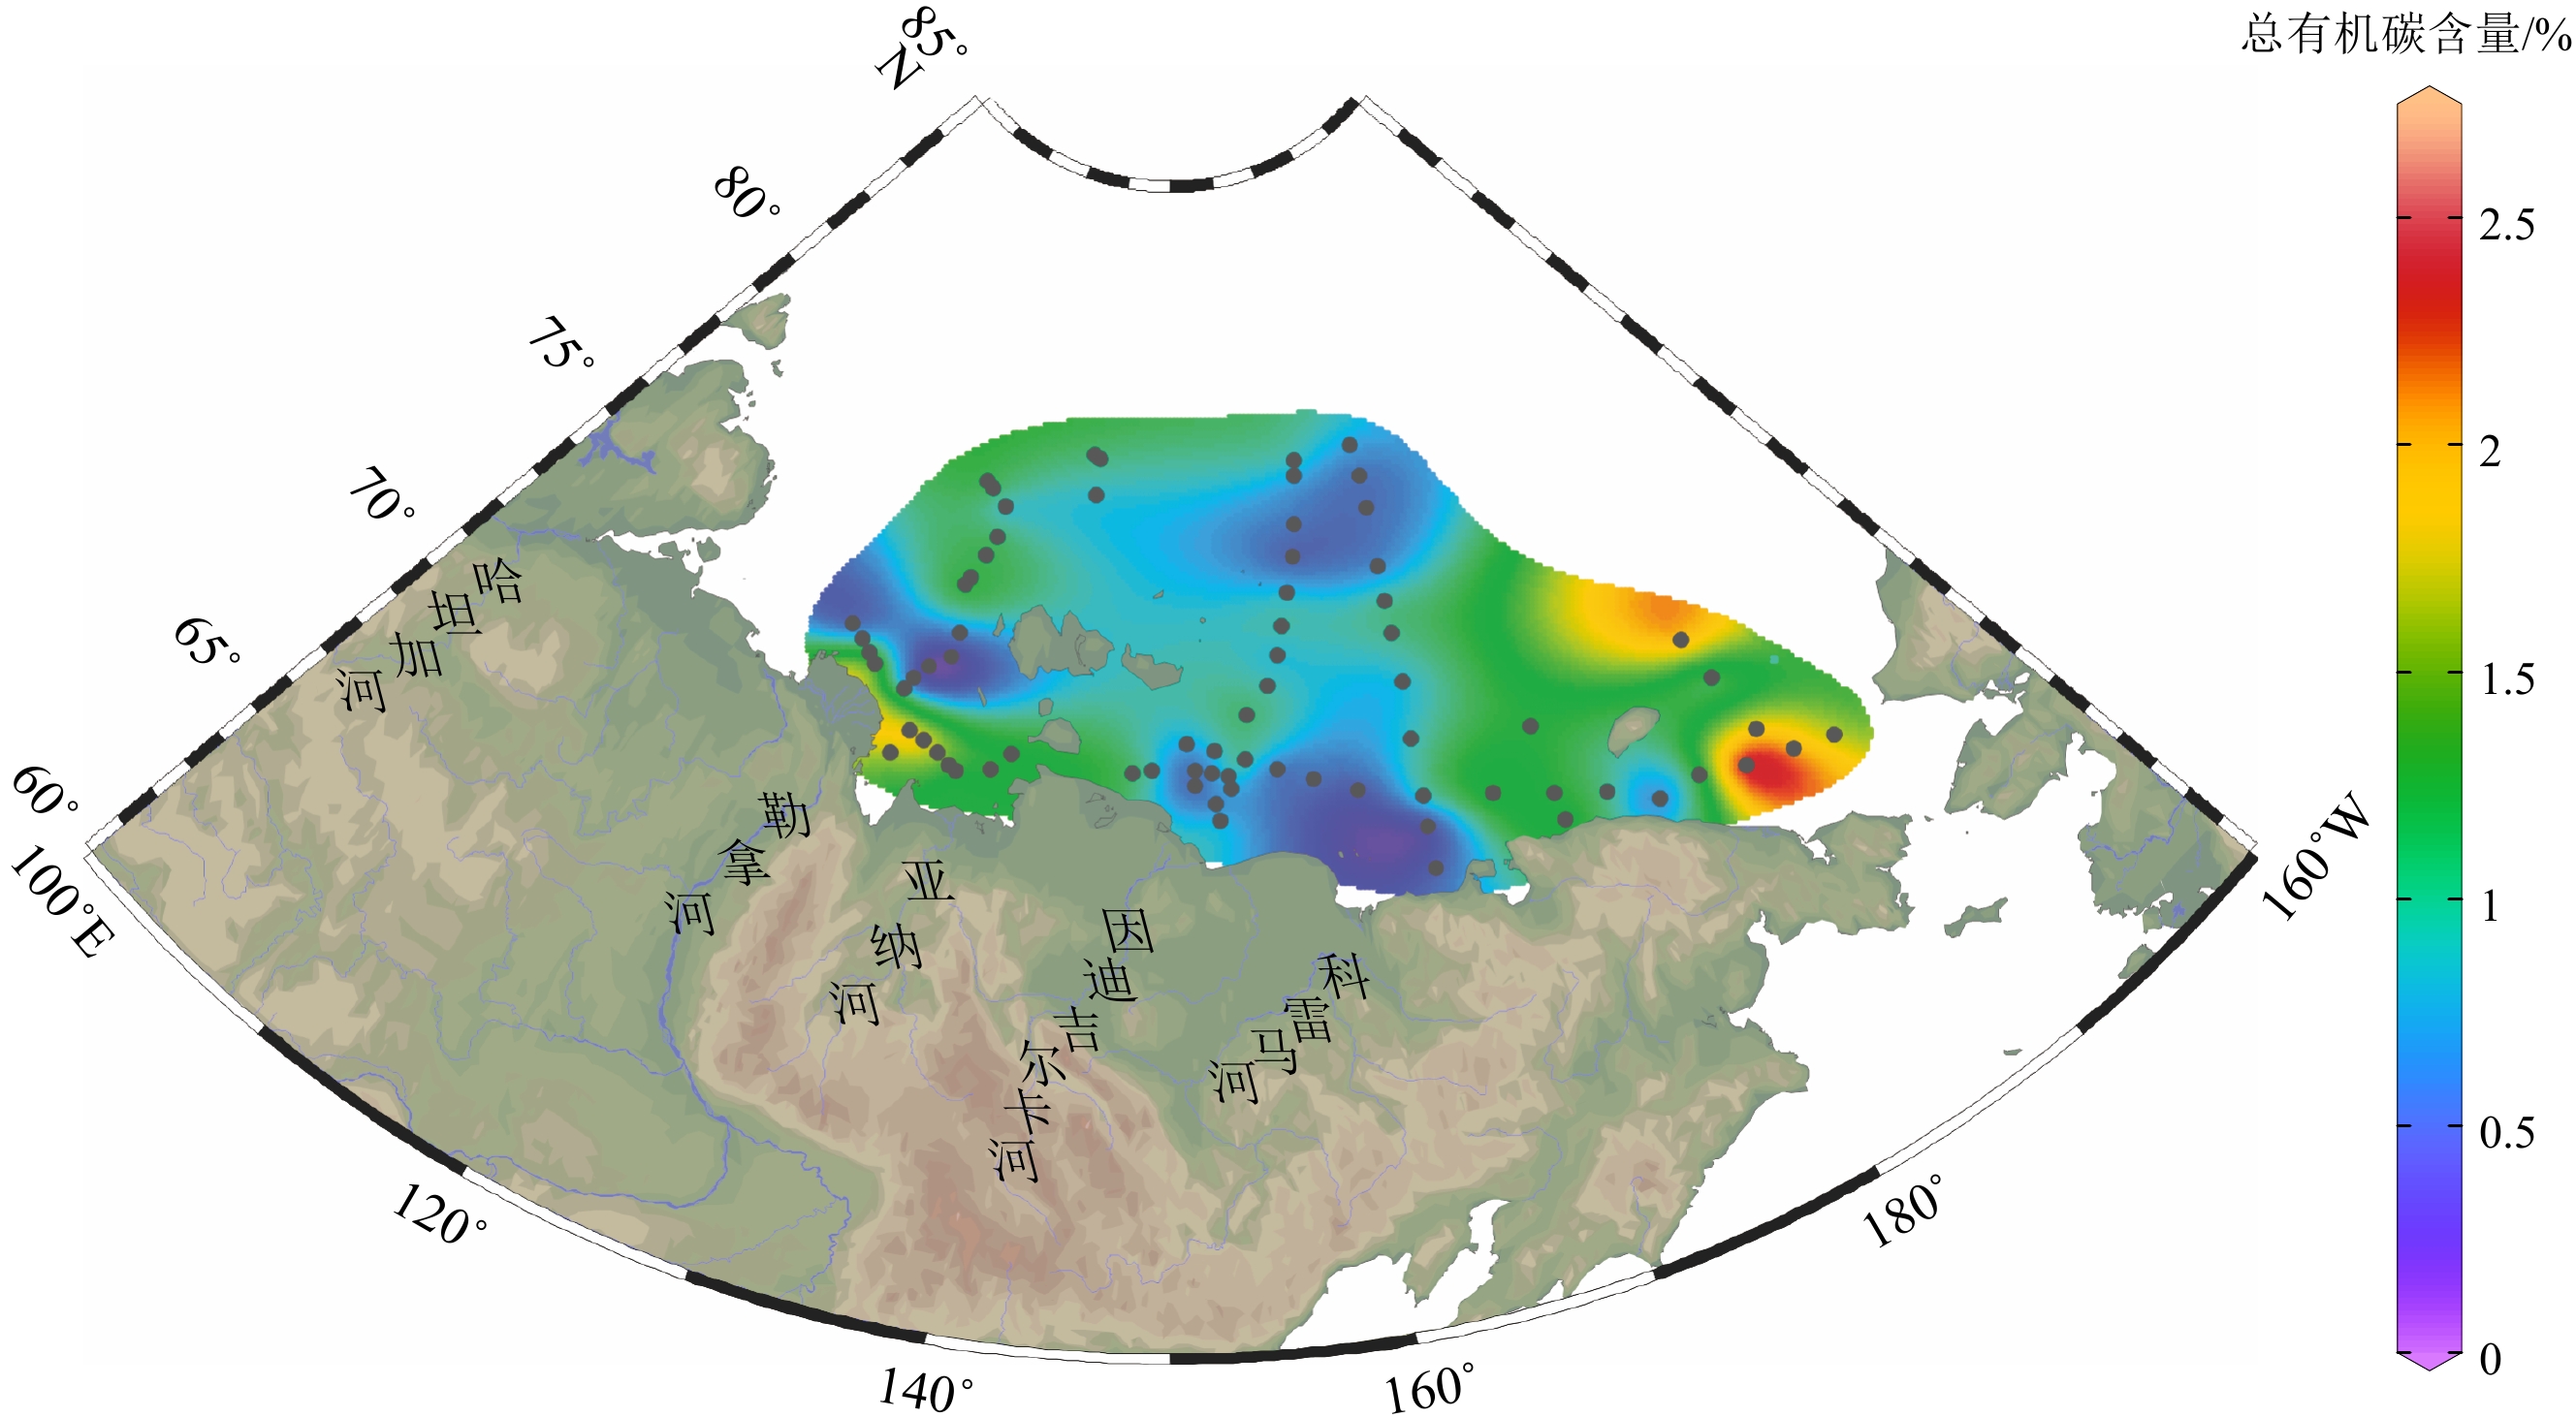
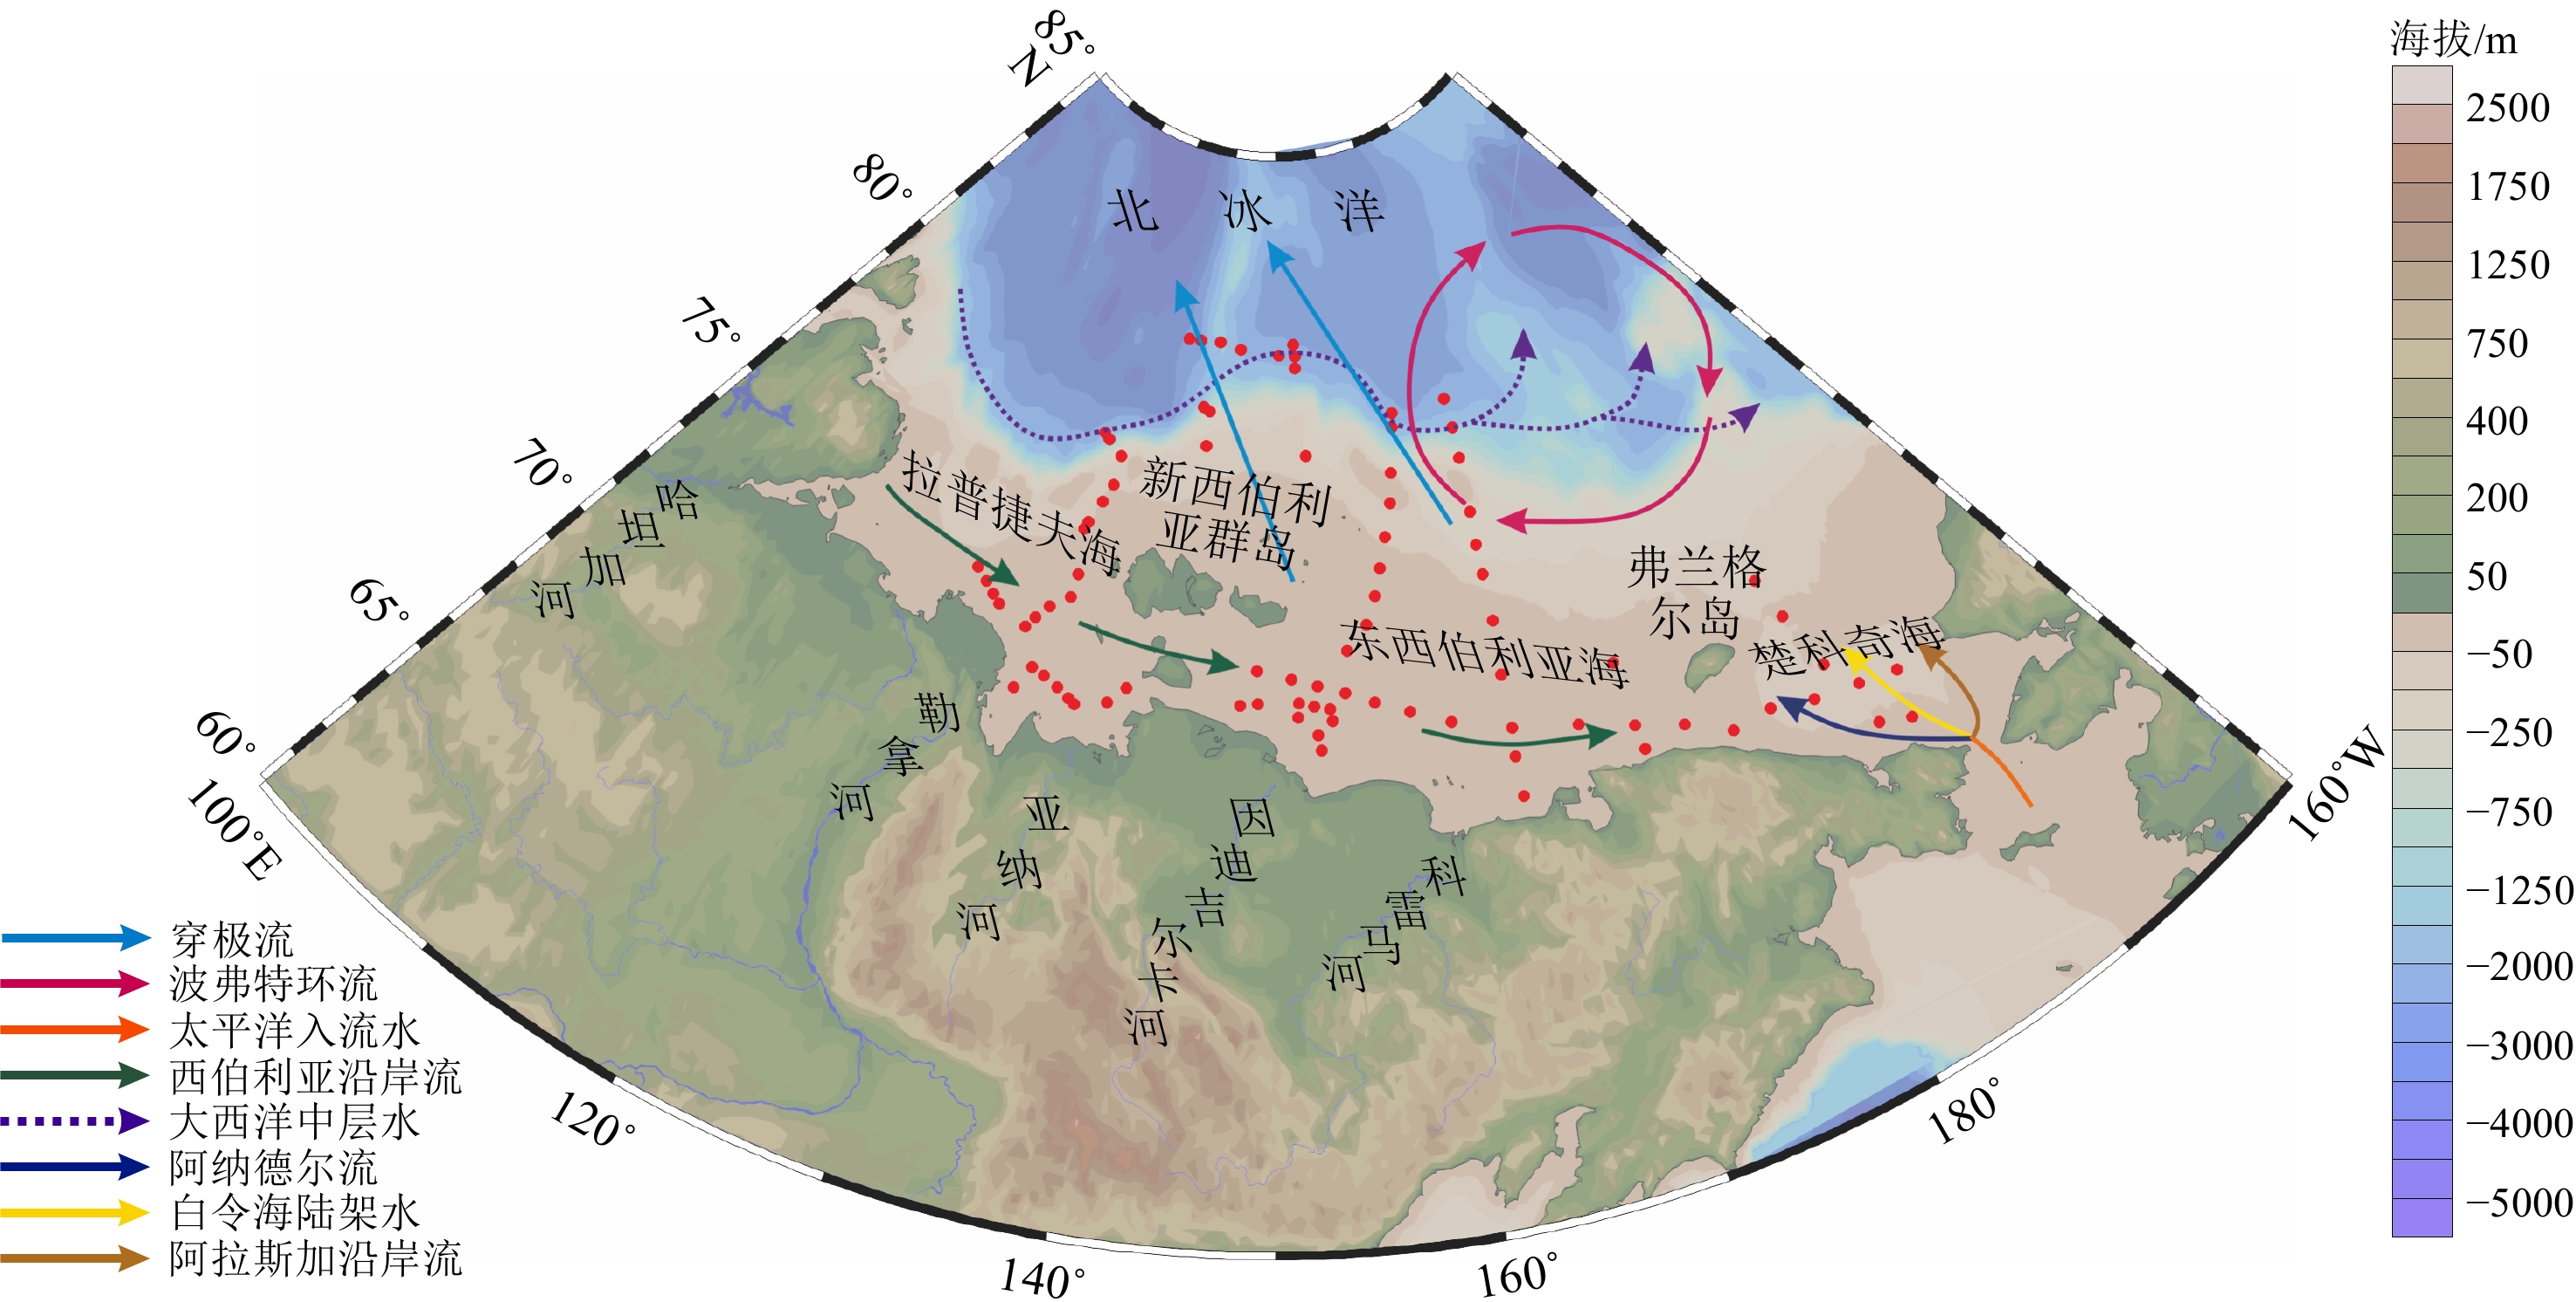
摘要: 全球变暖导致北极地区冻土退化、海冰消融、河流径流增加及海洋动力发生变化,这些因素连同日益增加的人类活动都影响北冰洋中汞的输入和运移。对取自北极东西伯利亚陆架的87个表层沉积物进行了汞含量测试与分析,发现沉积物中汞含量的分布有显著的空间差异性,可分为近岸低汞区(33 ng/g)、陆架中部汞含量中等区(58 ng/g)和北部深水高汞区(84 ng/g)。总体来看,从近岸向外海,汞含量随水深的增大而升高。结合沉积物粒度、有机碳和比表面积等指标,发现东西伯利亚陆架沉积物中黏土含量与汞含量呈现正相关,显示了沉积物粒度对汞分布的控制作用。近岸由于受河流输入、海岸侵蚀和环流分选等因素的影响,沉积物粒径较粗,导致汞含量较低,而北部陆架深水区的细粒沉积物则吸附了更多的汞。在楚科奇海和拉普捷夫海,沉积汞含量和总有机碳含量有较强的正相关性,而在东西伯利亚海相关性较弱,这可能是因为东西伯利亚海的沉积有机碳来源相对更为复杂。基于沉积汞的富集因子指标,我们认为北极东西伯利亚陆架沉积汞的污染水平整体较低,受人类活动的影响相对较弱。Abstract: Global warming is leading to permafrost degradation, sea-ice melt, increased river runoff, and changes in ocean dynamics in the Arctic region. These factors, plus the increasing human activities, affects the input and transport of mercury in the Arctic Ocean. We analyzed the mercury content in 87 surface sediments (0~2 cm) sampled in the East Siberian Arctic Shelf in the Chukchi Sea, East Siberian Sea, and Laptev Sea during three Sino-Russian Arctic joint expeditions in 2016, 2018, and 2020 at water depth of 9~2546 m. Results show a significant spatial variability in mercury concentration, which can be divided into the nearshore low-mercury zones (33 ng/g), the middle shelf medium-mercury zone (58 ng/g), and the northern deep water high-mercury zone (84 ng/g). In general, the mercury concentration tended to increase with water depth increasing from nearshore toward offshore. Analyses of sediment grain size, total organic carbon, and specific surface area of sediments show that the mercury concentration was positively correlated with the clay content in the surface sediments, indicating the controlling role of sediment grain size in the distribution of mercury. The coarse sediments in the nearshore showed lower mercury concentration due to the influence of river input, coastal erosion, and hydrodynamic sorting, while the fine-grained sediments in the northern shelf are prone to absorb more mercury. There was a strong positive correlation between mercury and total organic carbon in the Chukchi and Laptev Seas, while the correlation was weaker in the East Siberian Sea due probably to more-complexed source of total organic carbon. The enrichment factor of mercury manifests that the overall level of contamination of sedimentary mercury is low at present in the East Siberian Arctic Shelf area, showing relatively weak influence of human activities.
-
有孔虫是微小的真核单细胞动物,其大小一般在1 mm以下,属于原生动物门肉足纲中的有孔虫目,其中浮游有孔虫属于抱球虫超科。有孔虫从中侏罗世开始出现,壳壁主要由方解石组成。由于浮游有孔虫壳体在生长发育过程中能够捕获或黏附周围水体的钙质或硅质颗粒,所以其壳体记录了诸多的物理海洋和海洋化学信息,能够用来反演古海洋状态和环境变化[1]。有孔虫的主微量元素含量和同位素组成记录了当时的海洋和气候条件[2-4],常用浮游有孔虫的Mg/Ca和氧同位素值恢复古海水表层温度(SST)[5]。
南海位于太平洋和亚洲大陆之间,受热带西太平洋和大陆气候的共同影响[6]。近年来,南海的古气候演化、快速气候事件、大洋碳储库的长周期变化、深海地层学以及海平面变化等方面的研究都产生了一系列成果[7-9]。然而,南海全新世气候变化的进程还存在很多争议。根据沉积物记录,一些学者认为全新世的SST是持续上升的,也有学者认为全新世的SST多变。如17940站位记录了SST从早全新世开始升高,在5.5 ka出现峰值[10];珠江口盆地远岸斜坡GHE27L站位的沉积物Mg/Ca比恢复的全新世SST持续上升,直到3.9 ka达到峰值(27.7 ℃),随后下降,直到0.6 ka[11];Zhou等[12]认为南海从早全新世SST一直升高,直到6~7 ka才达到峰值,随后的中全新世,SST一直很稳定。Wu等[13]认为南海北部全新世SST变化可分为4个阶段,在8.9 ~8.7 ka达到峰值(27.3 ℃),而且在中晚全新世又出现几次峰值(27.3和27.7 ℃)。不过,也有人认为不同海域所记录的气候变化过程是不同的:Tian等[14]通过分析浮游有孔虫的Mg/Ca和氧同位素,发现南海南部MD052896站位在全新世SST持续升高,平均SST为28.5 ℃;而南海北部ODP1145的SST在全新世略微降低,平均SST为26 ℃[14]。为了解决这些争议,我们于2017年在南海中部珍贝海山底部用蛟龙号载人深潜器精准地采集了柱状样品,并对其中的有孔虫地球化学特征进行分析。
珍贝海山位于南海中部黄岩岛海域,不论在冰期还是间冰期,该区域水体都较深,属于深水区[15],受降水和周围河流的影响较少。样品是由蛟龙号载人深潜器在珍贝海山底部精准采集(图1),无任何扰动和混合,而且海山底部沉积物表面平坦,深水底流弱。因此,浮游有孔虫应该忠实地记录了研究区表层海水的变化。浮游有孔虫的Mg/Ca比记录了海水温度,δ18O配合Mg/Ca比恢复的温度能够反映盐度变化,而δ13C值能够反映生产力的变化。结合AMS14C测年,可以重建该地区自新仙女木事件以来SST和生物生产力的演化过程,为研究南海地区的古海洋学、再造该地区气候演化历史并预测未来气候变化提供依据。
![]() 图 1 南海东部黄岩岛海域采样位置以及本文涉及的其他站位位置Figure 1. The sample location on the Huangyan Island in the eastern part of the South China Sea (SCS) and other stations mentioned in this paper
图 1 南海东部黄岩岛海域采样位置以及本文涉及的其他站位位置Figure 1. The sample location on the Huangyan Island in the eastern part of the South China Sea (SCS) and other stations mentioned in this paper1. 材料与方法
本研究的样品来自黄岩岛海域,位于南海中沙群岛,处于吕宋冷涡(13°~20°N、115°~120°E)范围内[19],是2017年由蛟龙号第136潜次在珍贝海山底部2 500 m水深处取得的柱状样。该柱状样长28 cm,样品采集到甲板后,立即以1 cm间隔分样,共获得29个湿样,然后在4 ℃下保存。
湿样运回实验室后,先自然晾干、称重,然后将样品置于500 mL烧杯中加入浓度为10%的H2O2浸泡48 h。随后将泡好的样品过240目(孔径0.063 mm)的不锈钢筛,除去细粒组分,并将粗粒组分在40 ℃下烘干、称重,最后用100目(孔径0.154 mm)不锈钢筛干筛,第二次分离出粗粒组分。第二次分离的粗粒组分在双目镜下(OLYMPUS SZ61,×120)分别挑出G.ruber和G.sacculifer有孔虫。其中,每一个样品挑选出250~350 μm完整且无填充物的G.ruber (白色)壳体约30枚,质量约2 mg,用于Mg/Ca比值的测定。再挑选出大于154 μm的G.ruber (白色)和G.sacculifer各15~20枚,用于碳氧同位素测试。另外,挑选清洁无损的G.ruber约10 mg,送至美国BETA实验室进行AMS14C测年。测试仪器为250 Kev NEC single stage加速器质谱仪,测试精度为±0.001~0.004。为了获得真实可靠的实验结果,每次测试之前,需要对所挑选的有孔虫样品进行清洗,用以去除样品中可能存在的有机和无机杂质。本文通过CALIB 7.0程序中的Marine13校正曲线对所测得的AMS14C年龄进行校正[20],结果见表1。
表 1 南海蛟龙号第136号潜次pushcore柱状样的AMS14C测年数据和校正年龄Table 1. AMS14C dating data and corrected age of the pushcore columnar sample of Jiaolong 136th dive in the SCS深度/cm 测试材料 AMS14C年龄/aBP 日历年龄/cal. aBP 2σ范围/cal. aBP 3 G.ruber+G.sacculifer 4 105±30 4 150 3 967~4 345 5 G.ruber 5 045±25 5 380 5 279~5 545 12 G.ruber 5 560±25 5 950 5 785~6 117 17 G.ruber 6 260±30 6 705 6 551~6 866 21 G.ruber 8 430±30 9 040 8 853~9 238 28 G.ruber 11 550±40 12 630 12 826~13 194 1.1 Mg/Ca
通过扫描电镜、双目镜的观察,我们的有孔虫样品并无明显的铁-锰-氧化物污染。因此,借鉴前人的清洗方法,采用“Mg清洗”法进行清洗[21]。清洗后样品的Mg/Ca比测试在中国科学院南海所边缘海与大洋重点实验室碳酸盐岩元素地球化学实验室Arian 720ES ICP-OES上完成。分析过程中,先称取180~230 μg清洗过的有孔虫壳体,用2% HNO3溶解,并用外标法标定,选Ca 183.944 nm,Sr 216.596 nm,Mg 279.553 nm作为标定谱线,分别配置[Ca]为19、30、40和49 μL/L,[Mg]为0.05、0.08、0.10和0.13 μL/L,[Sr]为0.3、0.5、0.7和0.9 μL/L的4个标液作为标准溶液用于计算元素的含量,然后再计算Sr/Ca、Mg/Ca比值。除此之外,实验室还配备了两种Sr/Ca、Mg/Ca比值不同的监控溶液,用于检测、校正仪器造成的测试偏差。根据监控溶液的相对偏差,最终测定的Mg/Ca精度达到了0.51%,Sr/Ca达到了0.21% (重复次数n=162)。
1.2 碳氧同位素
有孔虫样品经破碎后,用10%的双氧水浸泡30 min,然后用去离子水超声清洗3次。随后加入浓度>99.7%的无水乙醇,在震荡频率为40 kHz的超声波中清洗30 s左右,吸出浊液,再用去离子水超声清洗2—3次[22]。碳氧同位素测试是在南京大学内生金属矿床成矿机制研究国家重点实验室的连续流质谱仪上完成。测试时称取30~70 μg粉末样放入样品瓶中,然后在70 ℃下经磷酸溶解释放出CO2,输入Delta Plus XP质谱仪中测定δ18O和δ13C值,二者的精度分别高于0.23‰和0.11‰,标样为TTB-1。
2. 结果
2.1 年龄框架
基于6个浮游有孔虫样品AMS14C的测年结果,采用线性插值法建立年代框架,其顶部年龄约为2.3 ka,底部年龄为12.6 ka(图2),平均沉积速率为2.2 cm/ka。其中0~5 cm平均沉积速率为1.6 cm/ka,5~17 cm为9 cm/ka,17 cm以下为1.8 cm/ka。
2.2 Mg/Ca比恢复的SST与G.ruber氧同位素的变化
整个样品柱G.ruber壳体的Mg/Ca为3.3~5.2 mmol/mol,平均值为3.9 mmol/mol,与现代活体有孔虫的Mg/Ca 3.0~6.0 mmol/mol相近[9]。利用Hasting等[23]和Whito等[20]在中国南海建立的G.ruber壳体Mg/Ca比和温度关系式:
$$ {\rm{Mg}}/{\rm{Ca }}\left( {{\rm{mmol}}/{\rm{mol}}} \right) = 0.38{{\rm{e}}^{[0.089 \times {\rm{SST}}{(^ \circ }{\rm{C}})]}} $$ (1) 可恢复研究区的SST变化范围为24.4~29.3 ℃,平均SST为26.2 ℃。由于SST在全新世存在接近4 ℃的温差变化,为了验证所恢复的SST真实可靠,通过查找WOD数据库(World Ocean Databases:www.nodc.noaa.gov),获得研究区1923—2007年的表层海水温度实测数据。经处理分析发现,该地区近几十年来表层海水温度波动范围较大,存在温差达到4 ℃的情况,并且在1980—2007年间,表层海水的温度波动也高达2.5 ℃,因此,认为全新世以来研究区可能存在4 ℃的温差变化(图3f)。
![]() 图 3 南海黄岩岛海域有孔虫壳体碳氧同位素组成、Mg/Ca-SST记录及与其他地区氧同位素记录的对比a. 格陵兰岛冰芯δ18OSMOW[28];b. 中国华南董哥洞石笋δ18O[29];c. 黄岩岛海域G.ruber的δ18O;d. 黄岩岛海域G.ruber的Mg/Ca比恢复的SST;e. 黄岩岛海域浮游有孔虫G.ruber与G.sacculifer的δ13C(灰线为G.sacculifer,紫线为G.ruber);f. 黄岩岛海域1923~2007年实测SST。Figure 3. Carbon and oxygen isotopes and Mg/Ca-SST records of foraminifera shell in the Huangyan Island in SCS and their correlation.a. Greenland ice core δ18OSMOW values[28]; b. δ18O values of Dong Ge stalagmite in the South China[29]; c. δ18O values of G.ruber in Huangyan Island;d. Mg/Ca –derived SST curve of the Huangyan Island; e. δ13C values of G.ruber and G.sacculifer in Huangyan Island(Gray line is G.sacculifer, purple line is G.ruber); f. Measured SST in Huangyan Island from 1923 to 2007.
图 3 南海黄岩岛海域有孔虫壳体碳氧同位素组成、Mg/Ca-SST记录及与其他地区氧同位素记录的对比a. 格陵兰岛冰芯δ18OSMOW[28];b. 中国华南董哥洞石笋δ18O[29];c. 黄岩岛海域G.ruber的δ18O;d. 黄岩岛海域G.ruber的Mg/Ca比恢复的SST;e. 黄岩岛海域浮游有孔虫G.ruber与G.sacculifer的δ13C(灰线为G.sacculifer,紫线为G.ruber);f. 黄岩岛海域1923~2007年实测SST。Figure 3. Carbon and oxygen isotopes and Mg/Ca-SST records of foraminifera shell in the Huangyan Island in SCS and their correlation.a. Greenland ice core δ18OSMOW values[28]; b. δ18O values of Dong Ge stalagmite in the South China[29]; c. δ18O values of G.ruber in Huangyan Island;d. Mg/Ca –derived SST curve of the Huangyan Island; e. δ13C values of G.ruber and G.sacculifer in Huangyan Island(Gray line is G.sacculifer, purple line is G.ruber); f. Measured SST in Huangyan Island from 1923 to 2007.研究区浮游有孔虫G.ruber的Mg/Ca比恢复的SST变化可分为12.6~11.8、11.8~9.1、9.1~6.3、6.3~2.3 ka四个时间段,其中12.6~11.8 ka,SST降低了约2.3 ℃;11.8~9.1 ka,SST略有波动,在11.3~10.7和9.7~9.1 ka时段内,SST有两次下降过程,但变化范围较小(<0.5 ℃);9.1~6.3 ka,SST自24.5 ℃迅速升至29.3 ℃,平均SST为27.3 ℃,6.7 ka出现低SST,最低可达25.3 ℃,随后的6.5 ka达到全新世最高温度29.3 ℃;6.3~2.3 ka SST整体呈降低趋势,局部有波动,在6.3~5.3 ka,SST自27.7 ℃降至24.8 ℃;5.3~2.3 ka总体温度为上升趋势,但是在3 ka存在25.3 ℃的低温(图3d)。δ18O在11.8 ka发生第一次降低,并保持相对低值直到5.8 ka,第二次快速降低发生在5.3 ka,持续了约1.8 ka之后开始上升(图3c)。
2.3 碳同位素记录
浮游有孔虫G.ruber和G.sacculifer的碳同位素值变化趋势一致:G.ruber的δ13C值为1.42‰~2.40‰,平均为2.05‰,G.sacculifer的δ13C值为1.42‰~2.58‰,平均为2.10‰。总体上G.sacculifer的δ13C值高于G.ruber,但是出现了几次异常值,导致G.ruber的δ13C值偏高(图3e)。值得注意的是最顶端样品中G.ruber和G.sacculifer的δ13C值最低。
3. 讨论
3.1 原始地球化学记录的保存
浮游有孔虫化石属于钙质超微化石,而大洋沉积物中钙质化石的保存直接受到碳酸盐补偿深度(CCD)的影响[24]。南海的CCD通常为3 500 m[25],采样地点水深约为2 500 m,而且样品中的G.ruber和G.sacculifer未见明显的溶蚀(图4),表明样品的原始地球化学记录保存较好。
![]() 图 4 浮游有孔虫扫描电镜a. G.ruber;b. G.sacculifer。Figure 4. SEM photos of the planktonic foraminiferaa. G.ruber; b. G.sacculifer.
图 4 浮游有孔虫扫描电镜a. G.ruber;b. G.sacculifer。Figure 4. SEM photos of the planktonic foraminiferaa. G.ruber; b. G.sacculifer.3.2 SST变化
有孔虫壳体在形成过程中会受到周围海水的影响,导致其Mg/Ca比发生变化[26],由于碳酸盐晶格中Mg2+交代Ca2+是吸热过程,因此,温度的升高会促使有孔虫壳体的Mg含量增加,Mg/Ca比也会随之增高[27]。自12.6 ka以来,研究区的SST变化可识别出12.6~11.8、11.8~9.1、9.1~6.3、6.3~2.3 ka 4个温度明显变化的时段(图5d),而且这些温度变化在时间上可与南海南部MD01-2390站位和南海北部17940站位的SST进行很好地对比(图5)[30-31]:3个站位的SST都在12.6~11.8 ka之间大幅降低,11.8~9.1 ka略有升高,9.1~6.3 ka达到全新世最大值并稳定波动,6.3~2.3 ka呈波动下降,整体变化趋势具有很好的一致性。然而,3个站位SST变化的具体时间和幅度仍存在较大差异。如MD01-2390和17940站位清晰地记录了全新世早期11.3和9.7 ka两次短暂的降温事件,尽管黄岩岛海域的Mg/Ca比也记录了这次降温事件,但是其降温幅度并不明显(图5d)。另外,5.3~4.1 ka三个站位均记录了SST升高,但17940站位的SST变化幅度较小。3.5~2.3 ka,黄岩岛海域有孔虫所记录的SST先降低再上升,MD01-2390站位记录了稳定上升的趋势,而17940站位则记录了波动下降的趋势(图5)。
![]() 图 5 12.6 ka以来南海附近海域古气候变化曲线对比a. 董哥洞石笋δ18O记录[29];b. 南海北部17940站位根据浮游有孔虫PF-12E计算的SST变化曲线[31];c. 南海南部MD01-2390站位根据G.ruber的Mg/Ca比恢复的SST变化曲线[30];d. 根据珍贝海山底部G.ruber的Mg/Ca比恢复的SST变化曲线;e. 厄瓜多尔南部的ENSO记录[32]。Figure 5. Correlation of paleoclimatic patterns from different regions since 12.6 kaa. The δ18O records of Dong Ge stalagmite[29]; b. The Mg/Ca-derived SST curve of PF-12E at 17940 station in the northern SCS[31]; c. The Mg/Ca-derived SST curve at MD01-2390 station in the southern SCS[30]; d. The Mg/Ca-derived curve at the bottom of Zhenbei seamount; e. ENSO records in southern Ecuador[32].
图 5 12.6 ka以来南海附近海域古气候变化曲线对比a. 董哥洞石笋δ18O记录[29];b. 南海北部17940站位根据浮游有孔虫PF-12E计算的SST变化曲线[31];c. 南海南部MD01-2390站位根据G.ruber的Mg/Ca比恢复的SST变化曲线[30];d. 根据珍贝海山底部G.ruber的Mg/Ca比恢复的SST变化曲线;e. 厄瓜多尔南部的ENSO记录[32]。Figure 5. Correlation of paleoclimatic patterns from different regions since 12.6 kaa. The δ18O records of Dong Ge stalagmite[29]; b. The Mg/Ca-derived SST curve of PF-12E at 17940 station in the northern SCS[31]; c. The Mg/Ca-derived SST curve at MD01-2390 station in the southern SCS[30]; d. The Mg/Ca-derived curve at the bottom of Zhenbei seamount; e. ENSO records in southern Ecuador[32].浮游有孔虫Mg/Ca所记录的SST变化不仅在南海的南北海域之间可以进行对比,还可以与东亚夏季风所控制的董哥洞石笋δ18O记录进行对比[25]:12.6~11.8 ka,南海3个站位的SST均降低,对应着董哥洞石笋δ18O值的升高;11.8~6.3 ka,3个站位的SST均升高,与此同时,董哥洞石笋的δ18O值降低且稳定在−8‰以下;6.3~2.3 ka,SST整体呈下降趋势,同时董哥洞石笋δ18O值升高(图5a)。
此外,厄瓜多尔南部的ENSO记录表明,自11.8 ka以来,ENSO事件发生的频数逐渐增加,6.3 ka之后,ENSO事件发生频数最多[32]。黄岩岛海域与南部MD01-2390站位的浮游有孔虫记录了该时期SST变化幅度比较高(图5),但南海北部SST变化幅度不大(图5b),这说明ENSO事件可能对南海南部的影响较大,而对南海北部的影响较小。
3.3 气候变化的驱动机制
南海属于边缘海,位于典型的东亚季风区,其洋流有夏季风驱动的顺时针反气旋环流和冬季风驱动的逆时针气旋式环流[33],季节性的季风场形成了独特的表层洋流格局(图1)。此外南海的区域地质构造复杂,在地质历史时期,随着海平面的升降,海陆格局的分布及其与大洋之间海水的交换通道都曾发生巨大变化[34-35]。因此,南海的气候变化受多种机制的控制。
研究区浮游有孔虫壳体Mg/Ca比记录了自12.6 ka以来南海经历了几次快速降温事件,包括12.6~11.8 ka的新仙女木事件和全新世东亚夏季风突变事件。这些突变事件可与来自北大西洋深海沉积物记录的千年周期降温事件相对应[36-37]。因此,这些降温事件指示了东亚夏季风的演化可能受到北大西洋冰筏事件的制约[38-39]。在过去12.6 ka内,南海的海平面上升了将近60 m,尤其自11.8 ka开始,海平面快速上升,至6.3 ka达到最高海平面,之后又略有降低(图6g)[34-35]。海平面的升降可能会影响底流活动,从而影响海洋物质的搬运能力以及沉积速率[40-41]。前人研究认为,南海底流来源于东部台湾-吕宋岛弧之间的巴士海峡,经西沙群岛向东部的中央海盆传递[42],甚至能够穿越西沙海槽,到达南海西南部(图1)[43]。但是,到目前为止,均未有研究指出研究区存在底流活动,说明海平面的变化不是研究区气候变化的驱动机制。
![]() 图 6 南海黄岩岛海域有孔虫和其他地区古环境指标变化曲线对比a. 格陵兰岛冰芯δ18OSMOW[28];b. 中国华南董哥洞石笋δ18O[29];c. 黄岩岛海域浮游有孔虫G.sacculifer和G.ruber之间的碳同位素分馏值Δ13CG.sacculifer-G.ruber的变化曲线;d. 黄岩岛地区据G.ruber的Mg/Ca比恢复的SST变化曲线;e. 黄岩岛地区G.ruber的δ18O值;f. 20°N夏季平均日照变化曲线[12];g. 海平面变化曲线[34-35];h. 厄瓜多尔南部的ENSO记录[32]。Figure 6. The comparison of palaeoenvironmental proxies between the Huangyan Island of SCS and other locationsa. Greenland ice core δ18OSMOW values[28]; b. δ18O values of Dong Ge stalagmite in the South China[29]; c. The carbon isotope fractionations(Δ13C G.sacculifer-G.ruber) between G.sacculifer and G.ruber in the Huangyan Island; d. Mg/Ca –derived SST curve of the Huangyan Island; e. δ18O values of G.ruber in Huangyan Island; f. 20°N mean sunshine curve in summer[13]; g. Sea level change curve[34-35]; h. ENSO records in southern Ecuador[32].
图 6 南海黄岩岛海域有孔虫和其他地区古环境指标变化曲线对比a. 格陵兰岛冰芯δ18OSMOW[28];b. 中国华南董哥洞石笋δ18O[29];c. 黄岩岛海域浮游有孔虫G.sacculifer和G.ruber之间的碳同位素分馏值Δ13CG.sacculifer-G.ruber的变化曲线;d. 黄岩岛地区据G.ruber的Mg/Ca比恢复的SST变化曲线;e. 黄岩岛地区G.ruber的δ18O值;f. 20°N夏季平均日照变化曲线[12];g. 海平面变化曲线[34-35];h. 厄瓜多尔南部的ENSO记录[32]。Figure 6. The comparison of palaeoenvironmental proxies between the Huangyan Island of SCS and other locationsa. Greenland ice core δ18OSMOW values[28]; b. δ18O values of Dong Ge stalagmite in the South China[29]; c. The carbon isotope fractionations(Δ13C G.sacculifer-G.ruber) between G.sacculifer and G.ruber in the Huangyan Island; d. Mg/Ca –derived SST curve of the Huangyan Island; e. δ18O values of G.ruber in Huangyan Island; f. 20°N mean sunshine curve in summer[13]; g. Sea level change curve[34-35]; h. ENSO records in southern Ecuador[32].珍贝海山底部G.ruber记录的SST与中国华南董哥洞石笋氧同位素记录进行对比(图6)[29],结果表明12.6~11.8 ka SST较低,石笋氧同位素组成较重,指示了气候寒冷干燥;11.8~6.3 ka石笋氧同位素组成显现出波动降低的变化,气候开始变得湿润[44-45],尤其是自11.3 ka开始,SST为上升趋势,石笋氧同位素组成为稳定低值,且浮游有孔虫δ18O值也显示为稳定低值(图6e),为较稳定的暖湿气候,指示了东亚夏季风增强,中国华南地区和南海可能进入了全新世适宜期[46-47],而且此时其他地区仍处于干燥寒冷的气候[48];在6.3 ka之后,SST波动降低,石笋的氧同位素记录有增大的趋势,气候向寒冷干燥转变。一些研究者认为,轨道尺度上东亚夏季风变化主要受北半球太阳辐射的驱动[49-50]。Zhou等[12]认为20°N夏季光照强度从13 ka开始增强,在9 ka达到最大值,之后开始降低;Berger和Loutre[51]及Selvaraj等[52]认为25°N夏季光照强度在10 ka具有异常高值。研究区有孔虫的δ18O记录表明:夏季风的最大强度出现在6.5 ka,比9 ka的光照强度最大值滞后了将近2 500年,这证明了季风变化可能滞后于光照强度约1 500~3 000年[53]。
研究区浮游有孔虫所记录的这种气候变化,可能与末次冰期热带辐合带(ITCZ)移动有关。在亚轨道尺度上,北半球夏季太阳辐射的变化会影响ITCZ位置的纬向移动与ENSO的活动频率,进而制约着东亚夏季风强度的变化[54-55]。ITCZ的纬向移动,会导致北半球低纬地区夏季降水发生变化,体现在沉积物的氧同位素组成上[56]。早—中全新世,北半球夏季太阳辐射强,强迫ITCZ向北移动,研究区夏季降水增加,浮游有孔虫的δ18O值降低[54];晚全新世,北半球夏季太阳辐射减弱,导致ITCZ向南移动,研究区夏季降水减少,浮游有孔虫的δ18O值增大(图6)[29]。此外,Haug等[54]和Clement等[55]认为中—晚全新世,由于热带大气对流与南方振荡的相互作用增强,使得ITCZ的南移与ENSO活动频率的增强有着密切的关系。Moy等[32]认为ENSO活动频率变化是东南亚地区气候年际变化的主要驱动力,ENSO活动频率的增加会导致东亚夏季风的减弱,反之则相反。前人研究表明自中全新世开始ENSO活动频率逐渐增加(图6h)[55]。ENSO活动频率较强的时期,大量温暖的海水会流入热带东太平洋,导致热带西太平洋海表温度降低,使热带西太平洋向亚洲大陆季风区输送的水汽减少,最终导致东亚夏季风减弱[57-58]。因此,全新世北半球太阳辐射强度、ITCZ平均位置的纬向移动和ENSO活动频率的变化可能是引起研究区全新世气候变化的主要原因[59]。12.6~11.8 ka,为新仙女木时期,ITCZ平均位置向南移动,导致降水减少,浮游有孔虫的δ18O值较大[54];11.8~6.3 ka为早—中全新世,北半球夏季太阳辐射强,导致ITCZ向北移动,东亚夏季风增强,降水增加,有孔虫δ18O值减小[59];6.3~2.3 ka,太阳辐射变弱,导致ITCZ向南移动,同时ENSO活动频率增强,进一步加强了ITCZ的南移[60],东亚夏季风的强度也随之发生了减弱,降水减少,浮游有孔虫的δ18O值增大。
此外,发现南海黄岩岛海域浮游有孔虫G.sacculifer和G.ruber的碳同位素分馏值Δ13CG.s-G.r出现几次负偏移,这些负偏移在时间上与全新世东亚夏季风突变事件具有一定的对应关系(图6),SST降低时,Δ13CG.sacculifer-G.ruber呈负偏;而在SST升高时,Δ13CG.sacculifer-G.ruber呈正偏。推测全新世Δ13CG.s-G.r可能受SST变化的影响,但能否作为全新世东亚夏季风突变事件的一个新的指标及其具体的控制机制还有待进一步研究探讨。
4. 结论
对南海珍贝海山底部的沉积物样品进行了Mg/Ca比及碳氧同位素组成测试分析,发现研究区沉积物完整地记录了自12.6 ka以来的气候变化,在时间范围上,能够与新仙女木事件以及全新世东亚夏季风突变事件相对应,可能与北大西洋冰筏事件有关。通过分析认为研究区的气候变化可能主要受到北半球夏季太阳辐射变化控制的ITCZ的纬向移动和ENSO活动强度的控制。此外,发现研究区全新世期间浮游有孔虫G.sacculifer和G.ruber的碳同位素分馏值Δ13CG.sacculifer-G.ruber与SST变化有关,但能否作为全新世东亚夏季风突变事件的一个新的指标及其具体的控制机制还需进一步的研究探讨。
致谢:感谢中国大洋38航次第二航段的首席科学家石学法研究员及所有参加人员在样品采集和保存上的指导和帮助,感谢中国科学院边缘海与大洋重点实验室碳酸盐岩元素地球化学实验室陈天然老师协助有孔虫Mg/Ca比值测试分析。
-
![]()
![]()
图 2 北极东西伯利亚陆架表层沉积汞的分布特征
Figure 2. Spatial distribution of mercury in the surface sediments of the East Siberian Arctic Shelf
![]()
图 3 北极东西伯利亚陆架表层沉积物汞的富集因子分布特征
Figure 3. Distribution of enrichment factor of mercury in the surface sediments of the East Siberian Arctic Shelf
![]()
![]()
![]()
![]()
![]()
图 8 北极东西伯利亚陆架(a)、拉普捷夫海(b)、东西伯利亚海(c)和楚科奇海(d)沉积汞含量与总有机碳的相关性
Figure 8. Relationship of sedimentary mercury concentration and total organic carbon in the surface sediments of the East Siberian Arctic Shelf (a), Laptev Sea (b), East Siberian Sea (c), and Chukchi Sea (d)
Total organic carbon data are cited from references [48-49].
![]()
图 9 不同海域表层沉积物汞富集因子平均值对比
东海和黄海(N = 152)[76-77],鄂霍次克海(N = 26)[23,78],西北冰洋(N = 7)[23],东西伯利亚海(N = 41,本文),拉普捷夫海(N = 23,本文),N代表样品数目,圆点表示富集因子的平均值,实线表示样品的标准偏差。
Figure 9. Comparison of mean enrichment factor of the sedimentary mercury in surface sediments from different regions
The Yellow Sea and the East China Sea: N = 152 [76-77]; the Okhotsk Sea: N = 26 [23,78]; the western Arctic Ocean: N = 7 [23]. The East Siberian Sea: N = 41 (this study). The Laptev Sea: N = 23 (this study). N: the number of samples; the middle dot represents the mean enrichment factor and the vertical solid line represents the standard deviation of the samples.
河流 流域面积
/(103 km2)径流量
/(km3/a)输沙量
/(106 t/a)汞通量
/(kg/a)鄂毕河 2990 402.0 15.5 2421 叶尼塞河 2540 580.0 4.7 3642 哈坦加河 437.2 85.3 1.7 − 勒拿河 2460 532.0 20.7 6591 亚纳河 224 31.9 4.0 − 因迪吉尔卡河 329.4 54.2 11.1 − 科雷马河 650 122.0 10.1 1107  下载: 导出CSV
表 2 北极东西伯利亚陆架表层沉积汞含量分区
Table 2 Regional-specific Hg concentrations in the surface sediments of the East Siberian Arctic Shelf
区域 平均水深/m 汞含量/(ng/g) 汞含量平均值/(ng/g) 站位数 Ⅰ 区 26 4~50 33 34 Ⅱ 区 89 40~114 58 38 Ⅲ 区 1801 69~119 84 15
下载: 导出CSV
-
[1] Selin N E. Global biogeochemical cycling of mercury: a review [J]. Annual Review of Environment and Resources, 2009, 34: 43-63. doi: 10.1146/annurev.environ.051308.084314
[2] Sonke J E, Heimbürger L E. Mercury in flux [J]. Nature Geoscience, 2012, 5(7): 447-448. doi: 10.1038/ngeo1508
[3] Lindberg S, Bullock R, Ebinghaus R, et al. A synthesis of progress and uncertainties in attributing the sources of mercury in deposition [J]. AMBIO:A Journal of the Human Environment, 2007, 36(1): 19-32. doi: 10.1579/0044-7447(2007)36[19:ASOPAU]2.0.CO;2
[4] Aksentov K I, Astakhov A S, Ivanov M V, et al. Assessment of mercury levels in modern sediments of the East Siberian Sea [J]. Marine Pollution Bulletin, 2021, 168: 112426. doi: 10.1016/j.marpolbul.2021.112426
[5] Kita I, Kojima M, Hasegawa H, et al. Mercury content as a new indicator of ocean stratification and primary productivity in Quaternary sediments off Bahama Bank in the Caribbean Sea [J]. Quaternary Research, 2013, 80(3): 606-613. doi: 10.1016/j.yqres.2013.08.006
[6] Kita I, Yamashita T, Chiyonobu S, et al. Mercury content in Atlantic sediments as a new indicator of the enlargement and reduction of Northern Hemisphere ice sheets [J]. Journal of Quaternary Science, 2016, 31(3): 167-177. doi: 10.1002/jqs.2854
[7] Scaife J D, Ruhl M, Dickson A J, et al. Sedimentary mercury enrichments as a marker for submarine large igneous province volcanism? Evidence from the Mid-Cenomanian event and Oceanic Anoxic Event 2 (Late Cretaceous) [J]. Geochemistry, Geophysics, Geosystems, 2017, 18(12): 4253-4275. doi: 10.1002/2017GC007153
[8] Font E, Adatte T, Andrade M, et al. Deccan volcanism induced high-stress environment during the Cretaceous-Paleogene transition at Zumaia, Spain: evidence from magnetic, mineralogical and biostratigraphic records [J]. Earth and Planetary Science Letters, 2018, 484: 53-66. doi: 10.1016/j.jpgl.2017.11.055
[9] Grasby S E, Them II T R, Chen Z H, et al. Mercury as a proxy for volcanic emissions in the geologic record [J]. Earth-Science Reviews, 2019, 196: 102880. doi: 10.1016/j.earscirev.2019.102880
[10] Lim D, Kim J, Xu Z K, et al. New evidence for Kuroshio inflow and deepwater circulation in the Okinawa Trough, East China Sea: sedimentary mercury variations over the last 20 kyr [J]. Paleoceanography, 2017, 32(6): 571-579. doi: 10.1002/2017PA003116
[11] Zou J J, Chang Y P, Zhu A M, et al. Sedimentary mercury and antimony revealed orbital-scale dynamics of the Kuroshio Current [J]. Quaternary Science Reviews, 2021, 265: 107051. doi: 10.1016/j.quascirev.2021.107051
[12] Krabbenhoft D P, Sunderland E M. Global change and mercury [J]. Science, 2013, 341(6153): 1457-1458. doi: 10.1126/science.1242838
[13] Schuster P F, Striegl R G, Aiken G R, et al. Mercury export from the Yukon River basin and potential response to a changing climate [J]. Environmental Science & Technology, 2011, 45(21): 9262-9267.
[14] Dastoor A P, Durnford D A. Arctic ocean: is it a sink or a source of atmospheric mercury? [J]. Environmental Science & Technology, 2014, 48(3): 1707-1717.
[15] Stern G A, Macdonald R W, Outridge P M, et al. How does climate change influence arctic mercury? [J]. Science of the Total Environment, 2012, 414: 22-42. doi: 10.1016/j.scitotenv.2011.10.039
[16] IPCC. Climate Change 2021: The Physical Science Basis. Contribution of Working Group I to the Sixth Assessment Report of the Intergovernmental Panel on Climate Change[M]. Cambridge: Cambridge University Press, 2021.
[17] Obrist D, Agnan Y, Jiskra M, et al. Tundra uptake of atmospheric elemental mercury drives Arctic mercury pollution [J]. Nature, 2017, 547(7662): 201-204. doi: 10.1038/nature22997
[18] Outridge P M, Macdonald R W, Wang F, et al. A mass balance inventory of mercury in the Arctic Ocean [J]. Environmental Chemistry, 2008, 5(2): 89-111. doi: 10.1071/EN08002
[19] Fisher J A, Jacob D J, Soerensen A L, et al. Riverine source of Arctic Ocean mercury inferred from atmospheric observations [J]. Nature Geoscience, 2012, 5(7): 499-504. doi: 10.1038/ngeo1478
[20] AMAP. AMAP Assessment 2002: Heavy Metals in the Arctic[M]. Oslo: Arctic Monitoring and Assessment Programme, 2004.
[21] Steffen A, Douglas T, Amyot M, et al. A synthesis of atmospheric mercury depletion event chemistry in the atmosphere and snow [J]. Atmospheric Chemistry and Physics, 2008, 8(6): 1445-1482. doi: 10.5194/acp-8-1445-2008
[22] Zhang Y X, Jacob D J, Dutkiewicz S, et al. Biogeochemical drivers of the fate of riverine mercury discharged to the global and Arctic oceans [J]. Global Biogeochemical Cycles, 2015, 29(6): 854-864. doi: 10.1002/2015GB005124
[23] Kim H, Lee K, Lim D I, et al. Increase in anthropogenic mercury in marginal sea sediments of the Northwest Pacific Ocean [J]. Science of the Total Environment, 2019, 654: 801-810. doi: 10.1016/j.scitotenv.2018.11.076
[24] Darby D A, Polyak L, Bauch H A. Past glacial and interglacial conditions in the Arctic Ocean and marginal seas-a review [J]. Progress in Oceanography, 2006, 71(2-4): 129-144. doi: 10.1016/j.pocean.2006.09.009
[25] Vonk J E, Sánchez-García L, van Dongen B E, et al. Activation of old carbon by erosion of coastal and subsea permafrost in Arctic Siberia [J]. Nature, 2012, 489(7414): 137-140. doi: 10.1038/nature11392
[26] Shakhova N, Semiletov I, Gustafsson O, et al. Current rates and mechanisms of subsea permafrost degradation in the East Siberian Arctic Shelf [J]. Nature Communications, 2017, 8: 15872. doi: 10.1038/ncomms15872
[27] Stein R, Fahl K, Schade I, et al. Holocene variability in sea ice cover, primary production, and Pacific‐Water inflow and climate change in the Chukchi and East Siberian Seas (Arctic Ocean) [J]. Journal of Quaternary Science, 2017, 32(3): 362-379. doi: 10.1002/jqs.2929
[28] Opsahl S, Benner R, Amon R M W. Major flux of terrigenous dissolved organic matter through the Arctic Ocean [J]. Limnology and Oceanography, 1999, 44(8): 2017-2023. doi: 10.4319/lo.1999.44.8.2017
[29] Stein R. Arctic Ocean Sediments: Processes, Proxies, and Paleoenvironment[M]. Amsterdam: Elsevier, 2008.
[30] Suchet P A, Probst J L, Ludwig W. Worldwide distribution of continental rock lithology: implications for the atmospheric/soil CO2 uptake by continental weathering and alkalinity river transport to the oceans [J]. Global Biogeochemical Cycles, 2003, 17(2): 1038.
[31] Holmes R M, McClelland J W, Peterson B J, et al. A circumpolar perspective on fluvial sediment flux to the Arctic Ocean [J]. Global Biogeochemical Cycles, 2002, 16(4): 1098.
[32] Guay C K, Falkner K K. Barium as a tracer of Arctic halocline and river waters [J]. Deep Sea Research Part II:Topical Studies in Oceanography, 1997, 44(8): 1543-1569. doi: 10.1016/S0967-0645(97)00066-0
[33] Dastoor A, Angot H, Bieser J, et al. Arctic mercury cycling [J]. Nature Reviews Earth & Environment, 2022, 3(4): 270-286.
[34] Peterson B J, Holmes R M, McClelland J W, et al. Increasing river discharge to the Arctic Ocean [J]. Science, 2002, 298(5601): 2171-2173. doi: 10.1126/science.1077445
[35] Sonke J E, Teisserenc R, Heimbürger-Boavida L E, et al. Eurasian river spring flood observations support net Arctic Ocean mercury export to the atmosphere and Atlantic Ocean [J]. Proceedings of the National Academy of Sciences of the United States of America, 2018, 115(50): E11586-E11594.
[36] Zolkos S, Krabbenhoft D P, Suslova A, et al. Mercury export from arctic great rivers [J]. Environmental Science & Technology, 2020, 54(7): 4140-4148.
[37] Gordeev V V. Fluvial sediment flux to the Arctic Ocean [J]. Geomorphology, 2006, 80(1-2): 94-104. doi: 10.1016/j.geomorph.2005.09.008
[38] Weingartner T J, Danielson S, Sasaki Y, et al. The Siberian coastal current: a wind- and buoyancy-forced Arctic coastal current [J]. Journal of Geophysical Research:Oceans, 1999, 104(C12): 29697-29713. doi: 10.1029/1999JC900161
[39] 李日升, 郭跃安, 孙冬娥, 等. 化学蒸气发生-多通道原子荧光光谱法同时测定化探样品中的砷、锑、铋、汞[J]. 理化检验(化学分册), 2014, 50(5):569-571 LI Risheng, GUO Yuean, SUN Donge, et al. Simultaneous determination of As, Sb, Bi, and Hg in geological samples by Hg-Multi-channel-AFS [J]. Physical Testing and Chemical Analysis (Part B:Chemical Analysis), 2014, 50(5): 569-571.
[40] Wedepohl K H. The composition of the continental crust [J]. Geochimica et Cosmochimica Acta, 1995, 59(7): 1217-1232. doi: 10.1016/0016-7037(95)00038-2
[41] Sattarova V, Aksentov K, Astakhov A, et al. Trace metals in surface sediments from the Laptev and East Siberian Seas: levels, enrichment, contamination assessment, and sources [J]. Marine Pollution Bulletin, 2021, 173: 112997. doi: 10.1016/j.marpolbul.2021.112997
[42] Zhang J, Liu C L. Riverine composition and estuarine geochemistry of particulate metals in China: weathering features, anthropogenic impact and chemical fluxes [J]. Estuarine, Coastal and Shelf Science, 2002, 54(6): 1051-1070. doi: 10.1006/ecss.2001.0879
[43] Chakraborty P, Sarkar A, Vudamala K, et al. Organic matter: a key factor in controlling mercury distribution in estuarine sediment [J]. Marine Chemistry, 2015, 173: 302-309. doi: 10.1016/j.marchem.2014.10.005
[44] 赵一阳. 中国海大陆架沉积物地球化学的若干模式[J]. 地质科学, 1983(4):307-314 ZHAO Yiyang. Some geochemical patterns of shelf sediments of the China seas [J]. Scientia Geologica Sinica, 1983(4): 307-314.
[45] 李秋玲, 乔淑卿, 石学法, 等. 北极东西伯利亚陆架沉积物物源: 来自黏土矿物和化学元素的证据[J]. 海洋学报, 2021, 43(3):76-89 LI Qiuling, QIAO Shuqing, SHI Xuefa, et al. Sediment provenance of the East Siberian Arctic Shelf: evidence from clay minerals and chemical elements [J]. Haiyang Xuebao, 2021, 43(3): 76-89.
[46] Thorne L T, Nickless G. The relation between heavy metals and particle size fractions within the severn estuary (U. K. ) inter-tidal sediments [J]. Science of the Total Environment, 1981, 19(3): 207-213. doi: 10.1016/0048-9697(81)90017-6
[47] Araújo M F D, Bernard P C, Van Grieken R E. Heavy metal contamination in sediments from the Belgian coast and Scheldt estuary [J]. Marine Pollution Bulletin, 1988, 19(6): 269-273. doi: 10.1016/0025-326X(88)90597-8
[48] 夏逸. 北极拉普捷夫海现代沉积有机碳源汇过程与埋藏记录[D]. 自然资源部第一海洋研究所硕士学位论文, 2022 XIA Yi. Source sink processes and burial records of modern sedimentary organic carbon in the Arctic Laptev Sea[D]. Master Dissertation of First Institute of Oceanography, Ministry of Natural Resources, 2022.
[49] 叶君, 胡利民, 石学法, 等. 基于木质素示踪北极东西伯利亚陆架沉积有机碳的来源、输运与埋藏[J]. 第四纪研究, 2021, 41(3):752-765 doi: 10.11928/j.issn.1001-7410.2021.03.11 YE Jun, HU Limin, SHI Xuefa, et al. Sources, transport and burial of terrestrial organic carbon in the surface sediments across the East Siberian Arctic shelf, insights from lignin [J]. Quaternary Sciences, 2021, 41(3): 752-765. doi: 10.11928/j.issn.1001-7410.2021.03.11
[50] 于文秀, 胡利民, 石学法, 等. 北极东西伯利亚陆架黑碳的地球化学特征及其环境意义[J]. 海洋地质与第四纪地质, 2022, 42(4):50-60 doi: 10.16562/j.cnki.0256-1492.2022022001 YU Wenxiu, HU Limin, SHI Xuefa, et al. Geochemical characteristics of black carbon in surface sediments of the East Siberian Arctic Shelf and their environmental implications [J]. Marine Geology & Quaternary Geology, 2022, 42(4): 50-60. doi: 10.16562/j.cnki.0256-1492.2022022001
[51] Stein R. The great challenges in Arctic Ocean paleoceanography [J]. IOP Conference Series:Earth and Environmental Science, 2011, 14: 012001. doi: 10.1088/1755-1315/14/1/012001
[52] Stein R, Fahl K. Holocene accumulation of organic carbon at the Laptev Sea continental margin (Arctic Ocean): sources, pathways, and sinks [J]. Geo-Marine Letters, 2000, 20(1): 27-36. doi: 10.1007/s003670000028
[53] Semiletov I, Dudarev O, Luchin V, et al. The East Siberian Sea as a transition zone between Pacific‐derived waters and Arctic shelf waters [J]. Geophysical Research Letters, 2005, 32(10): L10614. doi: 10.1029/2005GL022490
[54] Karlsson E S, Brüchert V, Tesi T, et al. Contrasting regimes for organic matter degradation in the East Siberian Sea and the Laptev Sea assessed through microbial incubations and molecular markers [J]. Marine Chemistry, 2015, 170: 11-22. doi: 10.1016/j.marchem.2014.12.005
[55] Savelieva N I, Semiletov I P, Vasilevskaya L N, et al. A climate shift in seasonal values of meteorological and hydrological parameters for Northeastern Asia [J]. Progress in Oceanography, 2000, 47(2-4): 279-297. doi: 10.1016/S0079-6611(00)00039-2
[56] Stroeve J, Barrett A, Serreze M, et al. Using records from submarine, aircraft and satellites to evaluate climate model simulations of Arctic sea ice thickness [J]. The Cryosphere, 2014, 8(5): 1839-1854. doi: 10.5194/tc-8-1839-2014
[57] 胡利民, 石学法, 叶君, 等. 北极东西伯利亚陆架沉积有机碳的源汇过程研究进展[J]. 地球科学进展, 2020, 35(10):1073-1086 doi: 10.11867/j.issn.1001-8166.2020.086 HU Limin, SHI Xuefa, YE Jun, et al. Advances in the sources and sink of sedimentary organic carbon in the East Siberian Arctic Shelf [J]. Advances in Earth Science, 2020, 35(10): 1073-1086. doi: 10.11867/j.issn.1001-8166.2020.086
[58] Macdonald R W, Kuzyk Z Z A, Johannessen S C, et al. The vulnerability of Arctic shelf sediments to climate change [J]. Environmental Reviews, 2015, 23(4): 461-479. doi: 10.1139/er-2015-0040
[59] Chen L, Zhang Y X, Jacob D J, et al. A decline in Arctic Ocean mercury suggested by differences in decadal trends of atmospheric mercury between the Arctic and northern midlatitudes [J]. Geophysical Research Letters, 2015, 42(14): 6076-6083. doi: 10.1002/2015GL064051
[60] Emmerton C A, Graydon J A, Gareis J A L, et al. Mercury export to the Arctic Ocean from the Mackenzie River, Canada [J]. Environmental Science & Technology, 2013, 47(14): 7644-7654.
[61] St. Pierre K A, Zolkos S, Shakil S, et al. Unprecedented increases in total and methyl mercury concentrations downstream of retrogressive thaw slumps in the western Canadian Arctic [J]. Environmental Science & Technology, 2018, 52(24): 14099-14109.
[62] Schaefer K, Elshorbany Y, Jafarov E, et al. Potential impacts of mercury released from thawing permafrost [J]. Nature Communications, 2020, 11(1): 4650. doi: 10.1038/s41467-020-18398-5
[63] Søndergaard J, Tamstorf M, Elberling B, et al. Mercury exports from a High-Arctic river basin in Northeast Greenland (74°N) largely controlled by glacial lake outburst floods [J]. Science of the Total Environment, 2015, 514: 83-91. doi: 10.1016/j.scitotenv.2015.01.097
[64] Morel F M M, Kraepiel A M L, Amyot M. The chemical cycle and bioaccumulation of mercury [J]. Annual Review of Ecology and Systematics, 1998, 29: 543-566. doi: 10.1146/annurev.ecolsys.29.1.543
[65] Bianchi T S. The role of terrestrially derived organic carbon in the coastal ocean: a changing paradigm and the priming effect [J]. Proceedings of the National Academy of Sciences of the United States of America, 2011, 108(49): 19473-19481. doi: 10.1073/pnas.1017982108
[66] Rontani J F, Charrière B, Sempéré R, et al. Degradation of sterols and terrigenous organic matter in waters of the Mackenzie Shelf, Canadian Arctic [J]. Organic Geochemistry, 2014, 75: 61-73. doi: 10.1016/j.orggeochem.2014.06.002
[67] 汪卫国, 方建勇, 陈莉莉, 等. 楚科奇海悬浮体含量分布及其颗粒组分特征[J]. 极地研究, 2014, 26(1):79-88 doi: 10.13679/j.jdyj.2014.1.079 WANG Weiguo, FANG Jianyong, CHEN Lili, et al. The distribution and composition of suspended particles in the Chukchi Sea [J]. Chinese Journal of Polar Research, 2014, 26(1): 79-88. doi: 10.13679/j.jdyj.2014.1.079
[68] 王春娟, 刘焱光, 董林森, 等. 白令海与西北冰洋表层沉积物粒度分布特征及其环境意义[J]. 海洋地质与第四纪地质, 2015, 35(3):1-9 WANG Chunjuan, LIU Yanguang, DONG Linsen, et al. The distribution pattern of the surface sediments in the Bering Sea and the western Arcric and its environmental implications [J]. Marine Geology & Quaternary Geology, 2015, 35(3): 1-9.
[69] Nürnberg D, Wollenburg I, Dethleff D, et al. Sediments in Arctic sea ice: implications for entrainment, transport and release [J]. Marine Geology, 1994, 119(3-4): 185-214. doi: 10.1016/0025-3227(94)90181-3
[70] Charette M A, Kipp L E, Jensen L T, et al. The transpolar drift as a source of riverine and shelf-derived trace elements to the central Arctic Ocean [J]. Journal of Geophysical Research:Oceans, 2020, 125(5): e2019JC015920.
[71] Yurco L N, Ortiz J D, Polyak L, et al. Clay mineral cycles identified by diffuse spectral reflectance in Quaternary sediments from the Northwind Ridge: implications for glacial-interglacial sedimentation patterns in the Arctic Ocean [J]. Polar Research, 2010, 29(2): 176-197. doi: 10.1111/j.1751-8369.2010.00160.x
[72] Figueiredo T S, Santos T P, Costa K B, et al. Effect of deep Southwestern Subtropical Atlantic Ocean circulation on the biogeochemistry of mercury during the last two glacial/interglacial cycles [J]. Quaternary Science Reviews, 2020, 239: 106368. doi: 10.1016/j.quascirev.2020.106368
[73] Quémerais B, Cossa D, Rondeau B, et al. Mercury distribution in relation to iron and manganese in the waters of the St. Lawrence river [J]. Science of the Total Environment, 1998, 213(1-3): 193-201. doi: 10.1016/S0048-9697(98)00092-8
[74] Shen J, Feng Q L, Algeo T J, et al. Sedimentary host phases of mercury (Hg) and implications for use of Hg as a volcanic proxy [J]. Earth and Planetary Science Letters, 2020, 543: 116333. doi: 10.1016/j.jpgl.2020.116333
[75] Hasan A B, Kabir S, Reza A H M S, et al. Enrichment factor and geo-accumulation index of trace metals in sediments of the ship breaking area of Sitakund Upazilla (Bhatiary-Kumira), Chittagong, Bangladesh [J]. Journal of Geochemical Exploration, 2013, 125: 130-137. doi: 10.1016/j.gexplo.2012.12.002
[76] Kim H, Lee K, Lim D I, et al. Widespread anthropogenic nitrogen in northwestern Pacific Ocean sediments [J]. Environmental Science & Technology, 2017, 51(11): 6044-6052.
[77] Kim J, Lim D, Jung D, et al. Sedimentary mercury (Hg) in the marginal seas adjacent to Chinese high-Hg emissions: source-to-sink, mass inventory, and accumulation history [J]. Marine Pollution Bulletin, 2018, 128: 428-437. doi: 10.1016/j.marpolbul.2018.01.058
[78] Astakhov A S, Gorbarenko S A, Bakhareva G A, et al. Distribution and accumulation rate of ore elements in Holocene and Late Glacial Sediments of the Deryugin Basin, Sea of Okhotsk [J]. Lithology and Mineral Resources, 2005, 40(2): 97-113. doi: 10.1007/s10987-005-0012-1
[79] Sattarova V V, Aksentov K I. Geochemistry of mercury in surface sediments of the Kuril Basin of the Sea of Okhotsk, Kuril-Kamchatka Trench and adjacent abyssal plain and northwest part of the Bering Sea [J]. Deep Sea Research Part II:Topical Studies in Oceanography, 2018, 154: 24-31. doi: 10.1016/j.dsr2.2017.09.002
[80] Kalinchuk V, Aksentov K, Karnaukh V. Gaseous elemental mercury (Hg (0)) in the surface air over the Sea of Japan, the Sea of Okhotsk and the Kuril-Kamchatka sector of the Pacific Ocean in August-September 2017 [J]. Chemosphere, 2019, 224: 668-679. doi: 10.1016/j.chemosphere.2019.02.185
-
期刊类型引用(7)
1. 邓兴渝,曹文瑞,姜明玉,曾志刚,常凤鸣,宋召军. 冲绳海槽南部热液区附近柱状沉积物中微生物的垂直分布多样性及其对环境因子的响应. 海洋地质与第四纪地质. 2023(05): 198-213 .  本站查看
本站查看
2. 蒋伟,周兵仔,李磊,蒋训雄,张登高. 深海多金属硫化物选冶联合技术研究. 中国有色金属学报. 2021(10): 2902-2912 . 百度学术
3. 沈芳,韩喜球,李洪林,王叶剑. 海底多金属硫化物资源预测:方法与思考. 中国有色金属学报. 2021(10): 2682-2695 . 百度学术
4. 马瑶,赵江南,廖时理. 模糊层次分析法在西南印度洋中脊46°~52°E多金属硫化物远景区预测中的应用. 地质科技通报. 2020(06): 75-82 . 百度学术
5. 李江海,宋珏琛,洛怡. 深海多金属硫化物采矿研究进展及其前景探讨. 海洋开发与管理. 2019(11): 29-37 . 百度学术
6. 张柏松,李振清,程杨. 现代海底块状硫化物矿床储量估算方法探讨. 地质与勘探. 2018(04): 723-734 . 百度学术
7. 汪建军,陶春辉,王华军,邓显明,熊威,李泽. 海底多金属硫化物自然电位观测方式研究. 海洋学报. 2018(01): 57-67 . 百度学术
其他类型引用(6)


计量
- 文章访问数: 2444
- HTML全文浏览量: 594
- PDF下载量: 150
- 被引次数: 13