The origin and process of hypoxia in the Yangtze River Estuary
-
摘要: 长江口已成为世界低氧海域的一个代表性区域。近年来长江口低氧区的分布范围不断扩大,强度不断加剧。对该低氧区的表现特征、形成机制、生物地球化学过程以及生态环境影响做系统的分析和综述,并结合世界多处典型低氧区开展对比分析,认为长江口低氧区域在地理学、海洋学上均不同于波罗的海、黑海以及东京湾等区域的低氧区,是全球低氧生态学研究的一个新的案例。该区域的深入研究将有望丰富海洋生态学研究范畴。通过综合地球化学、生态学、物理海洋学等多学科方法和技术手段,发展低氧生态学,为研究海洋低氧现象的形成机制和生态效应,以及开展防治提供方法和理论支持。Abstract: The Yangtze Estuary is one of the most typical hypoxic regions in the world. The aggravation and expansion of the hypoxia are obvious in the past few years. This paper aims to synthetically analyze the origin of the hypoxia, its biogeochemical processes and its hazardous influence on the local ecological system. By comparing with other hypoxic areas in the world, the hypoxia of the Yangtze Estuary is found rather different geographically and oceanographically from those in the Gulf of Mexico, the Baltic Sea, the Black Sea and Tokyo Bay. The study of the case would greatly help the deeper research of marine ecology in this area. By briefly combining geochemistry, ecology, oceanography and other subjects, the necessity of developing hypoxia ecology is proposed by the authors to fill the blank in this field.
-
低氧一般定义为水体溶解氧含量低于2mg/L。由于水体氧含量过低及相关效应,低氧区的生态环境会受到极大影响。20世纪60年代以来对低氧相关事件的报道不断增加[1],尤其是以墨西哥湾为代表的几大典型低氧区,引起了国际学界的广泛重视并开展了大量研究。而在中国,经济飞速发展带来的工业化、城镇化进程的不断加快,农业面源污染的不断加剧,导致在20世纪末就被观测到的长江口低氧区面积持续扩大,延续时间增长,缺氧水平不断加剧。目前普遍认为长江口低氧区主要位于32°~30°N和浙江沿海海域[2]。
长江口低氧区的研究可追溯至20世纪80年代。本文主要依据长江口低氧区域的研究历史和现状,结合世界上其他低氧区的研究成果,为长江口低氧区的进一步研究和治理提供参考。
1. 研究进展
1.1 研究方法
在低氧区的研究过程中,为了解低氧区的形成机制及生态环境影响等,除了地质研究外,往往需要综合海洋化学、生物地球化学和生态学等不同学科的技术手段和方法。
水体溶解氧含量是圈定研究低氧区位置、范围、变化规律等基本状况的第一要素。通过测量不同时间、站位和深度的水体溶解氧含量,可确定低氧区的水平和垂直分布及动态变化特征[3-5]。通过分析水体溶解氧含量和温度、盐度、叶绿素a含量等参数的相互关系,可进一步了解低氧区的形成机制[6-8]。近年来,有研究表明,生物标记化合物如沉积物剖面中植物色素的种类和分布特征可有效反映低氧区的发展历史[9,10],结合碳、氮等稳定同位素可获得更翔实的物源信息[11,12],从而有效判断低氧区的发展变化情况、形成原因及影响因素。低氧区沉积物中重金属元素分布特征研究反映了人为污染状况以及其生态环境效应[13-15]。变价元素(如As等)的相态特征及转变通量已经成为低氧区地球化学过程研究的常用手段[16]。综合分析沉积物中有机和无机指标,重构低氧区发展历史已经成为低氧区地球化学研究采用的主要的技术路线和方法[17,18]。
生态学研究方法则主要通过分析低氧区生物群落变化来研究低氧的生态效应、重构低氧区发展历史、评价低氧区生态环境影响范围和程度等。研究指标涉及低氧区及邻近海域生物种类组成、细胞丰度及其分布、多样性指数、均匀度指数和优势度指数等生态参数。通过分析低氧区生态参数与温度、盐度及溶解氧、硝酸盐、磷酸盐含量等环境因子的关系,来认识低氧区的生物地球化学过程以及低氧对于生态环境的影响及其作用机制[19,20]。已有研究表明利用沉积物记录的有孔虫种群变化可有效反演低氧区发展历史[21,22]。
海洋化学、生态学、生物地球化学等不同学科方法在低氧领域的综合系统应用,研究低氧现象提供了很好的方法手段和技术支撑。现阶段,大多数研究都是通过不同学科方法的结合,以获得更全面的对于低氧区的认识。如有学者结合植物色素、木质素、放射性同位素、稳定碳氮同位素和有孔虫化石等一系列的分析方法,重建了长江口地区的低氧历史,并认为早期低氧事件可能是土地利用状况的变化导致陆源有机质输入量剧增引发的氧消耗所致,同时发现了一些生物标记化合物和微生物化石指标同总碳氮同位素反映的物源信息不同,推测前者仅反映了较小物源组分特征[23,24],表明单一指标在低氧区研究中存在一定局限性。
1.2 时空分布特征
长江口低氧区开始于晚春初夏(一般5月溶解氧浓度远小于4月份),面积在8月份达到最大(可达20000km2),低氧程度也达到最大(DO含量低至1mg/L),秋季低氧开始减弱(但是南部仍可低至<3mg/L),冬天消失[25]。长江口低氧主要发生于20m以下的近底层水体中[3](图 1,2)。
![图 1 夏季长江口溶解氧(mg/L)分布[26]]() 图 1 夏季长江口溶解氧(mg/L)分布[26]Figure 1. Distribution of DO (mg/L) in Yangtze River Estuary in summer
图 1 夏季长江口溶解氧(mg/L)分布[26]Figure 1. Distribution of DO (mg/L) in Yangtze River Estuary in summer![图 2 夏季长江口北部(上)和南部(下)温度、盐度和溶解氧剖面[12]]() 图 2 夏季长江口北部(上)和南部(下)温度、盐度和溶解氧剖面[12]Figure 2. Summer vertical profiles of temperature, salinity and DO of transects in north(upper) and south(lower) of Yangtze Estuary
图 2 夏季长江口北部(上)和南部(下)温度、盐度和溶解氧剖面[12]Figure 2. Summer vertical profiles of temperature, salinity and DO of transects in north(upper) and south(lower) of Yangtze Estuary关于低氧区具体的演化过程,有学者已经做过较详细研究,发现6月份长江口部分地区溶解氧浓度开始降到2mg/L以下,随时间推移,开始出现大面积的水体低氧区,并分为南北两部分,其中北部低氧区不断向东北方向扩展,在8月份达到巅峰(面积超过15000km2),随后向南退缩消失[4]。此外台风也会破坏低氧的连续性[6]。
对长江口低氧区年际变化的研究表明,过去50年里,夏季出现低氧现象的概率约为60%,1990年之后提高至90%。低氧区面积变化较大,在1990年之后普遍大于5000km2,且有扩大趋势,虽然近年来面积似有减小(表 1),低氧现象的持续时间并没有表现出明显的变化趋势[27]。
表 1 长江口低氧区的历史记录Table 1. History of hypoxia in the Yangtze River Estuary1.3 成因
研究发现,低氧发生区域往往以强烈的水体分层为前提,尤其是盐度分层。水体分层会阻止水体中溶解氧的垂直传输。这种水体分层是由于不同来源的水体未充分混合。在长江口区域,由长江冲淡水和高盐度的台湾暖流之间的密度差异导致的水体分层(图 2),阻止了氧的垂直传输。同时,有学者在该区域发现了来自台湾暖流的高营养盐上升流。该上升流的存在,一方面在垂向上扩大了低氧水体的范围,另一方面其本身的高盐度和再悬浮作用为上层水体提供了大量的营养盐(硝酸盐浓度高达20μmol/L[26]),其低浊度改善了上层水体的光照条件,从而提高了上层水体的初级生产力[31],净生产力的提高不能完全被次级生物利用,剩余有机质的降解增加了氧的消耗,进一步加剧了低氧。
受水动力条件影响,水体分层会被破坏,因而低氧现象往往形成于相对较弱的水动力环境下。研究表明,由于全球气候变化,近几十年来长江口夏季海表风的应力减弱(1976年以来,偏南风的风速下降约1.5m/s),海水温度上升了0.5℃[32],这可能与长江口低氧区的扩张有着密切关系。
除了水体分层这一前提,低氧区形成的重要原因是氧气消耗,低氧区水体往往有机质浓度较高,具有较高的表观耗氧量(8月份低氧区底层水体平均表观耗氧量为3.9mg/L, 而10月份则仅约0.1mg/L)。水体分层显著的区域,由于氧的垂直传输受阻,表观耗氧量完全受控于有机质含量。研究发现,在缺氧区开始的6月份,由于该海域的富营养化(无机氮浓度平均0.3~0.4mg/L,最高达1mg/L,磷酸盐磷浓度0.02~0.03mg/L[19]),水体中叶绿素a含量显著高于其他月份(0.75~5μg/L,最大超过10μg/L[26]),高的初级生产力产生大量有机质的分解消耗了溶解氧,很好地解释了8月份的严重低氧现象。台湾暖流携带的黑潮水中含有大量的藻类碎屑等有机质,和长江入海径流携带的有机质共同促成了低氧区的形成和发展。
1.4 生态效应
低氧区低的溶解氧含量和其他环境要素,对生物群落产生了非常大的影响。
目前已有大量关于环境因素对水体中微生物(包括氨氧化细菌和古菌[33-35]、甲烷氧化细菌[36]等)的影响研究。对长江口低氧区微生物的研究发现底层氨化细菌平均密度为184个/L,而低氧区可达2500个/L[37]。由于低氧往往发生于底层水体,对浮游生物影响较小,长江口海域未发现浮游植物的分布异常[19]。但在低氧区沉积物中,微生物的种群结构、生理过程均受到扰动,硝化与反硝化作用过程受到影响,导致沉积物中氮(以氨或铵根形式存在)和磷等营养盐[38]输出,这可能会促进表层初级生产力。
低氧区低的溶解氧含量和可能产生的硫化物,会对一些较高等生物尤其是底栖动物产生严重影响,导致底栖生物数量显著下降,使生态系统能量更集中于微生物(图 3)。在世界长期低氧水体中都发现次级生产力低和底栖生物较少,总生物量和生物多样性减少,表明低氧对区域碳循环有着巨大影响(波罗的海每年因此损失约264000t碳,占生态系统总碳的约30%)[39,40]。而在长江口低氧区,由于富营养化程度加剧,长江冲淡水携带的泥沙量减小,改善了光照条件,导致赤潮频繁发生[4],对区域生态环境造成严重破坏。
![图 3 不同程度低氧对生态系统能量流动的影响[39]]() 图 3 不同程度低氧对生态系统能量流动的影响[39](流向捕食者的能量:指初级生产者流向下一级的能量中被转化为捕食者的能量的比例; 流向微生物的能量同理)Figure 3. How hypoxia alters ecosystem energy flow
图 3 不同程度低氧对生态系统能量流动的影响[39](流向捕食者的能量:指初级生产者流向下一级的能量中被转化为捕食者的能量的比例; 流向微生物的能量同理)Figure 3. How hypoxia alters ecosystem energy flow2. 与世界其他缺氧区的比较
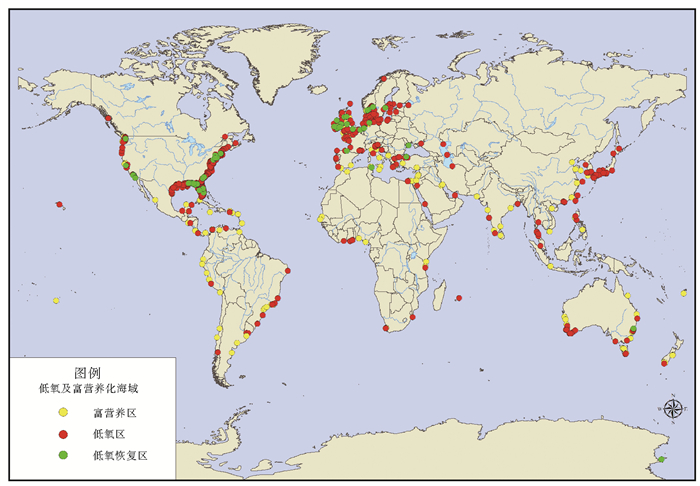
20世纪60年代以来,全球范围内低氧区数目迅速增加,截止2008年已经超过400个,总面积超过245000km2。目前发现的低氧区主要集中于东太平洋、非洲西部的南大西洋、阿拉伯海、孟加拉湾等(图 4)。Diaz等人根据低氧的发生频率和持续时间将低氧区划分为不定期型(间隔一年或数年)、间歇型(昼夜或季节循环、持续数小时、数天到数星期)、季节型(一年一次)、持续型(长期低氧)[39]。由于夏季水体温度较高且容易强烈分层,因此,富营养化导致的低氧多为季节型,表 2列出了世界上一些典型低氧区的情况。
![图 4 世界低氧区和富营养化海域的分布]() 图 4 世界低氧区和富营养化海域的分布Figure 4. World hypoxic and eutrophication coastal area(Diaz R, Selman M, 2010, http://www.wri.org/resource/world-hypoxic-and-eutrophic-coastal-areas)表 2 世界典型低氧区及其特征Table 2. Typical hypoxic areas around the world
图 4 世界低氧区和富营养化海域的分布Figure 4. World hypoxic and eutrophication coastal area(Diaz R, Selman M, 2010, http://www.wri.org/resource/world-hypoxic-and-eutrophic-coastal-areas)表 2 世界典型低氧区及其特征Table 2. Typical hypoxic areas around the world位置 国家 影响 类型 低氧面积/km2(年份) 参考文献 东京湾 日本 底栖生物死亡 不定期型 683(2006) [42] 维尼亚湾 美国 - 间歇型 29(2007) [39] 卡特加特海峡 瑞士等 底栖生物经历了长的恢复期 季节型 3850(1992) [39] 东海(长江口) 中国 - 季节型 15400(2006) [7] 墨西哥湾 美国 - 季节型 20000(2007) [43] 黑海低氧区 黑海 底栖生物死亡但每年恢复 季节型 40000(2006) [39] 亚述海 俄罗斯等 底栖生物减少,生产力下降 持续型 8560(2008) [39] 波罗的海 - - 持续型 67700 (2006) [41] 孟加拉湾 印度等 - - 1600000(2009) [44] 阿拉伯海 印度等 - - 250000(2009) [44] 长江口低氧区同墨西哥湾低氧区都是水体富营养化导致的,而波罗的海低氧区为自然成因。波罗的海低氧区自8000年前就间歇出现,受冰期后变化的海平面、异常大陆抬升运动及多变气候的强烈影响,但目前波罗的海低氧状况的加剧也同水体富营养化有着密切关系[41]。此外,东京湾低氧区的形成发展与风有重要联系[42]。目前研究认为长江口低氧区主要受长江冲淡水和台湾暖流的影响,针对风、气候对低氧区的影响鲜有研究。
同世界上其他低氧区相比,长江口低氧区面积较大,但远小于波罗的海低氧区,与墨西哥湾低氧区相当,但增长速度更快[43]。
整体来看,长江口低氧区虽然低氧历史较短,但面积较大且增长较快,近年来该区域受人为活动影响加重,富营养化程度加剧,赤潮等生态灾害事件频繁发生,是非常典型的现代低氧区,对长江口低氧区的深入研究有着非常重要的现实意义。
地质历史时期发生过的大规模低氧事件,对研究现代低氧具有重要的借鉴意义。例如在北大西洋和地中海发现的白垩纪时期普遍发生的黑色页岩沉积,与当时的低氧事件可能密切相关,这些低氧事件可能与构造活动相关甚至由构造活动决定[45]。气候和海洋条件的变化无疑也有重要的影响。由于富营养化带来的高的初级生产力和低氧条件,大量有机质被埋藏,最终形成特征黑色页岩沉积[46]。由于碳酸盐显著的碳同位素正偏,可以用来识别地质历史中的低氧事件。
3. 展望及建议
3.1 多学科综合研究
虽然目前对于长江口低氧区已经有了较多认识,但仍存在一些问题有待进一步深入研究,并且需要多个学科协同合作,共同完成。
研究表明,长江口低氧区出现了南北两个分区,两者的形成机制存在一定的差异。北部有更强烈的水体分层,南部则主要受有机质降解控制[8]。但两个分区具体的水动力条件或生物活动如何影响其形成、发展和消亡,都需要进一步深入研究和比较。由于缺乏20世纪80年代以前的相关数据,需要对低氧区海域的沉积物剖面进行分析以获得长江口低氧区的发展历史,尽管已有结合多个无机和有机地球化学和微生物参数开展低氧区分析研究的众多报道,但时刻关注并结合微生物学和有机地球化学领域的最新进展,采用各学科综合的研究手段开展低氧区的研究显然是获得更多、更准确、更可靠信息的必要前提。此外,长江口低氧区除受长江冲淡水和台湾暖流的影响,可能还受来自北部黄东海交界处海流的影响,因此,必须在区域水动力学背景下开展地球化学等多学科综合研究。近年来有学者研究发现,台风导致的水体混合会减小低氧水体的体积,北方冷空气的入侵也会改变风向并使低氧完全消失[6],极端气候下气压、溶解氧分压的变化可能与低氧现象密切相关,这显然需要进一步深入研究。也有学者观测到了潮汐对低氧区的影响[47],其作用机制也需要进一步的多学科合作研究。
由此可见,对长江口低氧区更深入的研究,需要多个学科包括地球化学、生态学、微生物学和物理海洋学等的协作综合研究,并以此为基础发展低氧生态学,为研究低氧现象提供理论基础。
3.2 低氧生态学
近年来,世界范围内低氧现象不断加剧,造成区域生态环境衰退甚至恶化,引起了国际社会和相关领域科研部门的广泛关注。现有的研究手段和方法、已经取得的对低氧现象的认识,为低氧生态学的提出奠定了学科发展基础。低氧生态学作为生态学的一门分支科学,主要研究低氧区海域形成发展的理论机制,解释低氧环境与生物的相互作用过程及其规律。
从研究方法和对象上来讲,低氧生态学在微观上利用生物学、地球化学的方法研究低氧区的元素地球化学过程(主要包括C、N、P等元素),生物组成及主要由厌氧氨氧化细菌、反硝化细菌等微生物参与的生物地球化学过程;中等尺度上,通过研究低氧区水团特征(包括盐度、DO浓度、温度、初级生产力等)和水动力特征,了解、认识低氧区形成条件及发展趋势、气象气候条件同低氧区发展的关系,需要生态学、地球化学和物理海洋学等学科的协同研究;宏观上,则在区域尺度甚至全球尺度研究区域经济活动、碳排放和气候变化等同低氧区的联系。
在实际观测和研究过程中,要做到空间与时间两方面兼顾。空间上,既有详细的站点观测数据,又有区域整体信息,做到点面结合;时间上,在实际观测中做到静态与动态兼顾,既获得某时刻的信息,也有持续的观测以反映变化趋势,另外通过对历史资料包括遥感和沉积记录的研究,获得历史信息,通过分析模拟以预测未来发展。低氧生态学的提出有利于对低氧区有一个更全面的认识,为低氧区的治理提供理论支撑。
-
![]()
图 1 夏季长江口溶解氧(mg/L)分布[26]
Figure 1. Distribution of DO (mg/L) in Yangtze River Estuary in summer
![]()
图 2 夏季长江口北部(上)和南部(下)温度、盐度和溶解氧剖面[12]
Figure 2. Summer vertical profiles of temperature, salinity and DO of transects in north(upper) and south(lower) of Yangtze Estuary
![]()
图 3 不同程度低氧对生态系统能量流动的影响[39]
(流向捕食者的能量:指初级生产者流向下一级的能量中被转化为捕食者的能量的比例; 流向微生物的能量同理)
Figure 3. How hypoxia alters ecosystem energy flow
![]()
图 4 世界低氧区和富营养化海域的分布
Figure 4. World hypoxic and eutrophication coastal area
(Diaz R, Selman M, 2010, http://www.wri.org/resource/world-hypoxic-and-eutrophic-coastal-areas)
表 2 世界典型低氧区及其特征
Table 2 Typical hypoxic areas around the world
位置 国家 影响 类型 低氧面积/km2(年份) 参考文献 东京湾 日本 底栖生物死亡 不定期型 683(2006) [42] 维尼亚湾 美国 - 间歇型 29(2007) [39] 卡特加特海峡 瑞士等 底栖生物经历了长的恢复期 季节型 3850(1992) [39] 东海(长江口) 中国 - 季节型 15400(2006) [7] 墨西哥湾 美国 - 季节型 20000(2007) [43] 黑海低氧区 黑海 底栖生物死亡但每年恢复 季节型 40000(2006) [39] 亚述海 俄罗斯等 底栖生物减少,生产力下降 持续型 8560(2008) [39] 波罗的海 - - 持续型 67700 (2006) [41] 孟加拉湾 印度等 - - 1600000(2009) [44] 阿拉伯海 印度等 - - 250000(2009) [44]  下载: 导出CSV
-
[1] Diaz R J. Overview of hypoxia around the world[J]. Journal of Environmental Quality, 2001, 30(2):275. doi: 10.2134/jeq2001.302275x
[2] Chen C C, Gong G C, Shiah F K. Hypoxia in the East China Sea: One of the largest coastal low-oxygen areas in the world[J]. Marine Environmental Research, 2007, 64(4):399-408. doi: 10.1016/j.marenvres.2007.01.007
[3] 刘志国, 徐韧, 刘材材, 等.长江口外低氧区特征及其影响研究[J].海洋通报, 2012, 31(5):588-593. http://d.old.wanfangdata.com.cn/Periodical/hytb201205015 LIU Zhiguo, XU Ren, LIU Caicai, et al. Characters of hypoxia area off the Yangtze River Estuary and its influence[J]. Marine Science Bulletin, 2012, 31(5):588-593. http://d.old.wanfangdata.com.cn/Periodical/hytb201205015
[4] 韦钦胜, 于志刚, 夏长水, 等.夏季长江口外低氧区的动态特征分析[J].海洋学报, 2011, 33(6):100-109. http://d.old.wanfangdata.com.cn/Periodical/hyxb201106012 WEI Qinsheng, YU Zhigang, XIA Changshui, et al. A preliminary analysis on the dynamic characteristics of the hypoxic zone adjacent to the Changjiang Estuary in summer[J]. Acta Oceanologica Sinica, 2011, 33(6):100-109. http://d.old.wanfangdata.com.cn/Periodical/hyxb201106012
[5] Chen C C, Gong G C, Shiah F K. Hypoxia in the East China Sea: one of the largest coastal low-oxygen areas in the world[J]. Marine Environmental Research, 2007, 64(4):399-408. doi: 10.1016/j.marenvres.2007.01.007
[6] Wei H, He Y, Li Q, et al. Summer hypoxia adjacent to the Changjiang Estuary[J]. Journal of Marine Systems, 2007, 67(3):292-303. https://www.sciencedirect.com/science/article/pii/S092479630600234X
[7] 张莹莹, 张经, 吴莹, 等.长江口溶解氧的分布特征及影响因素研究[J].环境科学, 2007, 28(8):1649-1654. doi: 10.3321/j.issn:0250-3301.2007.08.001 ZHANG Yingying, ZHANG Jing, WU Ying, et al. Characteristics of Dissolved Oxygen and Its Affecting Factors in the Yangtze Estuary[J]. Chinese Journal of Environmental Science, 2007, 28(8):1649-1654. doi: 10.3321/j.issn:0250-3301.2007.08.001
[8] Chi L, Song X, Yuan Y, et al. Distribution and key influential factors of dissolved oxygen off the Changjiang River Estuary (CRE) and its adjacent waters in China[J]. Marine Pollution Bulletin, 2017, in press. https://www.ncbi.nlm.nih.gov/pubmed/29029983
[9] Chen N, Bianchi T S, Mckee B A, et al. Historical trends of hypoxia on the Louisiana shelf: application of pigments as biomarkers[J]. Organic Geochemistry, 2001, 32(4):543-561. doi: 10.1016/S0146-6380(00)00194-7
[10] Rabalais N N, Atilla N, Normandeau C, et al. Ecosystem history of Mississippi river-influenced continental shelf revealed through preserved phytoplankton pigments[J]. Marine Pollution Bulletin, 2004, 49(7-8):537-547. doi: 10.1016/j.marpolbul.2004.03.017
[11] Raymond P A, Bauer J E. Use of 14C and 13C natural abundances for evaluating riverine, estuarine, and coastal DOC and POC sources and cycling: a review and synthesis[J]. Organic Geochemistry, 2001, 32(4):469-485. doi: 10.1016/S0146-6380(00)00190-X
[12] Zhang J, Wu Y, Jennerjahn T C, et al. Distribution of organic matter in the Changjiang (Yangtze River) Estuary and their stable carbon and nitrogen isotopic ratios: Implications for source discrimination and sedimentary dynamics[J]. Marine Chemistry, 2007, 106(1):111-126. https://www.sciencedirect.com/science/article/pii/S0304420307000515
[13] Cearreta A, Irabien M J, Leorri E, et al. Recent anthropogenic impacts on the Bilbao Estuary, Northern Spain: Geochemical and microfaunal evidence[J]. Estuarine Coastal & Shelf Science, 2000, 50(4):571-592. https://www.sciencedirect.com/science/article/pii/S0272771499905826
[14] 柴小平, 胡宝兰, 魏娜, 等.杭州湾及邻近海域表层沉积物重金属的分布、来源及评价[J].环境科学学报, 2015, 35(12):3906-3916. http://d.old.wanfangdata.com.cn/Periodical/hjkxxb201512016 CHAI Xiaoping, HU Baolan, WEI Na, et al. Distribution, sources and assessment of heavy metals in surface sediments of the Hangzhou Bay and its adjacent areas[J]. Acta Scientiae Circumstantiae, 2015, 35(12):3906-3916. http://d.old.wanfangdata.com.cn/Periodical/hjkxxb201512016
[15] Banks J L, Ross D J, Keough M J, et al. Measuring hypoxia induced metal release from highly contaminated estuarine sediments during a 40 day laboratory incubation experiment[J]. Science of the Total Environment, 2012, 420(6):229-237. http://www.wanfangdata.com.cn/details/detail.do?_type=perio&id=70189b639714cf11384da8f1739518fd
[16] Li L, Ren J L, Yan Z, et al. Behavior of arsenic in the coastal area of the Changjiang (Yangtze River) Estuary: Influences of water mass mixing, the spring bloom and hypoxia[J]. Continental Shelf Research, 2014, 80(2):67-78. https://www.sciencedirect.com/science/article/pii/S0278434314000855
[17] Vegasvilarrúbia T, Corella J P, Pérezzanón N, et al. Historical shifts in oxygenation regime as recorded in the laminated sediments of lake Montcortès (Central Pyrenees) support hypoxia as a continental-scale phenomenon[J]. Science of the Total Environment, 2017, 612:1577-1592. http://www.wanfangdata.com.cn/details/detail.do?_type=perio&id=2944d9da0d6c9ddd4e453d9ce89a9178
[18] Zhao J, Feng X, Shi X, et al. Sedimentary organic and inorganic records of eutrophication and hypoxia in and off the Changjiang Estuary over the last century[J]. Marine Pollution Bulletin, 2015, 99(1-2):76-84. doi: 10.1016/j.marpolbul.2015.07.060
[19] 马永存, 徐韧, 何培民, 等.长江口低氧区及邻近海域浮游植物群落初步研究[J].上海海洋大学学报, 2013, 22(6):903-911. http://d.old.wanfangdata.com.cn/Periodical/shscdxxb201306016 MA Yongcun, XU Ren, HE Peimin, et al. Preliminary study on phytoplankton community of Yangtze River estuary hypoxia area and the adjacent East China Sea[J]. Journal of Shanghai University, 2013, 22(6):903-911. http://d.old.wanfangdata.com.cn/Periodical/shscdxxb201306016
[20] Sonthiphand P, Cejudo E, Schiff S L, et al. Wastewater effluent impacts ammonia-oxidizing prokaryotes of the Grand River, Canada[J]. Applied & Environmental Microbiology, 2013, 79(23):7454. http://www.wanfangdata.com.cn/details/detail.do?_type=perio&id=3974b4f0b6a9f30a0980d8fc2aeaa718
[21] Platon E, Gupta B K S, Rabalais N N, et al. Effect of seasonal hypoxia on the benthic foraminiferal community of the Louisiana inner continental shelf: The 20th century record[J]. Marine Micropaleontology, 2005, 54(3-4):263-283. doi: 10.1016/j.marmicro.2004.12.004
[22] Osterman L E, Poore R Z, Swarzenski P W. The last 1000 years of natural and anthropogenic low-oxygen bottom-water on the Louisiana shelf, Gulf of Mexico[J]. Marine Micropaleontology, 2008, 66(3):291-303. https://www.sciencedirect.com/science/article/pii/S0377839807001120
[23] Chen N, Bianchi T S, Mckee B A, et al. Historical trends of hypoxia on the Louisiana shelf: application of pigments as biomarkers[J]. Organic Geochemistry, 2001, 32(4):543-561. doi: 10.1016/S0146-6380(00)00194-7
[24] Li X, Bianchi T S, Yang Z, et al. Historical trends of hypoxia in Changjiang River estuary: Applications of chemical biomarkers and microfossils[J]. Journal of Marine Systems, 2011, 86(3-4):57-68. doi: 10.1016/j.jmarsys.2011.02.003
[25] Wang B, Wei Q, Chen J, et al. Annual cycle of hypoxia off the Changjiang (Yangtze River) Estuary[J]. Marine Environmental Research, 2012, 77(10):1-5. http://www.wanfangdata.com.cn/details/detail.do?_type=perio&id=afa3550b642e4bd974ffc2ea5bf9797d
[26] 暨卫东.中国近海海洋.海洋化学[M].海洋出版社, 2012. JI Weidong. Offshore ocean of China. Marine Chemistry[M]. China Ocean Press, 2012.
[27] Wang B. Hydromorphological mechanisms leading to hypoxia off the Changjiang estuary[J]. Marine Environmental Research, 2009, 67(1):53. doi: 10.1016/j.marenvres.2008.11.001
[28] 张竹琦.黄海和东海北部夏季底层溶解氧最大值和最小值特征分析[J].海洋通报, 1990(4):22-26. http://www.cnki.com.cn/Article/CJFDTotal-HUTB199004004.htm ZHANG Zhuqi. On maxium and minmum dissolved oxygen with bottom layer in Yellow Sea and northern East China Sea in summer[J] Marine Science bulletin, 1990(4):22-26. http://www.cnki.com.cn/Article/CJFDTotal-HUTB199004004.htm
[29] Li D, Wu Y, Zhang J, et al. Oxygen depletion off the Changjiang (Yangtze River) Estuary[J]. Science in China(Series D:Earth Sciences), 2002(12):1137-1146. doi: 10.1360-02yd9110/
[30] Chi L, Song X, Yuan Y, et al. Distribution and key influential factors of dissolved oxygen off the Changjiang River Estuary (CRE) and its adjacent waters in China[J]. Marine Pollution Bulletin, 2017, 125(1-2). http://www.wanfangdata.com.cn/details/detail.do?_type=perio&id=adaf8760b9dc666f485ca3b7ddef8a99
[31] 赵保仁, 任广法, 曹德明, 等.长江口上升流海区的生态环境特征[J].海洋与湖沼, 2001, 32(3):327-333. doi: 10.3321/j.issn:0029-814X.2001.03.014 ZHAO Baoren, REN Guangfa, CAO Deming, et al. Characteristics of the ecological environmental in upwelling area adjacent to the Changjiang river esturary. Oceanologia et Limnologia Sinica, 2001, 32(3):327-333.] doi: 10.3321/j.issn:0029-814X.2001.03.014
[32] 蔡榕硕, 陈际龙, 黄荣辉.我国近海和邻近海的海洋环境对最近全球气候变化的响应[J].大气科学, 2006, 30(5):1019-1033. doi: 10.3878/j.issn.1006-9895.2006.05.28 CAI Rongshuo, CHEN Jilong, HUANG Ronghui. The response of marine environment in the offshore area of China and its adjacent ocean to recent global climate change[J]. Chinese Journal of Atmospheric Sciences, 2006, 30(5):1019-1033. doi: 10.3878/j.issn.1006-9895.2006.05.28
[33] Hu B, Shen L, Ping D, et al. The influence of intense chemical pollution on the community composition, diversity and abundance of anammox bacteria in the Jiaojiang Estuary (China)[J]. Plos One, 2012, 7(3):e33826. https://www.ncbi.nlm.nih.gov/pubmed/22470481
[34] Liu S, Ren H, Shen L, et al. pH levels drive bacterial community structure in sediments of the Qiantang River as determined by 454 pyrosequencing[J]. Front Microbiol, 2015, 6:285. https://www.ncbi.nlm.nih.gov/pubmed/25941515
[35] Hu B L, Shen L D, Zheng P, et al. Distribution and diversity of anaerobic ammonium-oxidizing bacteria in the sediments of the Qiantang River[J]. Environ Microbiol Rep, 2012, 4(5):540-547. doi: 10.1111/j.1758-2229.2012.00360.x
[36] Li-Dong S, Qun Z, Shuai L, et al. Molecular evidence for nitrite-dependent anaerobic methane-oxidising bacteria in the Jiaojiang Estuary of the East Sea (China)[J]. Applied Microbiology & Biotechnology, 2014, 98(11):5029-5038. http://www.wanfangdata.com.cn/details/detail.do?_type=perio&id=c87beed6f80eb343068a609ce431aad0
[37] 杜萍, 刘晶晶, 曾江宁, 等.长江口低氧区异养细菌及氮磷细菌分布[J].应用生态学报, 2011, 22(5):1316-1324. http://d.old.wanfangdata.com.cn/Periodical/yystxb201105032 DU Ping, LIU Jingjing, ZENG Jiangning, et al. Spatial distribution patterns of heterotrophic, nitrogen, and phosphate bacteria in hypoxic zone of Yangtze River Estuary[J]. Chinese Journal of Applied Ecology, 2011, 22(5):1316-1324. http://d.old.wanfangdata.com.cn/Periodical/yystxb201105032
[38] Duce R A, Laroche J, Altieri K, et al. Impacts of atmospheric anthropogenic nitrogen on the open ocean[J]. Science, 2008, 320(5878):893. doi: 10.1126/science.1150369
[39] Diaz R J, Rosenberg R. Spreading dead zones and consequences for marine ecosystems[J]. Science, 2008, 321(5891):926. doi: 10.1126/science.1156401
[40] Elmgren R. Man's impact on the ecosystem of the baltic sea: Energy flows today and at the turn of the century[J]. Ambio, 1989, 18(6):326-332. https://www.jstor.org/stable/4313603
[41] Conley D J, Björck S, Bonsdorff E, et al. Hypoxia-related processes in the Baltic Sea[J]. Environmental Science & Technology, 2009, 43(10):3412. http://www.wanfangdata.com.cn/details/detail.do?_type=perio&id=5d7e89936d3667c0791476c2a34778c5
[42] Nakayama K, Sivapalan M, Sato C, et al. Stochastic characterization of the onset of and recovery from hypoxia in Tokyo Bay, Japan: derived distribution analysis based on "strong wind" events.[J]. Water Resources Research, 2010, 46(12). https://www.researchgate.net/publication/241060429_Stochastic_characterization_of_the_onset_of_and_recovery_from_hypoxia_in_Tokyo_Bay_Japan_Derived_distribution_analysis_based_on_strong_wind_events?ev=auth_pub
[43] Turner R E, Rabalais N N, Justic D. Gulf of Mexico hypoxia: alternate states and a legacy[J]. Environmental Science & Technology, 2008, 42(7):2323. http://med.wanfangdata.com.cn/Paper/Detail/PeriodicalPaper_PM18504960
[44] Paulmier A, RuizPino D. Oxygen minimum zones (OMZs) in the modern ocean[J]. Progress in Oceanography, 2009, 80(3-4):113-128. doi: 10.1016/j.pocean.2008.08.001
[45] Larson R L, Erba E. Onset of the Mid-Cretaceous greenhouse in the Barremian-Aptian: Igneous events and the biological, sedimentary, and geochemical responses[J]. Paleoceanography, 1999, 14(6):663-678. doi: 10.1029/1999PA900040
[46] 黄永建, 王成善, 顾健.白垩纪大洋缺氧事件:研究进展与未来展望[J].地质学报, 2008, 82(1):21-30. doi: 10.3321/j.issn:0001-5717.2008.01.003 HUANG Yongjian, WANG Chengshan, GU Jian. Cretaceous oceanic anoxic events: Research progress and forthcoming prospects[J]. Acta Geologica Sinica, 2008, 82(1):21-30. doi: 10.3321/j.issn:0001-5717.2008.01.003
[47] Zhu Z Y, Wu H, Liu S M, et al. Hypoxia off the Changjiang (Yangtze River) estuary and in the adjacent East China Sea: Quantitative approaches to estimating the tidal impact and nutrient regeneration[J]. Marine Pollution Bulletin, 2017, DOI: 10.1016/j.marpolbul.2017.07.029.
![图 1 夏季长江口溶解氧(mg/L)分布[26]](/fileHYDZYDSJDZ/journal/article/hydzydsjdz/2018/1/hydzydsjdz-38-1-187-1.jpg)
![图 2 夏季长江口北部(上)和南部(下)温度、盐度和溶解氧剖面[12]](/fileHYDZYDSJDZ/journal/article/hydzydsjdz/2018/1/hydzydsjdz-38-1-187-2.jpg)
![图 3 不同程度低氧对生态系统能量流动的影响[39]](/fileHYDZYDSJDZ/journal/article/hydzydsjdz/2018/1/hydzydsjdz-38-1-187-3.jpg)