Chemical and sulfur isotopic compositions of anhydrite from the Tangyin hydrothermal field in the Okinawa Trough
-
摘要: 硬石膏是最早构成热液烟囱体壁的矿物之一,其对于了解流体-海水混合以及海底热液系统中元素的迁移与循环具有重要的意义。为此,对西太平洋冲绳海槽唐印热液区中的硬石膏,进行了微区原位元素以及硫同位素组成分析。根据硬石膏的结晶形态,可以将硬石膏分为两种类型:较早形成的I型硬石膏,其呈半自形或他形晶,似针状、放射状及不规则晶的集合体产出;较晚形成的II型硬石膏,其呈自形晶,以板状及粒状晶的集合体产出。当热液流体初次遇到海水时,将快速沉淀形成I型硬石膏,并构成了热液烟囱体的壁。随后,II型硬石膏经历了一个相对充分的生长阶段。同时,硬石膏中的Ba、Al、Sr、Ni、Fe、Mn和Cr含量明显高于海水,表明产生硬石膏沉淀的热液流体来自于海底面以下,是经历了流体-岩石和/或沉积物相互作用的流体。硬石膏的Mg含量明显分别低于海水和高于喷口流体,表明其是流体-海水混合的结果。I型硬石膏,其Sr含量明显低于II型硬石膏,表明在形成自形、板片状或粒状硬石膏的期间,来自热液流体的Sr,主要进入II型硬石膏中。硬石膏的Fe、As、Sr、Ba和Pb含量,明显高于冲绳海槽喷口流体的,则表明这些来自流体中的元素更容易随着硬石膏的沉淀而进入硬石膏中,并导致硬石膏富集该类元素。硬石膏的稀土元素组成及其配分模式,具正Ce和负Eu异常的特征,其是流体在海底面以下从火山岩和/或沉积物中淋滤出来,并经历了流体-海水混合作用的结果。此外,在流体-海水混合期间,硬石膏中的硫主要来自海水。
-
关键词:
- 硬石膏 /
- 化学及其硫同位素组成 /
- 热液烟囱体 /
- 喷口流体 /
- 唐印热液区
Abstract: Anhydrite is one of the earliest minerals in forming the hydrothermal chimney walls, which is important for understanding the fluid-seawater mixing, and elemental migration and cycling in the seafloor hydrothermal system. Anhydrite minerals samples from the Tangyin hydrothermal field in the southwestern Okinawa Trough, western Pacific were investigated on the in-situ element concentrations and sulfur (S) isotopic compositions. The crystal morphology of anhydrite could be divided into two types. Type I anhydrite formed earlier is subhedral or anhedral and occurred in radial or irregular crystal aggregation, and Type II anhydrite formed later is euhedral and occurred in plate or granular crystal aggregation. When the hydrothermal fluid first met with seawater, Type I anhydrite precipitated rapidly and formed the wall of the hydrothermal chimney. Subsequently, Type II anhydrite experienced relatively longer growth stage. However, the Ba, Al, Sr, Ni, Fe, Mn, and Cr contents of anhydrite are significantly higher than that of seawater, suggesting that those elements are derived mainly from hydrothermal fluid duo to the subseafloor fluid-rock and/or sediment interactions. The Mg content of anhydrite is significantly lower / higher than that of seawater / vent fluids, which was resulted from the fluid-seawater mixing. Most of the Sr contents of Type I anhydrite are significantly lower than that of Type II anhydrite, suggesting that more Sr from fluids were involved into Type II anhydrite and formed euhedral, plate, or granular minerals. The Fe, As, Sr, Ba, and Pb contents of anhydrite are significantly higher than that of vent fluids in the Okinawa Trough, which indicates that these elements enter preferentially anhydrite from the fluids, and resulted in the enrichment of these elements in the anhydrite. REEs of anhydrite and their REE patterns show positive Ce and negative Eu anomalies, which could be resulted from fluids leaching out from local sub-seafloor volcanic rocks and/or sediments and having undergone fluid-seawater mixing. Furthermore, S in the anhydrite was mainly from seawater during fluid-seawater mixing. -
目前,我们已对海底热液产物中的硫化物[1-7]、硫酸盐[8-9]、流体[10]、热液柱[11-12]、含金属沉积物[13]、蚀变产物[14-18]以及喷口生物[19]进行了研究。期间,明确了海底热液区及其邻域的岩浆[20-24]、沉积、构造及其板块俯冲背景,这对了解海底热液系统的构造演化、成矿作用、流体-岩石相互作用、沉积过程以及生物的响应、记录、作用和适应至关重要[25]。
众所周知,海底热液喷口从最初以硬石膏为主的堆积体[26-27]开始形成丘状体或烟囱体的过程,其受制于海底面以下的深部流体过程[28]。例如,在TAG热液丘状体上实施的大洋钻探已揭示由于丘状体中冷海水与热液流体的混合致使丘状体表面以下存在广泛分布的硬石膏[29]。不管怎样,当海水被注入高温(350℃)流体时,其被加热而使CaSO4处于过饱和状态,进而开始了热液烟囱体的生长[30],即随着流体中硬石膏的沉淀,将使以含孔隙硬石膏壳作为壁的初始烟囱体向上生长[26, 31]。该烟囱体壁的壳,随着硬石膏和其他矿物的进一步沉淀而被硬化,并逐渐使烟囱体壁内部的热液流体与壁外的海水分隔,同时横穿烟囱体壁构成了明显的物理-化学梯度[30],进而预示着开启了烟囱体发育的第二阶段[30]。当硬石膏持续在生长的烟囱体外壁堆积时,热液流体将通过烟囱体壁向外迁移,溶解硬石膏并用硫化物矿物置换硬石膏[30]。同时,高温流体将在烟囱体内产生富Cu-Fe硫化物矿物的沉淀[30]。烟囱体可以这种方式生长高达几米,并在喷口附近堆积新的硬石膏,随后其被硫化物充填或置换[30]。除了硬石膏之外,重晶石或闪锌矿也可以直接沉淀构成早期烟囱体壁的外壳[32]。上述两种情况,后续过程基本相同[30],即早期的烟囱体壁被向外运移的流体沉淀了硫化物而替换和密封[30]。
尽管硬石膏的矿物特征和化学组成可以为了解流体-海水混合过程提供重要的信息,且研究海底热液硫化物堆积体中硬石膏的元素和同位素组成,也是了解海底热液系统中元素的富集、来源、迁移、沉淀及其循环时物理化学条件的一个重要途径,但是由于其在低温环境下溶解,且在硫化物烟囱体或丘状体中是次要矿物,致使我们对于海底热液系统中硬石膏的化学组成依然知之甚少。为此,在冲绳海槽唐印热液区(图1),本文将首次进行硬石膏的原位主量、微量元素以及硫同位素组成分析,目标是了解硬石膏的元素富集机制,硬石膏的同位素组成变化,以及硬石膏沉淀过程中元素的迁移、循环与热液流体和海水硫的贡献。
![]() 图 1 冲绳海槽唐印热液区中硬石膏样品的位置红矩形是热液区的位置,红星是硬石膏采样位置。Figure 1. Location of anhydrite samples from the Tangyin hydrothermal field in the Okinawa TroughThe red rectangle is the location of the hydrothermal field, the red star is the sampling location of anhydrite.
图 1 冲绳海槽唐印热液区中硬石膏样品的位置红矩形是热液区的位置,红星是硬石膏采样位置。Figure 1. Location of anhydrite samples from the Tangyin hydrothermal field in the Okinawa TroughThe red rectangle is the location of the hydrothermal field, the red star is the sampling location of anhydrite.1. 地质背景
冲绳海槽已裂开,正处于弧后扩张的阶段,盆地内的各种沉积物和脆性地壳岩石中正断裂发育[33],岩浆侵入频繁[23, 34-43],且遭受了板块俯冲的影响[24, 44-46]。根据冲绳海槽火山岩中第四纪锆石的年代学研究,可知该海槽从100 ka以来存在持续的岩浆活动[47]。
从冲绳海槽的中段到南段,其地形变化明显,伴随着雁列式槽内地堑的分布,槽底的水深逐渐增加,陆坡一侧逐渐变陡[48-49]。从冲绳海槽的北段到南段,其构造及地球物理特性也不同,南段具变化的重力和线性磁异常,中段的热流值最大,地壳厚度向南变薄。冲绳海槽的地壳属过渡性地壳,且中段和南段地堑中出露了洋壳物质[50]。上述地质环境,为冲绳海槽发育海底热液系统创造了有利条件[49-52]。
截止到2021年,InterRidge喷口数据库以及刊出文献的记录表明,在冲绳海槽中至少存在着15处海底热液区,包括Minami-Ensei[53],Iheya North[54-57],Jade[58-61],Hakurei[62],Irabu Knoll[63-64],Hatoma[65],Yonaguni Knoll IV[9, 51, 66-68],唐印[51],Noho[7],龟山岛[10, 69-73]热液区。不仅如此,在冲绳海槽的海底热液区,有关的火山岩、沉积物、活动的热液喷口、热液柱、烟囱体、块状硫化物以及热液区生物等,均已被研究报道[9, 23-24, 51, 72-73]。
在2014年的HOBAB 3航次中,通过3天的调查,我们发现了位于雨花海丘峰顶的唐印热液区(图1,25°4′N、122°34′E, 水深1206 m)。其中,雨花海丘由两个独立的高峰构成,高约220 m,东西宽约1.5 km,其由长英质火山岩组成,局部覆盖着沉积物,东侧邻近一条海底峡谷(图1),其中的唐印热液区,包括流体活动的热液喷口、烟囱体、块状硫化物和繁盛的生物[51],且唐印热液系统的构造背景、岩浆活动、成矿作用、流体-岩石相互作用和沉积过程,与生物的响应、适应、记录和作用之间存在着耦合关系,了解海底热液区的岩浆、流体、岩石、沉积、海水和生物的协同成矿机制已成为一项重要、有趣的工作。
2. 样品与方法
2.1 样品与扫描电镜分析
2016年,使用“科学”号考察船,实施HOBAB4航次调查期间,在冲绳海槽唐印热液区(图1)的海底热液硫化物堆积体上采集到硬石膏样品(样品R11-H2)。
选择来自海底热液硫化物堆积体的硬石膏样品,磨制薄片,然后进行镜下观察、主量元素含量、微量元素含量和硫同位素组成分析。在中国科学院海洋研究所使用透射偏光显微镜揭示了硬石膏的形态及结构特征(图2)。使用TESCAN VEGA 3 LMH扫描电子显微镜(scanning electron microscope, SEM)及其背散射电子图像(back-scattered electron, BSE)(图3)和Oxford Instruments INCA X-Max能谱仪(energy dispersive spectrometer, EDS)进行了矿物化学成分面扫描分析(图4)。SEM的分析条件包括:加速电压20 kV,束流强度15 nA,工作距离约15 mm。其中,EDS测试及计算过程中使用的标准物质是硬石膏(Ca, S, O)、顽火辉石(Mg,Si),其Ca,S,O,Mg和Si的检测限分别为0.1%。
![]() 图 2 冲绳海槽唐印热液区中硬石膏样品的手标本(a)、单偏光(b)和正交偏光(c,d)显微镜下照片Anh:硬石膏。Figure 2. Hand specimens of anhydrite samples from the Tangyin hydrothermal field in the Okinawa Trough (a) and images of microscope under single polarized light (b) and orthogonal polarized light (c, d)Anh: anhydrite.
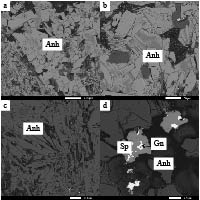
图 2 冲绳海槽唐印热液区中硬石膏样品的手标本(a)、单偏光(b)和正交偏光(c,d)显微镜下照片Anh:硬石膏。Figure 2. Hand specimens of anhydrite samples from the Tangyin hydrothermal field in the Okinawa Trough (a) and images of microscope under single polarized light (b) and orthogonal polarized light (c, d)Anh: anhydrite.![]() 图 3 冲绳海槽唐印热液区中硬石膏(a,b,c)与硫化物(d)的扫描电镜背散射电子图像Anh: 硬石膏, Sp: 闪锌矿, Gn: 方铅矿。Figure 3. Scanning electron microscope back-scattered electron images of anhydrite (a, b, c) and sulfide (d) from the Tangyin hydrothermal field in the Okinawa TroughAnh: anhydrite; Sp: sphalerite; Gn: galena.
图 3 冲绳海槽唐印热液区中硬石膏(a,b,c)与硫化物(d)的扫描电镜背散射电子图像Anh: 硬石膏, Sp: 闪锌矿, Gn: 方铅矿。Figure 3. Scanning electron microscope back-scattered electron images of anhydrite (a, b, c) and sulfide (d) from the Tangyin hydrothermal field in the Okinawa TroughAnh: anhydrite; Sp: sphalerite; Gn: galena.![]() 图 4 冲绳海槽唐印热液区中硬石膏与硅质物的扫描电镜能谱面扫描图像Anh:硬石膏; Si: 硅质物; Ca, S, Si, Mg, O分别是钙,硫,硅,镁,氧元素的面扫描图像。Figure 4. Scanning electron microscope energy dispersive scanning images of anhydrite and amorphous silica from the Tangyin hydrothermal field in the Okinawa TroughAnh: anhydrite; Si: silica material; Ca, S, Si, Mg, and O are energy dispersive scanning images of calcium, sulphur, silicon, magnesium, and oxygen elements, respectively.
图 4 冲绳海槽唐印热液区中硬石膏与硅质物的扫描电镜能谱面扫描图像Anh:硬石膏; Si: 硅质物; Ca, S, Si, Mg, O分别是钙,硫,硅,镁,氧元素的面扫描图像。Figure 4. Scanning electron microscope energy dispersive scanning images of anhydrite and amorphous silica from the Tangyin hydrothermal field in the Okinawa TroughAnh: anhydrite; Si: silica material; Ca, S, Si, Mg, and O are energy dispersive scanning images of calcium, sulphur, silicon, magnesium, and oxygen elements, respectively.2.2 原位主量元素分析
在西北大学的大陆动力学国家重点实验室,使用JXA-8230电子探针(electron probe microanalyzer, EPMA)分析了硬石膏中主量元素的含量。EPMA分析的工作条件:加速电压15 kV,束流10 nA,束流直径2 μm。EPMA分析及计算过程中使用的参考物质:重晶石(用于Ba和S),正长石(用于K),透辉石(用于Ca, Mg和Si),橄榄石(用于Mg),硬玉(用于Na, Al),蔷薇辉石(用于Mn),金红石(用于Ti),氧化锶(用于Sr),铁铝榴石(用于Fe),纯金属(用于Ni和Cr)。EPMA分析硬石膏中主量元素含量的精度好于1%。分析结果见表1。
表 1 唐印热液区样品R11-H2中硬石膏的电子探针分析结果和化学式Table 1. Electron microprobe analyses of the anhydrite in sample R11-H2 from the Tangyin hydrothermal field and their atoms per formula unit for elements% 类型 测试点 K2O SO3 CaO BaO TiO2 Na2O Al2O3 SrO MgO SiO2 NiO FeO MnO Cr2O3 总计 化学式 类型I 6-6 n.d. 58.02 41.95 0.09 n.d. 0.02 n.d. 0.14 0.02 n.d. n.d. 0.03 n.d. 0.03 100.29 Ca1.58S0.71O3.71 6-8 n.d. 57.45 41.03 0.11 n.d. n.d. n.d. 0.11 0.86 0.74 n.d. n.d. n.d. n.d. 100.31 Ca1.55Mg0.02Si0.01S0.71O3.71 6-10 n.d. 56.84 42.68 n.d. n.d. 0.03 n.d. 0.19 0.04 n.d. n.d. n.d. n.d. 0.03 99.81 Ca1.60S0.70O3.70 6-11 n.d. 55.64 44.29 n.d. n.d. 0.06 n.d. 0.19 0.16 n.d. n.d. n.d. n.d. 0.08 100.43 Ca1.65S0.67O3.67 6-12 n.d. 55.43 45.47 0.06 n.d. 0.03 0.02 0.15 0.07 n.d. 0.04 n.d. n.d. n.d. 101.26 Ca1.67S0.66O3.66 6-13 n.d. 56.29 42.67 n.d. 0.04 0.06 n.d. 0.22 0.19 n.d. n.d. n.d. n.d. 0.07 99.53 Ca1.61S0.69O3.69 6-15 n.d. 57.19 42.29 n.d. n.d. 0.08 n.d. 0.20 0.04 n.d. n.d. n.d. n.d. n.d. 99.80 Ca1.59S0.70O3.70 6-16 n.d. 56.28 42.27 n.d. 0.05 0.05 n.d. 0.14 0.07 n.d. 0.04 0.10 n.d. n.d. 99.00 Ca1.60S0.70O3.69 6-17 n.d. 57.25 42.76 n.d. n.d. 0.02 n.d. 0.19 0.03 n.d. n.d. n.d. 0.05 n.d. 100.29 Ca1.60S0.70O3.70 6-24 n.d. 57.74 42.59 n.d. n.d. n.d. n.d. 0.18 0.03 n.d. n.d. 0.03 0.04 n.d. 100.59 Ca1.59S0.70O3.70 类型II 4-1-1 n.d. 56.72 43.84 n.d. n.d. 0.07 0.02 0.31 n.d. n.d. n.d. n.d. n.d. 0.09 101.05 Ca1.62S0.68O3.68 4-1-2 n.d. 58.23 42.41 n.d. n.d. 0.05 n.d. 0.29 0.02 n.d. n.d. 0.04 n.d. n.d. 101.03 Ca1.58S0.71O3.71 4-1-3 n.d. 56.38 42.89 0.08 n.d. 0.04 n.d. 0.62 0.02 n.d. n.d. n.d. n.d. 0.04 100.07 Ca1.61Sr0.01S0.69O3.69 4-1-4 n.d. 57.63 42.96 n.d. n.d. 0.02 n.d. 0.22 n.d. n.d. n.d. n.d. n.d. 0.05 100.89 Ca1.60S0.70O3.70 4-1-5 n.d. 57.31 44.11 0.07 n.d. n.d. n.d. 0.19 0.06 n.d. n.d. n.d. n.d. n.d. 101.73 Ca1.62S0.69O3.69 4-1-6 n.d. 58.12 42.71 n.d. n.d. n.d. 0.04 0.20 0.04 n.d. n.d. n.d. n.d. n.d. 101.10 Ca1.59S0.70O3.70 4-1-7 n.d. 57.87 42.18 n.d. n.d. 0.03 n.d. 0.28 0.06 n.d. 0.04 n.d. 0.05 n.d. 100.50 Ca1.58S0.71O3.71 6-1-1 n.d. 58.17 41.78 n.d. n.d. 0.04 n.d. 0.25 n.d. n.d. n.d. n.d. n.d. n.d. 100.23 Ca1.57S0.71O3.71 4-14 n.d. 58.92 42.00 0.08 n.d. n.d. 0.02 0.52 0.07 n.d. n.d. 0.03 n.d. n.d. 101.64 Ca1.56S0.71O3.71 4-16 n.d. 57.92 43.33 n.d. n.d. 0.03 n.d. 0.28 0.04 n.d. 0.07 0.03 0.05 n.d. 101.75 Ca1.60S0.70O3.70 4-17 n.d. 56.52 42.94 n.d. n.d. 0.03 0.02 0.23 n.d. n.d. n.d. 0.04 n.d. n.d. 99.78 Ca1.61S0.69O3.69 4-18 n.d. 56.70 44.63 0.07 n.d. 0.02 n.d. 0.24 0.08 n.d. n.d. 0.03 0.04 0.05 101.85 Ca1.64S0.68O3.68 检测限 K2O SO3 CaO BaO TiO2 Na2O Al2O3 SrO MgO SiO2 NiO FeO MnO Cr2O3 0.02 0.03 0.02 0.05 0.03 0.02 0.02 0.03 0.01 0.03 0.03 0.03 0.03 0.03 注:n.d表示无数据。 2.3 原位微量元素分析
在中国地质大学(武汉)生物地质与环境地质国家重点实验室,使用激光剥蚀电感耦合等离子质谱仪(laser ablation inductively coupled plasma mass spectrometry,LA-ICP-MS),分析了硬石膏中微量元素的含量。采用GeoLas-Pro 193 nm 氟化氩(argon fluoride,ArF)准分子激光系统(工作条件:激光能量80 mJ,频率6 Hz,束斑直径44 μm)进行剥蚀采样。经过剥蚀采集的样品,在进入ICP-MS仪器前,使用T形接头,将载气-氦与氩混合后,由该混合气携带样品进入ICP-MS。采用Agilent 7500 ICP-MS采集离子信号强度。每次测量,先对气体空白进行约30 s的背景数据采集,然后再对样品进行50 s的数据采集及测量。在完成测量及数据采集后,使用ICPMSDataCal软件进行微量元素含量的定量校准[74-75]。使用电子探针测量获得的Ca作为内标,结合外标SRM 610,进行硬石膏中微量元素含量的定量校准。SRM 610的测量值与推荐值接近一致(表2),大多数微量元素的分析精度好于5%(表2)。
表 2 使用LA-ICP-MS分析唐印热液区样品R11-H2中硬石膏的微量元素含量Table 2. Trace element concentrations of the anhydrite in sample R11-H2 from the Tangyin hydrothermal field determined via LA-ICP-MSμg/g 元素 4-1-1 4-1-2 4-1-3 4-1-4 4-1-5 4-1-6 4-1-7 6-1-1 最小值 最大值 平均值 检测限 SRM610平均值 SRM610参考值 RE% Sc n.d. 1.56 1.46 n.d. n.d. n.d. n.d. n.d. 1.46 1.56 1.51 0.721 441.20 441.00 0.05 Ti 66.7 30.0 84.1 33.4 4.57 12.3 34.1 164 4.57 164 53.7 0.891 439.66 434.00 1.31 V 1.55 0.837 2.44 0.501 0.199 0.424 0.509 2.40 0.199 2.44 1.11 0.134 442.09 442.00 0.02 Cr 8.06 57.9 2.36 34.7 417 2.80 16.7 11.9 2.36 417 68.9 1.797 405.81 405.00 0.20 Fe 707 551 776 160 484 n.d. 388 1760 160 1760 689 134.53 473.45 458.00 3.37 Mn 107 78.6 234 96.7 108 75.1 159 122 75.1 234 123 0.417 485.27 485.00 0.06 Co n.d. 0.218 0.217 n.d. 0.085 n.d. n.d. 0.716 0.085 0.716 0.309 0.079 405.07 405.00 0.02 Ni 2.67 0.658 2.74 n.d. 0.357 1.31 1.25 5.28 0.357 5.28 2.04 0.314 458.80 458.70 0.02 Cu 58.8 54.8 84.0 41.3 98.0 47.8 56.7 92.8 41.3 98.0 66.8 0.614 430.15 430.00 0.04 Zn 107 164 464 9.25 82.6 100 328 411 9.25 464 208 2.979 456.02 456.00 0.01 Ga 1.02 0.396 1.65 0.612 n.d. 0.160 0.261 1.81 0.160 1.81 0.843 0.115 438.07 438.00 0.02 Ge n.d. 0.987 3.73 n.d. n.d. 1.67 n.d. 1.24 0.987 3.73 1.91 0.347 426.05 426.00 0.01 As n.d. 9.25 27.0 2.55 5.85 2.68 12.6 10.3 2.55 27.0 10.0 0.991 317.06 317.00 0.02 Rb 9.61 4.17 13.6 4.09 0.607 1.69 4.44 19.5 0.607 19.5 7.22 0.101 425.77 425.70 0.02 Sr 1785 1919 1372 1661 1708 1569 1778 1580 1372 1919 1671 0.048 515.58 515.50 0.02 Y 1.22 0.341 1.67 0.455 0.108 0.237 0.448 2.66 0.108 2.66 0.893 0.016 450.10 450.00 0.02 Mo 0.137 0.050 0.087 n.d. 0.034 0.117 0.109 0.120 0.034 0.137 0.093 0.027 410.00 410.00 0.00 Ag 0.755 1.15 1.17 0.679 1.77 0.403 1.08 4.26 0.403 4.26 1.41 0.166 239.06 239.00 0.02 Cd 1.05 n.d. 0.640 0.152 0.208 0.706 0.913 1.85 0.152 1.85 0.789 0.105 259.22 259.00 0.08 In 0.020 n.d. n.d. n.d. n.d. n.d. 0.046 0.317 0.020 0.317 0.128 0.018 441.02 441.00 0.01 Sn n.d. n.d. 2.85 1.76 2.90 2.26 4.92 4.58 1.76 4.92 3.21 0.797 396.01 396.00 0.00 Sb 3.28 14.3 24.3 12.4 33.5 14.5 17.5 6.65 3.28 33.5 15.8 0.063 369.05 369.00 0.01 Ba 164 97.1 136 149 193 76.6 123 177 76.6 193 139 0.219 435.01 435.00 0.00 La 2.90 1.51 4.17 1.44 0.701 0.731 1.64 6.31 0.701 6.31 2.43 0.009 457.02 457.00 0.00 Ce 8.67 4.12 12.4 4.48 0.968 1.75 4.60 18.8 0.968 18.8 6.97 0.007 448.02 448.00 0.01 Pr 0.420 0.281 0.610 0.218 0.078 0.101 0.340 0.946 0.078 0.946 0.374 0.004 430.07 430.00 0.02 Nd 1.11 0.933 2.65 0.816 0.258 0.510 0.868 3.45 0.258 3.45 1.32 0.022 431.01 431.00 0.00 Sm n.d. 0.070 0.824 n.d. 0.076 0.114 0.310 0.591 0.070 0.824 0.331 0.009 451.16 451.00 0.04 Eu 0.091 0.019 0.068 n.d. 0.088 0.046 0.048 0.115 0.019 0.115 0.068 0.018 461.03 461.00 0.01 Gd 0.246 0.210 0.432 0.157 0.021 0.049 0.113 0.434 0.021 0.434 0.208 0.010 444.01 444.00 0.00 Tb 0.025 n.d. 0.028 0.023 0.010 n.d. 0.006 0.084 0.006 0.084 0.029 0.006 443.02 443.00 0.00 Dy 0.224 0.200 0.427 0.134 0.039 0.044 0.023 0.438 0.023 0.438 0.191 0.012 427.01 427.00 0.00 Ho 0.082 0.018 0.058 n.d. 0.010 n.d. 0.029 0.078 0.010 0.082 0.046 0.006 449.00 449.00 0.00 Er 0.104 0.025 0.135 0.105 0.018 0.051 0.063 0.183 0.018 0.183 0.085 0.016 426.04 426.00 0.01 Tm n.d. n.d. n.d. n.d. n.d. n.d. n.d. 0.040 0.040 0.040 0.040 0.035 420.02 420.00 0.00 Yb n.d. 0.077 0.191 0.081 n.d. 0.016 n.d. 0.138 0.016 0.191 0.101 0.010 445.05 445.00 0.01 Lu 0.040 n.d. 0.023 n.d. n.d. n.d. 0.021 n.d. 0.021 0.040 0.028 0.006 435.08 435.00 0.02 Au 0.036 0.066 n.d. 0.042 n.d. n.d. n.d. n.d. 0.036 0.066 0.048 0.025 23.01 23.00 0.04 Tl 0.134 0.098 0.133 n.d. n.d. n.d. 0.116 n.d. 0.098 0.134 0.121 0.086 61.01 61.00 0.02 Pb 145 318 505 136 375 278 401 340 136 505 312 0.120 426.00 426.00 0.00 Bi 0.043 n.d. 0.098 n.d. 0.010 0.021 n.d. 0.141 0.010 0.141 0.063 0.010 358.02 358.00 0.01 Th 0.657 0.291 1.01 0.332 0.045 0.101 0.301 1.23 0.045 1.23 0.496 0.011 457.21 457.20 0.00 U 0.231 0.367 0.983 0.145 0.079 0.071 0.452 0.623 0.071 0.983 0.369 0.003 461.55 461.50 0.01 ∑REEs 13.9 7.46 22.0 7.46 2.27 3.41 8.06 31.6 2.27 31.6 12.0 LREE/HREE 18.3 13.1 16.0 13.9 22.1 20.4 30.7 21.7 13.1 30.7 19.5 LaCN/LuCN 7.80 n.d. 19.8 n.d. n.d. n.d. 8.34 n.d. 7.80 19.8 12.0 (Eu/Eu*)CN 2.62 0.443 0.314 n.d. 5.08 1.62 0.638 0.661 0.314 5.08 1.62 (Ce/Ce*)CN 1.70 1.44 1.69 1.75 0.837 1.38 1.43 1.68 0.837 1.75 1.49 使用C1球粒陨石值(下标CN)进行硬石膏中稀土元素(Rare Earth Element,REE)含量的标准化计算[76]。使用(Eu/Eu*)CN = (2×EuCN)/(SmCN + GdCN)和(Ce/Ce*)CN = (2×CeCN)/(LaCN + PrCN)计算获得硬石膏中稀土元素的Eu和Ce异常值。
2.4 原位硫同位素组成分析
在西北大学的大陆动力学国家重点实验室,使用193 nm飞秒激光剥蚀多接受电感耦合等离子质谱仪(femtosecond laser-ablation multi-collector inductively coupled plasma mass spectrometer,fs-LA-MC-ICP-MS),对光片中硬石膏的硫同位素组成进行分析。首先使用LA剥蚀样品,接着使用氦气运移LA剥蚀采集的物质。然后,Ar气与载气He在同轴旋风混合器中混合后,运移剥蚀采集的物质进入ICP-MS。其中,激光能量是3.5~4 J/cm2,束斑直径35 μm,激光充满率3~4 Hz。样品分析过程中,NBS127(重晶石)标准用作硬石膏样品的测量标准,PSPT-3(闪锌矿)标准用作监测分析程序和质量控制标准。标准PSPT-3的δ34SV-CDT测量值是26.36‰±0.29‰ (2SD; n=21),其与推荐值(δ34SV-CDT = 26.5‰ ± 0.2‰)[77]一致。有关分析及参数的详细描述,请见文献[77-80]。
3. 结果
3.1 硬石膏的矿物学分析
冲绳海槽南段唐印热液区的海底热液硫化物堆积体上活烟囱体的R11-H2样品,其主要由硬石膏组成,含有少量的硫化物和隐晶质硅(图3d,图4)。其中,硬石膏可以分为两种类型:类型I的硬石膏呈半自形或他形晶,似针状、放射状及不规则晶的集合体产出(图2b、c、d,图5a);类型II的硬石膏则呈自形晶,以板状及粒状晶的集合体产出(图3a、b,图5b)。海底热液系统中形成的硬石膏具典型的自形、半自形和他形晶,且呈半自形或他形晶的类型I硬石膏,其晶体大小常小于呈自形晶的类型II硬石膏(图3a),表明类型I硬石膏经历了一个快速、非充分的结晶过程,而类型II硬石膏则经历了一个较慢、充分的结晶过程。大多数的类型II硬石膏分布于流体通道的内壁,且包裹着类型I的硬石膏,表明类型I的硬石膏先于类型II的硬石膏结晶沉淀。
![]() 图 5 冲绳海槽唐印热液区中硬石膏的电子探针背散射电子图像Anh:硬石膏。Figure 5. EPMA back-scattered electron images of anhydrite from the Tangyin hydrothermal field in the Okinawa TroughAn: anhydrite.
图 5 冲绳海槽唐印热液区中硬石膏的电子探针背散射电子图像Anh:硬石膏。Figure 5. EPMA back-scattered electron images of anhydrite from the Tangyin hydrothermal field in the Okinawa TroughAn: anhydrite.较晚生长的硬石膏占据烟囱体孔隙或在烟囱体外表面附近与孔隙中少量的硫化物共生(图3d)。二氧化硅则在针状或叶片状硬石膏晶体上沉淀。硬石膏聚集体中的叶片状重晶石通常形成片状晶体的辐射簇,而带状无定形二氧化硅则通常覆盖着这些重晶石晶体。在硬石膏聚集体中少量、细粒的闪锌矿、黄铁矿和方铅矿呈浸染状分布(图3d)。
3.2 硬石膏的主量和微量元素含量
硬石膏的原位主量和微量元素含量数据见表1–2。唐印热液区中硬石膏样品的CaO、SO3和SrO含量分别为41.03%~45.47%、55.43%~58.92% 和0.11%~0.62%(表1)。较早形成的半自形、他形、放射状或不规则状的类型I硬石膏中MgO(0.02%~0.86%)和BaO(0.06%~0.11%)含量的变化范围分别明显大于较晚形成的自形、板片状及粒状类型II硬石膏(MgO 0.02%~0.08%,BaO 0.07%~0.08%)(表1、图6)。与类型I硬石膏相比,大多数类型II硬石膏中的Sr含量较高(表1、图6),表明冲绳海槽唐印热液区中较晚形成的类型II硬石膏更富集Sr。除Mg和Na外,硬石膏中其他主量元素的含量均高于海水中相应元素(图6)。
![]()
唐印热液区中硬石膏样品的Mn、Ni、Ga、Rb、Y和Mo含量分别为75~234、0.357~5.28、0.160~1.81、0.607~19.5、0.108~2.66 和0.034~0.137 μg/g(表2),且其Ti(4.57~164 μg/g)、Cr(2.36~417 μg/g)、Zn(9.25~464 μg/g)、Th(0.045~1.23 μg/g)和U(0.071~0.983 μg/g)含量变化范围较大(表2、图7),除了Mn、Zn、Rb和Cd以外,硬石膏中其他微量元素的含量均高于海水和喷口流体中相应元素(图7)。
![]()
唐印热液区中硬石膏样品的C1-球粒陨石标准化REE配分模式见图8,其REE总量(∑REEs)有较大的变化范围(2.27~31.6 μg/g)(表2),最高的∑REEs达到31.6 μg/g(样品R11-H2,点6-1-1;表2),且大多数高于喷口流体和海水(图8)。在硬石膏的C1-球粒陨石标准化REE配分模式中,大多数的硬石膏展现出LREE相对富集(LREE/HREE比值=13.1~30.7),LaCN/LuCN比值(7.80~19.8)和Eu异常((Eu/Eu*)CN =0.314~5.08)明显变化及Ce异常((Ce/Ce*)CN =0.837~1.75)轻微变化的特征(表2,图8)。
![]() 图 8 冲绳海槽唐印热液区中硬石膏样品的稀土元素球粒陨石标准化配分模式图Figure 8. REE pattern of anhydrite samples from the Tangyin hydrothermal field in the Okinawa Trough
图 8 冲绳海槽唐印热液区中硬石膏样品的稀土元素球粒陨石标准化配分模式图Figure 8. REE pattern of anhydrite samples from the Tangyin hydrothermal field in the Okinawa Trough3.3 硬石膏的原位硫同位素组成分析
唐印热液区中硬石膏样品的δ34S值(18.32‰~20.26‰,平均19.6‰,n = 4;表3),大多落在其他海底热液区中硫酸盐矿物的δ34S值变化范围中(19‰~25‰,n = 288)[8]。
表 3 使用LA-MC-ICP-MS分析唐印热液区样品R11-H2中硬石膏的硫同位素组成Table 3. Sulfur isotopic compositions of the anhydrite crystals in sample R11-H2 from the Tangyin hydrothermal field determined by LA-MC-ICP-MS测试点 矿物 δ34Sv-CDT/‰ 2SE 4-1-1 硬石膏 20.08 0.31 4-1-2 硬石膏 18.32 0.82 4-1-3 硬石膏 20.26 0.42 4-1-4 硬石膏 19.82 0.28 标准物质
PSPT-3闪锌矿 26.36 0.29 4. 讨论
4.1 海水-流体混合
高温热液流体的化学浓度常被外推至Mg为零时的化学浓度,此时其被认为是热液流体端员的化学浓度或是完全没有遭受过海水改变的热液流体。正如前面提到的海底热液活动,当喷出的流体去除了Mg和硫酸盐后,其形成的热液烟囱体则主要由硬石膏和硫化物组成。唐印热液区中硬石膏的存在,既表明该区存在中温(>150℃)到高温(>300℃)的海底热液活动[83],也表明其是冷海水注入与热流体喷出及混合过程的产物,即海水与高温热液流体混合并在温度高于150℃后导致了硬石膏在烟囱体中的沉淀,且后期粗粒的硬石膏是热液活动减弱期间注入海水与高温流体混合的产物[86]。进一步,唐印热液区中的类型I硬石膏,其时常呈半自形或他形、针状及不规则状的晶体集合体(图5a),表明其是海水–流体混合期间流体快速冷却的结果。
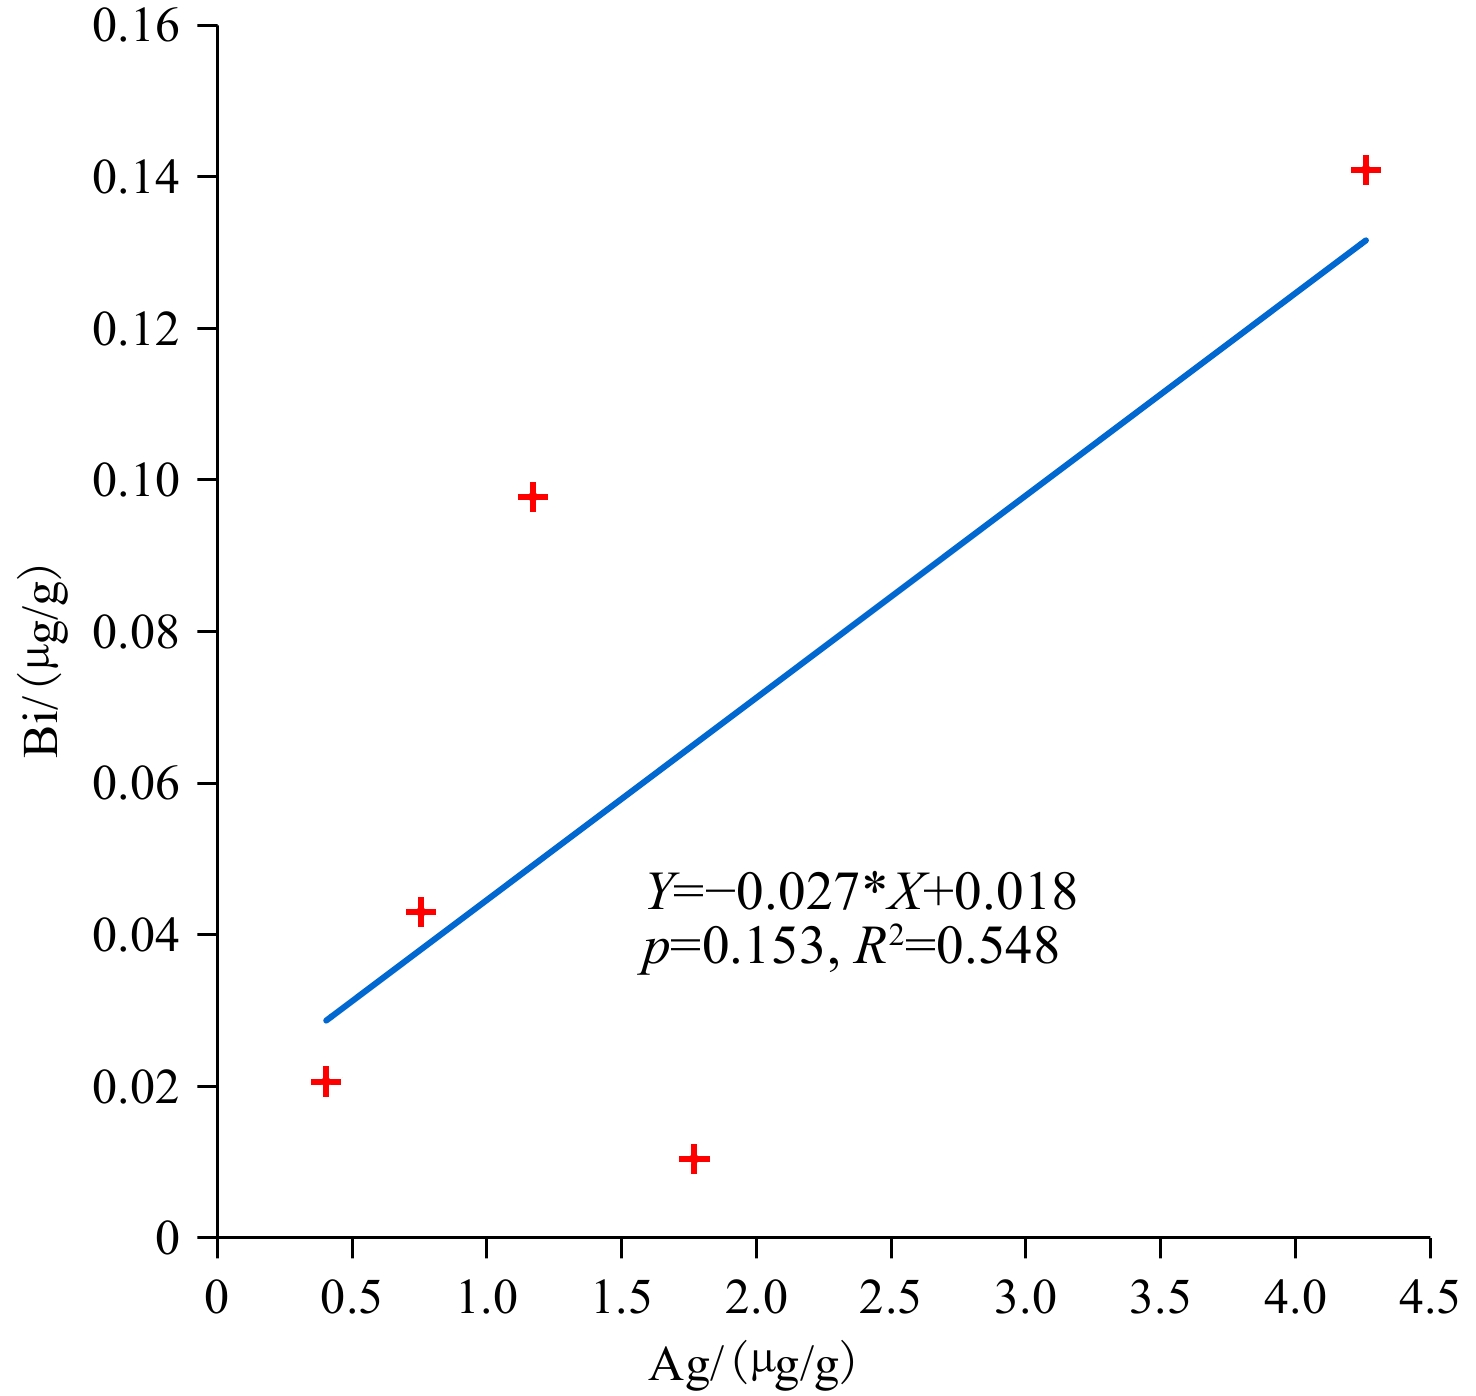
唐印热液区中硬石膏的Ag含量(0.403~4.26 μg/g)(表2)低于大西洋洋中脊Rainbow热液区(200 μg/g)、南胡安德福卡洋脊(400~700 μg/g)和胡安德福卡洋脊Endeavour段(<400 μg/g)中硬石膏的含量[32, 87-88],且样品R11-H2中硬石膏的Ag含量与Bi含量呈正相关关系(图9)。不仅如此,硬石膏中Ag的含量远高于海水(图7),这使得硬石膏在低温(<150℃)情况下,随其溶解而成为海洋中Ag的一个潜在物源,并使海洋环境中Ag的富集机制,因Ag的多物源(壳源、火山源、硬石膏源等)而变得复杂[89]。同时,唐印热液区中硬石膏的Bi(0.010~0.141 μg/g)、Tl(0.098~0.134 μg/g)和Sb(3.28~33.5 μg/g)含量是变化的,这表明在硬石膏沉淀期间流体的化学组成随着时间而改变,且其Bi和Sb含量明显高于冲绳海槽喷口流体(Bi = 0.000647 μg/g)[90]和海水(Bi = 0.00002 μg/g, Sb = 0.0033 μg/g)[81](图7)。此外,唐印热液区中硬石膏所呈现的Bi、Tl和Sb含量特征,可能是由于在热液活动的早期阶段,流体与海水混合而快速冷却导致早期硬石膏沉淀的结果(表2、图7)。
![]() 图 9 冲绳海槽唐印热液区硬石膏中Ag与Bi的相关关系Figure 9. Correlation between Ag and Bi in anhydrite from the Tangyin hydrothermal field in the Okinawa Trough
图 9 冲绳海槽唐印热液区硬石膏中Ag与Bi的相关关系Figure 9. Correlation between Ag and Bi in anhydrite from the Tangyin hydrothermal field in the Okinawa Trough4.2 变化的REE含量、Ce和Eu异常的成因以及REEs的来源
硬石膏的∑REEs(2.27~31.6 μg/g)变化明显(表2),且其变化与Ca或S没有相关性,暗示形成硬石膏的流体也具有较大的∑REEs变化范围(>150℃)。在唐印热液区,硬石膏的LREEs和HREEs之间的比值具有较大的变化范围(表2),其LREE/HREE比值最大达30.7(样品R11-H2,点4-1-7,表2),最小为13.1(样品R11-H2,点4-1-2,表2)。此外,REEs较大的离子半径,对于其进入硬石膏产生了明显影响[91-92],且促使硬石膏因其Ca2+ (100 pm)和 La3+ (103.2 pm)具有相近的离子半径而具有LREE富集的特征[93-94]。
唐印热液区中硬石膏的REE球粒陨石标准化配分模式显示无或正Ce(0.837~1.75)和Eu(0.314~5.08)异常(表2、图8),其与冲绳海槽[82-83]及全球所有海底热液区中喷口流体的值类似。唐印热液区中部分硬石膏(样品R11-H2,点4-1-1、4-1-5、4-1-6)的REE球粒陨石标准化配分模式呈正Eu异常(1.62~5.08)(表2、图8),与Yonaguni Knoll IV、东太平洋海隆13°N附近和Logatchev热液区中喷口流体的Eu异常值类似[83, 95-98],表明这些硬石膏继承了形成其的喷口流体的正Eu异常[4, 92, 99-100]。此外,由于Eu2+离子稳定性的增加与C1–络合、低至高温的酸性流体和还原条件有关[91, 101-105],因此,唐印热液区中具高Eu含量(0.046~0.091 μg/g)的硬石膏,其正Eu异常的产生是高温、低pH值及强还原条件下Eu2+离子与Cl–离子络合的结果[86]。
唐印热液区中部分硬石膏的REE球粒陨石标准化配分模式呈负或无Eu异常(0.314~0.661)(表2,图8),反映其形成过程中受低温海水的影响很明显[106]。进一步,由于Eu2+离子仅在高温(>250℃)流体环境中稳定[90],因此低温流体中的Eu常呈三价。随着硬石膏的形成温度从中温(200~300℃)到低温(<200℃),对应的喷口流体中的Eu2+/Eu3+比值也将相应降低[92],致使从低温流体中形成的硬石膏,与从中温流体中形成的硬石膏相比,其聚集的Eu2+离子数量降低,这与从低温流体中形成的硬石膏具负或无Eu异常以及低Eu含量(<0.120 μg/g)的特征一致(表2)。
另一方面,在从高到低温、氧化的流体环境中,与SO42–离子络合,流体中Eu2+离子的稳定性增加[101]。因此,唐印热液区中部分硬石膏的REE球粒陨石标准化配分模式呈负或无Eu异常,也可解释为其在从高到低温、氧化的流体环境中沉淀时,Eu2+离子与SO42–离子络合的结果。以上表明,喷口流体中的Eu浓度可以影响硬石膏中的Eu异常,硬石膏中的负或无Eu异常是在流体和海水混合期间,混合后流体从中到低温变化,且流体中Eu含量降低的结果[95, 100]。
硬石膏中的REEs可以反映热液流体的来源和演化[92]。对比显示,唐印热液区中硬石膏的REE球粒陨石标准化配分模式与Yonaguni Knoll IV喷口流体[89]相似(图8),表明硬石膏中的REEs可能全部来自热液流体,且流体通过与火成岩和/或沉积物相互作用,淋滤了海底面以下深部火成岩和/或沉积物中的REEs[83],并进入到从流体中沉淀形成的硬石膏中[107-108]。此外,唐印热液区中硬石膏的∑REEs(2.27~31.6 μg/g)及其REE球粒陨石标准化配分模式(LaCN/LuCN比值=7.80~19.8;(Eu/Eu*)CN 比值=0.314~5.08)均变化明显,且大多数的硬石膏REE球粒陨石标准化配分模式与喷口流体的类似,展示LREE富集的特征(图8),表明硬石膏中变化的REEs含量,Eu异常以及LREEs的相对富集,与形成硬石膏的流体REEs以及硬石膏的晶体化学特征有关。
4.3 硬石膏中硫的来源
形成海底硫化物/硫酸盐的热液喷口流体中的H2S具有1.5‰~7‰的δ34S值[87],其落在玄武岩(+0.1‰ ± 0.5‰;[109-112])和海水(+21‰;[113])的δ34S值之间,构成了海底热液硫化物和硫酸盐中硫的来源[114]。
已知在冲绳海槽中段和南段分布的海底热液活动,其处于分布火山碎屑、沉积物[49]、玄武质熔岩[63-64]和火山角砾[68]的环境中,且冲绳海槽热液喷口流体中的硫,其SO42–和H2S分别具有20.6‰~25.7‰和–0.2‰~12‰的δ34S值[8, 54-55, 57, 82, 111, 113, 90, 115-116]。唐印热液区中硬石膏的δ34S值具有小的变化范围(18.32‰~20.26‰,表3、图8),其落在海水和喷口流体中SO42–(20.6‰~25.7‰)与喷口流体中H2S(−0.2‰~12‰)、玄武岩(+0.1‰ ± 0.5‰;[109-112])以及琉球岛弧火山岩((7.0‰±1.9‰)~(12.9‰±2.1‰ )[117])的δ34S值之间。
唐印热液区中硬石膏的硫同位素组成显示,其硫来自喷口流体和海水中SO42–与流体中H2S的贡献,且在硬石膏形成过程中受到了喷口流体和海水中SO42–与喷口流体H2S混合的影响,其遵循的反应如下:
$$\begin{aligned}& 3\mathrm{Ca}^{2+}(\mathrm{aq})+\mathrm{SO}_4^{2-}(\mathrm{aq})+2\mathrm{H}_2\mathrm{S}(\mathrm{aq})+5\mathrm{O}_2(\mathrm{aq})\to \\&3\mathrm{CaSO_4}(\mathrm{s})+2\mathrm{H_2O}(\mathrm{aq}) \end{aligned}$$ 此外,唐印热液区中一个硬石膏颗粒的δ34S值是20.26‰,其与喷口流体中SO42–(20.6‰~25.7‰)和海水硫酸盐(+21‰;[113])的δ34S值一致,表明该硬石膏中的硫来自海水与喷口流体中SO42–混合的结果,进一步证实了唐印海底热液硫化物堆积体中硬石膏形成过程中海水进入了热液流体中。
一个简单的两端元混合模式:
$${\rm \delta^{34}S_{mix}} = X \times {\rm\delta^{34}S_{fluid\; {SO_4^{2-}}\;{ and\; seawater}} } + (1- X)\times \rm\delta^{34}S_{fluid \;H_2S} $$ 其中,X是指流体和海水中SO42–的量;δ34Smix,δ34Sfluid SO42– and seawater (26‰)和 δ34Sfluid H2S (–0.2‰)分别是指硬石膏、流体与海水混合后SO42–以及流体中H2S的δ34S值。
据此硫同位素两端元混合模式可以解释唐印热液区中硬石膏的硫同位素组成是海水和流体中SO42–(约71.2% ~78.7%,平均76%,n = 4)与喷口流体H2S(约21.3‰~28.8%,平均24%,n = 4)中硫混合的结果,且唐印热液区中硬石膏形成过程中,海水和喷口流体中SO42–贡献的硫要高于喷口流体中H2S贡献的硫。
5. 结论
(1)在唐印热液区中硬石膏出露于烟囱体的壁,与少量的方铅矿、黄铁矿、闪锌矿、重晶石和隐晶质硅相伴生,且具有两种不同的类型,包括半自形或他形,针状及不规则状硬石膏晶体集合体,以及自形、板状及颗粒状硬石膏晶体集合体。
(2)硬石膏的Ag与Bi呈现正相关关系,其具∑REEs变化范围大与LREEs相对富集的特征,且其REE球粒陨石标准化配分模式呈现正、弱到无,或负的Eu和Ce异常。其中,硬石膏具有LREEs相对富集的特征与热液流体的一致,反映硬石膏中的REEs来自热液流体,其LREE/HREE比值继承了热液流体的值,且硬石膏的REE含量及REE球粒陨石标准化配分模式与硬石膏的晶体化学特征有关,受到了热液流体的物理化学性质和REE浓度,流体和海水的混合以及流体与岩石和/或沉积物相互作用的综合影响。
(3)进一步,矿物化学以及热液流体的REE组成是控制硬石膏中REE化学特征的主要因素,且具正Eu异常的硬石膏是在高温、酸性或还原流体环境下的产物,而具弱到无((Eu/Eu*)CN ≈ 1.00)或负((Eu/Eu*)CN<0.90)Eu异常的硬石膏则是在热液流体与海水混合后构成具较低Eu含量、中到低温流体环境下的产物。因此,硬石膏的Eu异常值可以用于示踪热液流体的REE特征和其沉淀时的流体温度,例如,唐印热液区中硬石膏的正Eu异常表明其形成于高温(>300℃)酸性(pH<3.6)的流体中。
(4)硬石膏中的硫同位素组成与海水和喷口流体中SO42–的相近,其硫是流体和海水中SO42–的硫与流体H2S中硫混合的结果,且流体和海水中SO42–贡献的硫占了较大的比例。
致谢:感谢HOBAB 4航次期间“科学”号所有船队员为样品采集所作出的贡献及帮助。感谢审稿人和编辑提出的宝贵意见。
-
![]()
图 1 冲绳海槽唐印热液区中硬石膏样品的位置
红矩形是热液区的位置,红星是硬石膏采样位置。
Figure 1. Location of anhydrite samples from the Tangyin hydrothermal field in the Okinawa Trough
The red rectangle is the location of the hydrothermal field, the red star is the sampling location of anhydrite.
![]()
图 2 冲绳海槽唐印热液区中硬石膏样品的手标本(a)、单偏光(b)和正交偏光(c,d)显微镜下照片
Anh:硬石膏。
Figure 2. Hand specimens of anhydrite samples from the Tangyin hydrothermal field in the Okinawa Trough (a) and images of microscope under single polarized light (b) and orthogonal polarized light (c, d)
Anh: anhydrite.
![]()
图 3 冲绳海槽唐印热液区中硬石膏(a,b,c)与硫化物(d)的扫描电镜背散射电子图像
Anh: 硬石膏, Sp: 闪锌矿, Gn: 方铅矿。
Figure 3. Scanning electron microscope back-scattered electron images of anhydrite (a, b, c) and sulfide (d) from the Tangyin hydrothermal field in the Okinawa Trough
Anh: anhydrite; Sp: sphalerite; Gn: galena.
![]()
图 4 冲绳海槽唐印热液区中硬石膏与硅质物的扫描电镜能谱面扫描图像
Anh:硬石膏; Si: 硅质物; Ca, S, Si, Mg, O分别是钙,硫,硅,镁,氧元素的面扫描图像。
Figure 4. Scanning electron microscope energy dispersive scanning images of anhydrite and amorphous silica from the Tangyin hydrothermal field in the Okinawa Trough
Anh: anhydrite; Si: silica material; Ca, S, Si, Mg, and O are energy dispersive scanning images of calcium, sulphur, silicon, magnesium, and oxygen elements, respectively.
![]()
图 5 冲绳海槽唐印热液区中硬石膏的电子探针背散射电子图像
Anh:硬石膏。
Figure 5. EPMA back-scattered electron images of anhydrite from the Tangyin hydrothermal field in the Okinawa Trough
An: anhydrite.
![]()
![]()
![]()
图 8 冲绳海槽唐印热液区中硬石膏样品的稀土元素球粒陨石标准化配分模式图
标准化数据来自文献[82],海水、喷口流体和火成岩数据分别来自文献[81,84,42,36]和[85]。
Figure 8. REE pattern of anhydrite samples from the Tangyin hydrothermal field in the Okinawa Trough
Normalized data are from [82], data of seawater, vent fluid, and igneous rock are from references、 [81, 84, 42, 36], and [85], respectively.
![]()
图 9 冲绳海槽唐印热液区硬石膏中Ag与Bi的相关关系
Figure 9. Correlation between Ag and Bi in anhydrite from the Tangyin hydrothermal field in the Okinawa Trough
表 1 唐印热液区样品R11-H2中硬石膏的电子探针分析结果和化学式
Table 1 Electron microprobe analyses of the anhydrite in sample R11-H2 from the Tangyin hydrothermal field and their atoms per formula unit for elements
% 类型 测试点 K2O SO3 CaO BaO TiO2 Na2O Al2O3 SrO MgO SiO2 NiO FeO MnO Cr2O3 总计 化学式 类型I 6-6 n.d. 58.02 41.95 0.09 n.d. 0.02 n.d. 0.14 0.02 n.d. n.d. 0.03 n.d. 0.03 100.29 Ca1.58S0.71O3.71 6-8 n.d. 57.45 41.03 0.11 n.d. n.d. n.d. 0.11 0.86 0.74 n.d. n.d. n.d. n.d. 100.31 Ca1.55Mg0.02Si0.01S0.71O3.71 6-10 n.d. 56.84 42.68 n.d. n.d. 0.03 n.d. 0.19 0.04 n.d. n.d. n.d. n.d. 0.03 99.81 Ca1.60S0.70O3.70 6-11 n.d. 55.64 44.29 n.d. n.d. 0.06 n.d. 0.19 0.16 n.d. n.d. n.d. n.d. 0.08 100.43 Ca1.65S0.67O3.67 6-12 n.d. 55.43 45.47 0.06 n.d. 0.03 0.02 0.15 0.07 n.d. 0.04 n.d. n.d. n.d. 101.26 Ca1.67S0.66O3.66 6-13 n.d. 56.29 42.67 n.d. 0.04 0.06 n.d. 0.22 0.19 n.d. n.d. n.d. n.d. 0.07 99.53 Ca1.61S0.69O3.69 6-15 n.d. 57.19 42.29 n.d. n.d. 0.08 n.d. 0.20 0.04 n.d. n.d. n.d. n.d. n.d. 99.80 Ca1.59S0.70O3.70 6-16 n.d. 56.28 42.27 n.d. 0.05 0.05 n.d. 0.14 0.07 n.d. 0.04 0.10 n.d. n.d. 99.00 Ca1.60S0.70O3.69 6-17 n.d. 57.25 42.76 n.d. n.d. 0.02 n.d. 0.19 0.03 n.d. n.d. n.d. 0.05 n.d. 100.29 Ca1.60S0.70O3.70 6-24 n.d. 57.74 42.59 n.d. n.d. n.d. n.d. 0.18 0.03 n.d. n.d. 0.03 0.04 n.d. 100.59 Ca1.59S0.70O3.70 类型II 4-1-1 n.d. 56.72 43.84 n.d. n.d. 0.07 0.02 0.31 n.d. n.d. n.d. n.d. n.d. 0.09 101.05 Ca1.62S0.68O3.68 4-1-2 n.d. 58.23 42.41 n.d. n.d. 0.05 n.d. 0.29 0.02 n.d. n.d. 0.04 n.d. n.d. 101.03 Ca1.58S0.71O3.71 4-1-3 n.d. 56.38 42.89 0.08 n.d. 0.04 n.d. 0.62 0.02 n.d. n.d. n.d. n.d. 0.04 100.07 Ca1.61Sr0.01S0.69O3.69 4-1-4 n.d. 57.63 42.96 n.d. n.d. 0.02 n.d. 0.22 n.d. n.d. n.d. n.d. n.d. 0.05 100.89 Ca1.60S0.70O3.70 4-1-5 n.d. 57.31 44.11 0.07 n.d. n.d. n.d. 0.19 0.06 n.d. n.d. n.d. n.d. n.d. 101.73 Ca1.62S0.69O3.69 4-1-6 n.d. 58.12 42.71 n.d. n.d. n.d. 0.04 0.20 0.04 n.d. n.d. n.d. n.d. n.d. 101.10 Ca1.59S0.70O3.70 4-1-7 n.d. 57.87 42.18 n.d. n.d. 0.03 n.d. 0.28 0.06 n.d. 0.04 n.d. 0.05 n.d. 100.50 Ca1.58S0.71O3.71 6-1-1 n.d. 58.17 41.78 n.d. n.d. 0.04 n.d. 0.25 n.d. n.d. n.d. n.d. n.d. n.d. 100.23 Ca1.57S0.71O3.71 4-14 n.d. 58.92 42.00 0.08 n.d. n.d. 0.02 0.52 0.07 n.d. n.d. 0.03 n.d. n.d. 101.64 Ca1.56S0.71O3.71 4-16 n.d. 57.92 43.33 n.d. n.d. 0.03 n.d. 0.28 0.04 n.d. 0.07 0.03 0.05 n.d. 101.75 Ca1.60S0.70O3.70 4-17 n.d. 56.52 42.94 n.d. n.d. 0.03 0.02 0.23 n.d. n.d. n.d. 0.04 n.d. n.d. 99.78 Ca1.61S0.69O3.69 4-18 n.d. 56.70 44.63 0.07 n.d. 0.02 n.d. 0.24 0.08 n.d. n.d. 0.03 0.04 0.05 101.85 Ca1.64S0.68O3.68 检测限 K2O SO3 CaO BaO TiO2 Na2O Al2O3 SrO MgO SiO2 NiO FeO MnO Cr2O3 0.02 0.03 0.02 0.05 0.03 0.02 0.02 0.03 0.01 0.03 0.03 0.03 0.03 0.03 注:n.d表示无数据。  下载: 导出CSV
表 2 使用LA-ICP-MS分析唐印热液区样品R11-H2中硬石膏的微量元素含量
Table 2 Trace element concentrations of the anhydrite in sample R11-H2 from the Tangyin hydrothermal field determined via LA-ICP-MS
μg/g 元素 4-1-1 4-1-2 4-1-3 4-1-4 4-1-5 4-1-6 4-1-7 6-1-1 最小值 最大值 平均值 检测限 SRM610平均值 SRM610参考值 RE% Sc n.d. 1.56 1.46 n.d. n.d. n.d. n.d. n.d. 1.46 1.56 1.51 0.721 441.20 441.00 0.05 Ti 66.7 30.0 84.1 33.4 4.57 12.3 34.1 164 4.57 164 53.7 0.891 439.66 434.00 1.31 V 1.55 0.837 2.44 0.501 0.199 0.424 0.509 2.40 0.199 2.44 1.11 0.134 442.09 442.00 0.02 Cr 8.06 57.9 2.36 34.7 417 2.80 16.7 11.9 2.36 417 68.9 1.797 405.81 405.00 0.20 Fe 707 551 776 160 484 n.d. 388 1760 160 1760 689 134.53 473.45 458.00 3.37 Mn 107 78.6 234 96.7 108 75.1 159 122 75.1 234 123 0.417 485.27 485.00 0.06 Co n.d. 0.218 0.217 n.d. 0.085 n.d. n.d. 0.716 0.085 0.716 0.309 0.079 405.07 405.00 0.02 Ni 2.67 0.658 2.74 n.d. 0.357 1.31 1.25 5.28 0.357 5.28 2.04 0.314 458.80 458.70 0.02 Cu 58.8 54.8 84.0 41.3 98.0 47.8 56.7 92.8 41.3 98.0 66.8 0.614 430.15 430.00 0.04 Zn 107 164 464 9.25 82.6 100 328 411 9.25 464 208 2.979 456.02 456.00 0.01 Ga 1.02 0.396 1.65 0.612 n.d. 0.160 0.261 1.81 0.160 1.81 0.843 0.115 438.07 438.00 0.02 Ge n.d. 0.987 3.73 n.d. n.d. 1.67 n.d. 1.24 0.987 3.73 1.91 0.347 426.05 426.00 0.01 As n.d. 9.25 27.0 2.55 5.85 2.68 12.6 10.3 2.55 27.0 10.0 0.991 317.06 317.00 0.02 Rb 9.61 4.17 13.6 4.09 0.607 1.69 4.44 19.5 0.607 19.5 7.22 0.101 425.77 425.70 0.02 Sr 1785 1919 1372 1661 1708 1569 1778 1580 1372 1919 1671 0.048 515.58 515.50 0.02 Y 1.22 0.341 1.67 0.455 0.108 0.237 0.448 2.66 0.108 2.66 0.893 0.016 450.10 450.00 0.02 Mo 0.137 0.050 0.087 n.d. 0.034 0.117 0.109 0.120 0.034 0.137 0.093 0.027 410.00 410.00 0.00 Ag 0.755 1.15 1.17 0.679 1.77 0.403 1.08 4.26 0.403 4.26 1.41 0.166 239.06 239.00 0.02 Cd 1.05 n.d. 0.640 0.152 0.208 0.706 0.913 1.85 0.152 1.85 0.789 0.105 259.22 259.00 0.08 In 0.020 n.d. n.d. n.d. n.d. n.d. 0.046 0.317 0.020 0.317 0.128 0.018 441.02 441.00 0.01 Sn n.d. n.d. 2.85 1.76 2.90 2.26 4.92 4.58 1.76 4.92 3.21 0.797 396.01 396.00 0.00 Sb 3.28 14.3 24.3 12.4 33.5 14.5 17.5 6.65 3.28 33.5 15.8 0.063 369.05 369.00 0.01 Ba 164 97.1 136 149 193 76.6 123 177 76.6 193 139 0.219 435.01 435.00 0.00 La 2.90 1.51 4.17 1.44 0.701 0.731 1.64 6.31 0.701 6.31 2.43 0.009 457.02 457.00 0.00 Ce 8.67 4.12 12.4 4.48 0.968 1.75 4.60 18.8 0.968 18.8 6.97 0.007 448.02 448.00 0.01 Pr 0.420 0.281 0.610 0.218 0.078 0.101 0.340 0.946 0.078 0.946 0.374 0.004 430.07 430.00 0.02 Nd 1.11 0.933 2.65 0.816 0.258 0.510 0.868 3.45 0.258 3.45 1.32 0.022 431.01 431.00 0.00 Sm n.d. 0.070 0.824 n.d. 0.076 0.114 0.310 0.591 0.070 0.824 0.331 0.009 451.16 451.00 0.04 Eu 0.091 0.019 0.068 n.d. 0.088 0.046 0.048 0.115 0.019 0.115 0.068 0.018 461.03 461.00 0.01 Gd 0.246 0.210 0.432 0.157 0.021 0.049 0.113 0.434 0.021 0.434 0.208 0.010 444.01 444.00 0.00 Tb 0.025 n.d. 0.028 0.023 0.010 n.d. 0.006 0.084 0.006 0.084 0.029 0.006 443.02 443.00 0.00 Dy 0.224 0.200 0.427 0.134 0.039 0.044 0.023 0.438 0.023 0.438 0.191 0.012 427.01 427.00 0.00 Ho 0.082 0.018 0.058 n.d. 0.010 n.d. 0.029 0.078 0.010 0.082 0.046 0.006 449.00 449.00 0.00 Er 0.104 0.025 0.135 0.105 0.018 0.051 0.063 0.183 0.018 0.183 0.085 0.016 426.04 426.00 0.01 Tm n.d. n.d. n.d. n.d. n.d. n.d. n.d. 0.040 0.040 0.040 0.040 0.035 420.02 420.00 0.00 Yb n.d. 0.077 0.191 0.081 n.d. 0.016 n.d. 0.138 0.016 0.191 0.101 0.010 445.05 445.00 0.01 Lu 0.040 n.d. 0.023 n.d. n.d. n.d. 0.021 n.d. 0.021 0.040 0.028 0.006 435.08 435.00 0.02 Au 0.036 0.066 n.d. 0.042 n.d. n.d. n.d. n.d. 0.036 0.066 0.048 0.025 23.01 23.00 0.04 Tl 0.134 0.098 0.133 n.d. n.d. n.d. 0.116 n.d. 0.098 0.134 0.121 0.086 61.01 61.00 0.02 Pb 145 318 505 136 375 278 401 340 136 505 312 0.120 426.00 426.00 0.00 Bi 0.043 n.d. 0.098 n.d. 0.010 0.021 n.d. 0.141 0.010 0.141 0.063 0.010 358.02 358.00 0.01 Th 0.657 0.291 1.01 0.332 0.045 0.101 0.301 1.23 0.045 1.23 0.496 0.011 457.21 457.20 0.00 U 0.231 0.367 0.983 0.145 0.079 0.071 0.452 0.623 0.071 0.983 0.369 0.003 461.55 461.50 0.01 ∑REEs 13.9 7.46 22.0 7.46 2.27 3.41 8.06 31.6 2.27 31.6 12.0 LREE/HREE 18.3 13.1 16.0 13.9 22.1 20.4 30.7 21.7 13.1 30.7 19.5 LaCN/LuCN 7.80 n.d. 19.8 n.d. n.d. n.d. 8.34 n.d. 7.80 19.8 12.0 (Eu/Eu*)CN 2.62 0.443 0.314 n.d. 5.08 1.62 0.638 0.661 0.314 5.08 1.62 (Ce/Ce*)CN 1.70 1.44 1.69 1.75 0.837 1.38 1.43 1.68 0.837 1.75 1.49
下载: 导出CSV
表 3 使用LA-MC-ICP-MS分析唐印热液区样品R11-H2中硬石膏的硫同位素组成
Table 3 Sulfur isotopic compositions of the anhydrite crystals in sample R11-H2 from the Tangyin hydrothermal field determined by LA-MC-ICP-MS
测试点 矿物 δ34Sv-CDT/‰ 2SE 4-1-1 硬石膏 20.08 0.31 4-1-2 硬石膏 18.32 0.82 4-1-3 硬石膏 20.26 0.42 4-1-4 硬石膏 19.82 0.28 标准物质
PSPT-3闪锌矿 26.36 0.29
下载: 导出CSV
-
[1] Zeng Z G, Qin Y S, Zhai S K. He, Ne and Ar isotope compositions of fluid inclusions in hydrothermal sulfides from the TAG hydrothermal field Mid-Atlantic Ridge[J]. Science in China Series D: Earth Sciences, 2001, 44(3): 221-228. doi: 10.1007/BF02882256
[2] Zeng Z G, Chen D G, Yin X B, et al. Elemental and isotopic compositions of the hydrothermal sulfide on the east Pacific rise near 13ºN[J]. Science China Earth Sciences, 2010, 53(2): 253-266. doi: 10.1007/s11430-010-0013-3
[3] Zeng Z G, Chen S, Selby D, et al. Rhenium-osmium abundance and isotopic compositions of massive sulfides from modern deep-sea hydrothermal systems: Implications for vent associated ore forming processes[J]. Earth and Planetary Science Letters, 2014, 396: 223-234. doi: 10.1016/j.jpgl.2014.04.017
[4] Zeng Z G, Ma Y, Yin X B, et al. Factors affecting the rare earth element compositions in massive sulfides from deep-sea hydrothermal systems[J]. Geochemistry, Geophysics, Geosystems, 2015, 16(8): 2679-2693. doi: 10.1002/2015GC005812
[5] Zeng Z G, Niedermann S, Chen S, et al. Noble gases in sulfide deposits of modern deep-sea hydrothermal systems: implications for heat fluxes and hydrothermal fluid processes[J]. Chemical Geology, 2015, 409: 1-11. doi: 10.1016/j.chemgeo.2015.05.007
[6] Zeng Z G, Li X H, Chen S, et al. Iron, copper, and zinc isotopic fractionation in seafloor basalts and hydrothermal sulfides[J]. Marine Geology, 2021, 436: 106491. doi: 10.1016/j.margeo.2021.106491
[7] Zeng Z G, Chen Z X, Qi H Y, et al. Chemical and isotopic composition of sulfide minerals from the Noho hydrothermal field in the Okinawa Trough[J]. Journal of Marine Science and Engineering, 2022, 10(5): 678. doi: 10.3390/jmse10050678
[8] Zeng Z G, Ma Y, Chen S, et al. Sulfur and lead isotopic compositions of massive sulfides from deep-sea hydrothermal systems: implications for ore genesis and fluid circulation[J]. Ore Geology Reviews, 2017, 87: 155-171. doi: 10.1016/j.oregeorev.2016.10.014
[9] Zeng Z G, Chen Z X, Qi H Y. Two processes of anglesite formation and a model of secondary supergene enrichment of Bi and Ag in seafloor hydrothermal sulfide deposits[J]. Journal of Marine Science and Engineering, 2022, 10(1): 35.
[10] Zeng Z G, Wang X Y, Chen C T A, et al. Boron isotope compositions of fluids and plumes from the Kueishantao hydrothermal field off northeastern Taiwan: implications for fluid origin and hydrothermal processes[J]. Marine Chemistry, 2013, 157: 59-66. doi: 10.1016/j.marchem.2013.09.001
[11] Zeng Z G, Wang X Y, Qi H Y, et al. Arsenic and antimony in hydrothermal plumes from the eastern Manus Basin, Papua New Guinea[J]. Geofluids, 2018, 2018: 6079586.
[12] Zeng Z G, Wang X Y, Murton B J, et al. Dispersion and intersection of hydrothermal plumes in the Manus back-arc basin, western Pacific[J]. Geofluids, 2020, 2020: 4260806.
[13] Rong K B, Zeng Z G, Yin X B, et al. Smectite formation in metalliferous sediments near the east Pacific rise at 13°N[J]. Acta Oceanologica Sinica, 2018, 37(9): 67-81. doi: 10.1007/s13131-018-1265-6
[14] Zeng Z G, Wang X Y, Zhang G L, et al. Formation of Fe-oxyhydroxides from the east Pacific rise near latitude 13°N: evidence from mineralogical and geochemical data[J]. Science in China Series D: Earth Sciences, 2008, 51(2): 206-215. doi: 10.1007/s11430-007-0131-8
[15] Zeng Z G, Ouyang H G, Yin X B, et al. Formation of Fe-Si-Mn oxyhydroxides at the PACMANUS hydrothermal field, Eastern Manus Basin: mineralogical and geochemical evidence[J]. Journal of Asian Earth Sciences, 2012, 60: 130-146. doi: 10.1016/j.jseaes.2012.08.009
[16] Zeng Z G, Chen S, Wang X Y, et al. Mineralogical and micromorphological characteristics of Si-Fe-Mn oxyhydroxides from the PACMANUS hydrothermal field, eastern Manus Basin[J]. Science China Earth Sciences, 2012, 55(12): 2039-2048. doi: 10.1007/s11430-012-4536-7
[17] Zeng Z G, Qi H Y, Chen S, et al. Hydrothermal alteration of plagioclase microphenocrysts and glass in basalts from the east Pacific rise near 13°N: an SEM-EDS study[J]. Science China Earth Sciences, 2014, 57(7): 1427-1437. doi: 10.1007/s11430-014-4868-6
[18] Wang X Y, Zeng Z G, Qi H Y, et al. Fe-Si-Mn-oxyhydroxide encrustations on basalts at east Pacific rise near 13˚N: an SEM-EDS study[J]. Journal of Ocean University of China, 2014, 13(6): 917-925. doi: 10.1007/s11802-014-2358-2
[19] Huang X, Zeng Z G, Chen S, et al. Component characteristics of organic matter in hydrothermal barnacle shells from southwest Indian Ridge[J]. Acta Oceanologica Sinica, 2013, 32(12): 60-67. doi: 10.1007/s13131-013-0388-z
[20] Chen J B, Zeng Z G. Metasomatism of the peridotites from southern Mariana fore-arc: trace element characteristics of clinopyroxene and amphibole[J]. Science in China Series D: Earth Sciences, 2007, 50(7): 1005-1012. doi: 10.1007/s11430-007-0023-y
[21] Wang X M, Zeng Z G, Chen J B. Serpentinization of peridotites from the southern Mariana forearc[J]. Progress in Natural Science, 2009, 19(10): 1287-1295. doi: 10.1016/j.pnsc.2009.04.004
[22] Zeng Z G, Wang Q Y, Wang X M, et al. Geochemistry of abyssal peridotites from the super slow-spreading southwest Indian Ridge near 65°E: implications for magma source and seawater alteration[J]. Journal of Earth System Science, 2012, 121(5): 1317-1336. doi: 10.1007/s12040-012-0229-z
[23] Zeng Z G, Li X H, Zhang Y X, et al. Lithium, oxygen and magnesium isotope systematics of volcanic rocks in the Okinawa Trough: implications for plate subduction studies[J]. Journal of Marine Science and Engineering, 2022, 10(1): 40.
[24] Zeng Z G, Li X H, Chen S, et al. Iron-copper-zinc isotopic compositions of Andesites from the Kueishantao hydrothermal field off northeastern Taiwan[J]. Sustainability, 2022, 14(1): 359.
[25] Zeng Z G, Chen Z X, Zhang Y X, et al. Geological, physical, and chemical characteristics of seafloor hydrothermal vent fields[J]. Journal of Oceanology and Limnology, 2020, 38(4): 985-1007. doi: 10.1007/s00343-020-0123-5
[26] Haymon R M. Growth history of hydrothermal black smoker chimneys[J]. Nature, 1983, 301(5902): 695-698. doi: 10.1038/301695a0
[27] Tivey M K. Modeling chimney growth and associated fluid flow at seafloor hydrothermal vent sites[M]//Humphris S E, Zierenberg R A, Mullineaux L S, et al. Seafloor Hydrothermal Systems: Physical, Chemical, Biological, and Geological Interactions. Washington: American Geophysical Union, 1995: 158-177.
[28] Binns R A. Bikpela: a large siliceous chimney from the PACMANUS hydrothermal field, Manus Basin, Papua New Guinea[J]. Economic Geology, 2014, 109(8): 2243-2259. doi: 10.2113/econgeo.109.8.2243
[29] Chiba H, Uchiyama N, Teagle D A H. 1998. Stable isotope study of anhydrite and sulfide minerals at the TAG hydrothermal mound, Mid-Atlantic Ridge, 26°N[C]//Proceedings of the Ocean Drilling Program, Mid-Atlantic Ridge. St. John: Texas A&M University, 1998: 85-90.
[30] Juniper S K, Martineu P. Alvinellids and sulfides at hydrothermal vents of the Eastern Pacific: a review[J]. American Zoologist, 1995, 35(2): 174-185. doi: 10.1093/icb/35.2.174
[31] Haymon R M, Kastner M. Hot spring deposits on the east Pacific rise at 21°N: preliminary description of mineralogy and genesis[J]. Earth and Planetary Science Letters, 1981, 53(3): 363-381. doi: 10.1016/0012-821X(81)90041-8
[32] Paradis S, Jonasson I R, Le Cheminant G M, et al. Two zinc-rich chimneys from the plume site, southern Juan de Fuca[J]. The Canadian Mineralogist, 1988, 26(3): 637-654.
[33] Huang X, Chen S, Zeng Z G, et al. Characteristics of hydrocarbons in sediment core samples from the northern Okinawa Trough[J]. Marine Pollution Bulletin, 2017, 115(1-2): 507-514. doi: 10.1016/j.marpolbul.2016.12.034
[34] Zeng Z G, Yu S X, Wang X Y, et al. Geochemical and isotopic characteristics of volcanic rocks from the northern east China Sea shelf margin and the Okinawa Trough[J]. Acta Oceanologica Sinica, 2010, 29(4): 48-61. doi: 10.1007/s13131-010-0050-y
[35] Guo K, Zhai S K, Wang X Y, et al. The dynamics of the southern Okinawa Trough magmatic system: new insights from the microanalysis of the an contents, trace element concentrations and Sr isotopic compositions of plagioclase hosted in basalts and silicic rocks[J]. Chemical Geology, 2018, 497: 146-161. doi: 10.1016/j.chemgeo.2018.09.002
[36] Guo K, Zhai S K, Yu Z H, et al. Geochemical characteristics of major and trace elements in the Okinawa Trough basaltic glass[J]. Acta Oceanologica Sinica, 2018, 37(2): 14-24. doi: 10.1007/s13131-017-1075-2
[37] Chen Z X, Zeng Z G, Wang X Y, et al. Mineral chemistry indicates the petrogenesis of rhyolite from the southwestern Okinawa Trough[J]. Journal of Ocean University of China, 2017, 16(6): 1097-1108. doi: 10.1007/s11802-017-3344-2
[38] Chen Z X, Zeng Z G, Wang X Y, et al. U-Th/He dating and chemical compositions of apatite in the Dacite from the southwestern Okinawa Trough: implications for petrogenesis[J]. Journal of Asian Earth Sciences, 2018, 161: 1-13. doi: 10.1016/j.jseaes.2018.04.032
[39] Chen Z X, Zeng Z G, Yin X B, et al. Petrogenesis of highly fractionated rhyolites in the southwestern Okinawa Trough: constraints from whole-rock geochemistry data and Sr-Nd-Pb-O isotopes[J]. Geological Journal, 2019, 54(1): 316-332. doi: 10.1002/gj.3179
[40] Zhang Y X, Zeng Z G, Li X H, et al. High‐potassium volcanic rocks from the Okinawa Trough: implications for a cryptic potassium-rich and DUPAL-like source[J]. Geological Journal, 2018, 53(5): 1755-1766. doi: 10.1002/gj.3000
[41] Zhang Y X, Zeng Z G, Chen S, et al. New insights into the origin of the bimodal volcanism in the middle Okinawa Trough: not a basalt-rhyolite differentiation process[J]. Frontiers of Earth Science, 2018, 12(2): 325-338. doi: 10.1007/s11707-017-0638-z
[42] Li X H, Zeng Z G, Chen S, et al. Geochemical and Sr-Nd-Pb isotopic compositions of volcanic rocks from the Iheya Ridge, the middle Okinawa Trough: implications for petrogenesis and a mantle source[J]. Acta Oceanologica Sinica, 2018, 37(1): 73-88. doi: 10.1007/s13131-017-1118-8
[43] Li X H, Zeng Z G, Wang X Y, et al. Petrogenesis of basalt from the middle Okinawa Trough: new insights from olivine-hosted melt inclusions[J]. Geological Journal, 2018, 53(6): 3129-3146. doi: 10.1002/gj.3150
[44] Guo K, Zeng Z G, Chen S, et al. The influence of a subduction component on magmatism in the Okinawa Trough: evidence from thorium and related trace element ratios[J]. Journal of Asian Earth Sciences, 2017, 145: 205-216. doi: 10.1016/j.jseaes.2017.05.033
[45] Li X H, Zeng Z G, Yang H X, et al. Geochemistry of silicate melt inclusions in middle and southern Okinawa Trough rocks: implications for petrogenesis and variable subducted sediment component injection[J]. Geological Journal, 2019, 54(3): 1160-1189. doi: 10.1002/gj.3217
[46] Li X H, Zeng Z G, Yang H X, et al. Integrated major and trace element study of clinopyroxene in basic, intermediate and acidic volcanic rocks from the middle Okinawa Trough: Insights into petrogenesis and the influence of subduction component[J]. Lithos, 2020, 352-353: 105320. doi: 10.1016/j.lithos.2019.105320
[47] Zeng Z G, Chen Z X, Zhang Y X. Zircon record of an Archaean crustal fragment and supercontinent amalgamation in Quaternary back-arc volcanic rocks[J]. Scientific Reports, 2021, 11(1): 12367. doi: 10.1038/s41598-021-90578-9
[48] Kimura M. Back-arc rifting in the Okinawa Trough[J]. Marine and Petroleum Geology, 1985, 2(3): 222-240. doi: 10.1016/0264-8172(85)90012-1
[49] Ishibashi J I, Ikegami F, Tsuji T, et al. Hydrothermal activity in the Okinawa Trough back-arc basin: geological background and hydrothermal mineralization[M]//Ishibashi J I, Okino K, Sunamura M. Subseafloor Biosphere Linked to Hydrothermal Systems: TAIGA Concept. Tokyo: Springer, 2015: 337-359.
[50] Sibuet J C, Deffontaines B, Hsu S K, et al. Okinawa Trough backarc basin: early tectonic and magmatic evolution[J]. Journal of Geophysical Research: Solid Earth, 1998, 103(B12): 30245-30267. doi: 10.1029/98JB01823
[51] Zeng Z G, Chen S, Ma Y, et al. Chemical compositions of mussels and clams from the Tangyin and Yonaguni Knoll IV hydrothermal fields in the southwestern Okinawa Trough[J]. Ore Geology Reviews, 2017, 87: 172-191. doi: 10.1016/j.oregeorev.2016.09.015
[52] Zeng Z G, Ma Y, Wang X Y, et al. Elemental compositions of crab and snail shells from the Kueishantao hydrothermal field in the southwestern Okinawa Trough[J]. Journal of Marine Systems, 2018, 180: 90-101. doi: 10.1016/j.jmarsys.2016.08.012
[53] Kawagucci S, Ueno Y, Takai K, et al. Geochemical origin of hydrothermal fluid methane in sediment-associated fields and its relevance to the geographical distribution of whole hydrothermal circulation[J]. Chemical Geology, 2013, 339: 213-225. doi: 10.1016/j.chemgeo.2012.05.003
[54] Nakagawa S, Takai K, Inagaki F, et al. Variability in microbial community and venting chemistry in a sediment-hosted backarc hydrothermal system: impacts of subseafloor phase-separation[J]. FEMS Microbiology Ecology, 2005, 54(1): 141-155. doi: 10.1016/j.femsec.2005.03.007
[55] Kawagucci S, Chiba H, Ishibashi J I, et al. Hydrothermal fluid geochemistry at the Iheya north field in the mid-Okinawa Trough: implication for origin of methane in subseafloor fluid circulation systems[J]. Geochemical Journal, 2011, 45(2): 109-124. doi: 10.2343/geochemj.1.0105
[56] Kawagucci S, Miyazaki J, Nakajima R, et al. Post-drilling changes in fluid discharge pattern, mineral deposition, and fluid chemistry in the Iheya north hydrothermal field, Okinawa Trough[J]. Geochemistry, Geophysics, Geosystems, 2013, 14(11): 4774-4790. doi: 10.1002/2013GC004895
[57] Kawagucci S. Fluid geochemistry of high-temperature hydrothermal fields in the Okinawa Trough[M]//Ishibashi J I, Okino K, Sunamura M. Subseafloor Biosphere Linked to Hydrothermal Systems: TAIGA Concept. Tokyo: Springer, 2015: 387-403.
[58] Sakai H, Gamo T, Kim E S, et al. Unique chemistry of the hydrothermal solution in the mid-Okinawa Trough backarc basin[J]. Geophysical Research Letters, 1990, 17(12): 2133-2136. doi: 10.1029/GL017i012p02133
[59] Ishibashi J, Sano Y, Wakita H, et al. Helium and carbon geochemistry of hydrothermal fluids from the Mid-Okinawa Trough back arc basin, southwest of Japan[J]. Chemical Geology, 1995, 123(1-4): 1-15. doi: 10.1016/0009-2541(95)00051-M
[60] Zeng Z G, Qin Y S, Zhai S K. Helium, neon and argon isotope compositions of fluid inclusions in massive sulfides from the Jade hydrothermal field, the Okinawa Trough[J]. Acta Oceanologica Sinica, 2004, 23(4): 655-661.
[61] Zeng Z G, Yu S X, Yin X B, et al. Element enrichment and U-series isotopic characteristics of the hydrothermal sulfides at Jade site in the Okinawa Trough[J]. Science in China Series D: Earth Sciences, 2009, 52(7): 913-924. doi: 10.1007/s11430-009-0107-y
[62] Ishibashi J I, Noguchi T, Toki T, et al. Diversity of fluid geochemistry affected by processes during fluid upwelling in active hydrothermal fields in the Izena Hole, the middle Okinawa Trough back-arc basin[J]. Geochemical Journal, 2014, 48(4): 357-369. doi: 10.2343/geochemj.2.0311
[63] Watanabe M, Hoshino K, Shiokawa R, et al. Metallic mineralization associated with pillow basalts in the Yaeyama Central Graben, southern Okinawa Trough, Japan[J]. JAMSTEC Report of Research and Development, 2006, 3: 1-8. doi: 10.5918/jamstecr.3.1
[64] Fukuba T, Noguchi T, Fujii T. The Irabu Knoll: hydrothermal site at the eastern edge of the Yaeyama graben[M]//Ishibashi J I, Okino K, Sunamura M. Subseafloor Biosphere Linked to Hydrothermal Systems: TAIGA Concept. Tokyo: Springer, 2015: 493-496.
[65] Kawagucci S, Toki T, Ishibashi J, et al. Isotopic variation of molecular hydrogen in 20°-375℃ hydrothermal fluids as detected by a new analytical method[J]. Journal of Geophysical Research: Biogeosciences, 2010, 115(G3): G03021.
[66] Kishida K, Sohrin Y, Okamura K, et al. Tungsten enriched in submarine hydrothermal fluids[J]. Earth and Planetary Science Letters, 2004, 222(3-4): 819-827. doi: 10.1016/j.jpgl.2004.03.034
[67] Konno U, Tsunogai U, Nakagawa F, et al. Liquid CO2 venting on the seafloor: Yonaguni knoll IV hydrothermal system, Okinawa Trough[J]. Geophysical Research Letters, 2006, 33(16): L16607. doi: 10.1029/2006GL026115
[68] Suzuki R, Ishibashi J I, Nakaseama M, et al. Diverse range of mineralization induced by phase separation of hydrothermal fluid: case study of the Yonaguni Knoll IV hydrothermal field in the Okinawa Trough back-arc basin[J]. Resource Geology, 2008, 58(3): 267-288. doi: 10.1111/j.1751-3928.2008.00061.x
[69] Wang X Y, Zeng Z G, Chen S, et al. Rare earth elements in hydrothermal fluids from Kueishantao, off northeastern Taiwan: Indicators of shallow-water, sub-seafloor hydrothermal processes[J]. Chinese Science Bulletin, 2013, 58(32): 4012-4020. doi: 10.1007/s11434-013-5849-4
[70] Zeng Z G, Liu C H, Chen C A, et al. Origin of a native sulfur chimney in the Kueishantao hydrothermal field, offshore northeast Taiwan[J]. Science in China Series D: Earth Sciences, 2007, 50(11): 1746-1753. doi: 10.1007/s11430-007-0092-y
[71] Zeng Z G, Chen C T A, Yin X B, et al. Origin of native sulfur ball from the Kueishantao hydrothermal field offshore northeast Taiwan: evidence from trace and rare earth element composition[J]. Journal of Asian Earth Sciences, 2011, 40(2): 661-671. doi: 10.1016/j.jseaes.2010.10.019
[72] Zhang Y X, Zeng Z G, Yin X B, et al. Petrology and mineralogy of pumice from the Iheya North Knoll, Okinawa Trough: implications for the differentiation of crystal‐poor and volatile-rich melts in the magma chamber[J]. Geological Journal, 2018, 53(6): 2732-2745. doi: 10.1002/gj.3106
[73] Zeng Z G, Wang X Y, Chen C T A, et al. Understanding the compositional variability of the major components of hydrothermal plumes in the Okinawa Trough[J]. Geofluids, 2018, 2018: 1536352.
[74] Liu Y S, Hu Z C, Gao S, et al. In situ analysis of major and trace elements of anhydrous minerals by LA-ICP-MS without applying an internal standard[J]. Chemical Geology, 2008, 257(1-2): 34-43. doi: 10.1016/j.chemgeo.2008.08.004
[75] Liu Y S, Zong K Q, Kelemen P B, et al. Geochemistry and magmatic history of eclogites and ultramafic rocks from the Chinese continental scientific drill hole: subduction and ultrahigh-pressure metamorphism of lower crustal cumulates[J]. Chemical Geology, 2008, 247(1-2): 133-153. doi: 10.1016/j.chemgeo.2007.10.016
[76] Sun S S, McDonough W F. Chemical and isotopic systematics of oceanic basalts: implications for mantle composition and processes[J]. Geological Society, London, Special Publications, 1989, 42(1): 313-345. doi: 10.1144/GSL.SP.1989.042.01.19
[77] Bao Z A, Chen L, Zong C L, et al. Development of pressed sulfide powder tablets for in situ sulfur and lead isotope measurement using LA-MC-ICP-MS[J]. International Journal of Mass Spectrometry, 2017, 421: 255-262. doi: 10.1016/j.ijms.2017.07.015
[78] Chen L, Chen K Y, Bao Z A, et al. Preparation of standards for in situ sulfur isotope measurement in sulfides using femtosecond laser ablation MC-ICP-MS[J]. Journal of Analytical Atomic Spectrometry, 2017, 32(1): 107-116. doi: 10.1039/C6JA00270F
[79] Chen K Y, Bao Z A, Liang P, et al. Preparation of sulfur-bearing reference materials for in situ sulfur isotope measurements using laser ablation multicollector inductively coupled plasma-mass spectrometry[J]. Spectrochimica Acta Part B: Atomic Spectroscopy, 2022, 188: 106344. doi: 10.1016/j.sab.2021.106344
[80] Yuan H L, Liu X, Chen L, et al. Simultaneous measurement of sulfur and lead isotopes in sulfides using nanosecond laser ablation coupled with two multi-collector inductively coupled plasma mass spectrometers[J]. Journal of Asian Earth Sciences, 2018, 154: 386-396. doi: 10.1016/j.jseaes.2017.12.040
[81] Turekian K K. Oceans[M]. Englewood Cliffs: Prentice-Hall, 1968.
[82] Ishibashi J I, Urabe T. Hydrothermal activity related to arc-back magmatism in the western Pacific[M]//Taylor B. Backarc Basins: Tectonics and Magmatism. New York: Springer, 1995: 451-495.
[83] Baker E T, Massoth G J, Collier R W, et al. Evidence for high-temperature hydrothermal venting on the Gorda Ridge, northeast Pacific Ocean[J]. Deep Sea Research Part A. Oceanographic Research Papers, 1987, 34(8): 1461-1476. doi: 10.1016/0198-0149(87)90137-3
[84] Hongo Y, Obata H, Gamo T, et al. Rare earth elements in the hydrothermal system at Okinawa Trough back-arc basin[J]. Geochemical Journal, 2007, 41(1): 1-15. doi: 10.2343/geochemj.41.1
[85] Shu Y C, Nielsen S G, Zeng Z G, et al. Tracing subducted sediment inputs to the Ryukyu arc-Okinawa Trough system: evidence from thallium isotopes[J]. Geochimica et Cosmochimica Acta, 2017, 217: 462-491. doi: 10.1016/j.gca.2017.08.035
[86] Yeats C J, Hollis S P, Halfpenny A, et al. Actively forming Kuroko-type volcanic-hosted massive sulfide (VHMS) mineralization at Iheya North, Okinawa Trough, Japan[J]. Ore Geology Reviews, 2017, 84: 20-41. doi: 10.1016/j.oregeorev.2016.12.014
[87] Tivey M K, Stakes D S, Cook T L, et al. A model for growth of steep-sided vent structures on the endeavour segment of the Juan de Fuca Ridge: results of a petrologic and geochemical study[J]. Journal of Geophysical Research: Solid Earth, 1999, 104(B10): 22859-22883. doi: 10.1029/1999JB900107
[88] Marques A F A, Barriga F, Chavagnac V, et al. Mineralogy, geochemistry, and Nd isotope composition of the rainbow hydrothermal field, Mid-Atlantic Ridge[J]. Mineralium Deposita, 2006, 41: 52-67. doi: 10.1007/s00126-005-0040-8
[89] 张春晖, 李景春, 刘斌. 中国银矿床分类[J]. 地质与资源, 2006, 15(3): 238-240 doi: 10.13686/j.cnki.dzyzy.2006.03.014 ZHANG Chunhui, LI Jingchun, LIU Bin. A review on the classification of silver deposits in China[J]. Geology and Resources, 2006, 15(3): 238-240. doi: 10.13686/j.cnki.dzyzy.2006.03.014
[90] Gamo T. Wide variation of chemical characteristics of submarine hydrothermal fluids due to secondary modification processes after high temperature water-rock interaction: a review[M]//Sakai H, Nozaki Y. Biogeochemical Processes and Ocean Flux in the Western Pacific. Tokyo: Terra Scientific Publishing Co (TERRAPUB), 1995: 425-451.
[91] Alt J C. The chemistry and sulfur isotope composition of massive sulfide and associated deposits on Green seamount, eastern Pacific[J]. Economic Geology, 1988, 83(5): 1026-1033. doi: 10.2113/gsecongeo.83.5.1026
[92] Mills R A, Elderfield H. Rare earth element geochemistry of hydrothermal deposits from the active TAG mound, 26°N Mid-Atlantic Ridge[J]. Geochimica et Cosmochimica Acta, 1995, 59(17): 3511-3524. doi: 10.1016/0016-7037(95)00224-N
[93] Shannon R D. Revised effective ionic radii and systematic studies of interatomic distances in halides and chalcogenides[J]. Acta Crystallographica, 1976, A32(5): 751-767.
[94] Rimskaya-Korsakova M N, Dubinin A V. Rare earth elements in sulfides of submarine hydrothermal vents of the Atlantic Ocean[J]. Doklady Earth Sciences, 2003, 389(3): 432-436.
[95] Michard A, Albarède F. The REE content of some hydrothermal fluids[J]. Chemical Geology, 1986, 55(1-2): 51-60. doi: 10.1016/0009-2541(86)90127-0
[96] Klinkhammer G P, Elderfield H, Edmond J M, et al. Geochemical implications of rare earth element patterns in hydrothermal fluids from mid-ocean ridges[J]. Geochimica et Cosmochimica Acta, 1994, 58(23): 5105-5113. doi: 10.1016/0016-7037(94)90297-6
[97] Douville E, Bienvenu P, Charlou J L, et al. Yttrium and rare earth elements in fluids from various deep-sea hydrothermal systems[J]. Geochimica et Cosmochimica Acta, 1999, 63(5): 627-643. doi: 10.1016/S0016-7037(99)00024-1
[98] Schmidt K, Koschinsky A, Garbe-Schönberg D, et al. Geochemistry of hydrothermal fluids from the ultramafic-hosted Logatchev hydrothermal field, 15°N on the Mid-Atlantic Ridge: temporal and spatial investigation[J]. Chemical Geology, 2007, 242(1-2): 1-21. doi: 10.1016/j.chemgeo.2007.01.023
[99] Barrett T J, Jarvis I, Jarvis K E. Rare earth element geochemistry of massive sulfides-sulfates and gossans on the southern Explorer Ridge[J]. Geology, 1990, 18(7): 583-586. doi: 10.1130/0091-7613(1990)018<0583:REEGOM>2.3.CO;2
[100] Gillis K M, Smith A D, Ludden J N. Trace element and Sr-isotopic contents of hydrothermal clays and sulfides from the Snake pit hydrothermal field: ODP site 649[C]//Proceedings of the Ocean Drilling Program, Mid-Atlantic Ridge. St. John: Texas A&M University, 1990: 315-319.
[101] Sverjensky D A. Europium redox equilibria in aqueous solution[J]. Earth and Planetary Science Letters, 1984, 67(1): 70-78. doi: 10.1016/0012-821X(84)90039-6
[102] Schade J, Cornell D H, Theart H F J. Rare earth element and isotopic evidence for the genesis of the Prieska massive sulfide deposit, South Africa[J]. Economic Geology, 1989, 84(1): 49-63. doi: 10.2113/gsecongeo.84.1.49
[103] Wood S A, Williams-Jones A E. The aqueous geochemistry of the rare-earth elements and yttrium 4. Monazite solubility and REE mobility in exhalative massive sulfide-depositing environments[J]. Chemical Geology, 1994, 115(1-2): 47-60. doi: 10.1016/0009-2541(94)90144-9
[104] Haas J R, Shock E L, Sassani D C. Rare earth elements in hydrothermal systems: estimates of standard partial Molal thermodynamic properties of aqueous complexes of the rare earth elements at high pressures and temperatures[J]. Geochimica et Cosmochimica Acta, 1995, 59(21): 4329-4350. doi: 10.1016/0016-7037(95)00314-P
[105] Allen D E, Seyfried W E Jr. REE controls in ultramafic hosted MOR hydrothermal systems: an experimental study at elevated temperature and pressure[J]. Geochimica et Cosmochimica Acta, 2005, 69(3): 675-683. doi: 10.1016/j.gca.2004.07.016
[106] de Baar H J W, Brewer P G, Bacon M P. Anomalies in rare earth distributions in seawater: Gd and Tb[J]. Geochimica et Cosmochimica Acta, 1985, 49(9): 1961-1969. doi: 10.1016/0016-7037(85)90090-0
[107] Piepgras D J, Wasserburg G J. Strontium and neodymium isotopes in hot springs on the east Pacific Rise and Guaymas Basin[J]. Earth and Planetary Science Letters, 1985, 72(4): 341-356. doi: 10.1016/0012-821X(85)90057-3
[108] Langmuir C, Humphris S, Fornari D, et al. Hydrothermal vents near a mantle hot spot: the lucky strike vent field at 37°N on the Mid-Atlantic Ridge[J]. Earth and Planetary Science Letters, 1997, 148(1-2): 69-91. doi: 10.1016/S0012-821X(97)00027-7
[109] Sakai H, Des Marais D J, Ueda A, et al. Concentrations and isotope ratios of carbon, nitrogen and sulfur in ocean-floor basalts[J]. Geochimica et Cosmochimica Acta, 1984, 48(12): 2433-2441. doi: 10.1016/0016-7037(84)90295-3
[110] Alt J C, Anderson T F, Bonnell L. The geochemistry of sulfur in a 1.3 km section of hydrothermally altered oceanic crust, DSDP Hole 504B[J]. Geochimica et Cosmochimica Acta, 1989, 53(5): 1011-1023. doi: 10.1016/0016-7037(89)90206-8
[111] Shanks W C III, Böhlke J K, Seal R R II. Stable isotopes in mid-ocean ridge hydrothermal systems: interactions between fluids, minerals, and organisms[M]//Humphris S E, Zierenberg R A, Mullineaux L S, et al. Seafloor Hydrothermal Systems: Physical, Chemical, Biological, and Geological interactions. Washington: American Geophysical Union, 1995: 194-221.
[112] Alt J C, Shanks W C III. Serpentinization of abyssal peridotites from the MARK area, Mid-Atlantic Ridge: sulfur geochemistry and reaction modeling[J]. Geochimica et Cosmochimica Acta, 2003, 67(4): 641-653. doi: 10.1016/S0016-7037(02)01142-0
[113] Rees C E, Jenkins W J, Monster J. The sulphur isotopic composition of ocean water sulphate[J]. Geochimica et Cosmochimica Acta, 1978, 42(4): 377-381. doi: 10.1016/0016-7037(78)90268-5
[114] Fouquet Y, Knott R, Cambon P, et al. Formation of large sulfide mineral deposits along fast spreading ridges. Example from off-axial deposits at 12°43′N on the east Pacific Rise[J]. Earth and Planetary Science Letters, 1996, 144(1-2): 147-162. doi: 10.1016/0012-821X(96)00142-2
[115] Gamo T, Sakai H, Kim E S, et al. High alkalinity due to sulfate reduction in the CLAM hydrothermal field, Okinawa Trough[J]. Earth and Planetary Science Letters, 1991, 107(2): 328-338. doi: 10.1016/0012-821X(91)90080-2
[116] Takai K, Nakagawa S, Nunoura T. Comparative investigation of microbial communities associated with hydrothermal activities in the Okinawa Trough[M]//Ishibashi J I, Okino K, Sunamura M. Subseafloor Biosphere Linked to Hydrothermal Systems: TAIGA Concept. Tokyo: Springer, 2015: 421-435.
[117] Ueda A, Sakai H. Sulfur isotope study of Quaternary volcanic rocks from the Japanese islands arc[J]. Geochimica et Cosmochimica Acta, 1984, 48(9): 1837-1848. doi: 10.1016/0016-7037(84)90037-1


计量
- 文章访问数: 356
- HTML全文浏览量: 67
- PDF下载量: 57