PALEOCEANOGRAPHIC RECORDS OF INDONESIAN THROUGHFLOW AT ITS EXIT SINCE THE LAST GLACIAL AND THEIR SIGNIFICANCE
-
摘要: 印尼穿越流作为连接西太平洋和印度洋的唯一通道,调节着这两个大洋之间的热量和水汽的交换,继而在热带乃至全球气候变化中扮演着重要的角色。本文对来自于帝汶海内印尼穿越流出口处SO18460钻孔中浮游有孔虫Globigerinoides ruber和Pulleniatina obliquiloculata 壳体的Mg/Ca比值和氧同位素进行再分析,重建了末次冰期以来表层和温跃层海水温度、盐度以及温跃层深度的变化,并将其与区域古气候记录对比以探讨其意义。结果表明,末次冰期以来,SO18460孔的表层和温跃层海水盐度均与区域降雨量记录变化一致,显示降雨信号以海水盐度的形式通过水体混合由表层向温跃层的传输。自早全新世以来,SO18460孔的表层海水温度在28 ℃左右波动,可能是受西太平洋暖池的影响;同时,温跃层海水温度始终低于22 ℃可能指示厄尔尼诺-南方涛动处于类厄尔尼诺状态;而温跃层海水温度持续下降、温跃层深度持续变浅,一方面可能是对早全新世以来类厄尔尼诺事件频发的响应,另一方面也可能归因于热带辐合带的南向移动导致区域降雨增加、以及东亚冬季风驱使南海表层流的加强等因素对印尼穿越流表层流的抑制。冰期-间冰期尺度上,SO18460孔温跃层海水温度与北半球夏季太阳辐射量变化步幅一致,可能是北太平洋热带水借助棉兰老岛流在苏拉威西海混入印尼穿越流所致。Abstract: The Indonesian Throughflow (ITF), sole conduit between the Pacific and Indian Oceans, plays an important role in regulating heat and fresh water budgets between the two oceans, and in controlling the tropical and global climate. In this study, we investigated records from the Core SO18460 that was drilled at the exit of the ITF into the Timor Sea to reexamine their significance in reflecting the ITF since the last glacial. Records of temperature and salinity of surface and subsurface seawaters, and depth of thermocline (DOT) were reconstructed from δ18O and Mg/Ca ratio of the planktonic foraminifera of Globigerinoides ruber and Pulleniatina obliquiloculata and were then compared with regional paleoclimatic indices. The results show that salinity of both surface and thermocline seawaters co-varied with regional precipitation over the last glacial cycle, likely indicating transmission of precipitation signal by means of seawater salinity from sea surface to thermocline through upper ocean mixing. Sea surface temperature at the coring site of Core SO18460 oscillated centering at 28 ℃, possibly under influence of the Western Pacific Warm Pool since the early Holocene. In contrast, thermcoline seawater temperature (TWT) was always below 22 ℃, probably indicating that El Niño-Southern Oscillation was located in El Niño-like episodes. Decline of TWT and shoal of DOT might be, on the one hand, in response to more frequent El Niño-like events; and on the other hand, resulted from depression of ITF surface flow caused by increased precipitation due to southward shift of the Intertropical Convergence Zone, and/or by intensification of South China Sea surface flow driven by enhanced East Asian winter monsoon during Holocene. On glacial-interglacial timescale, TWT co-varied with the boreal summer insolation, possibly due to influence of North Pacific Tropical Water sourced waters that were carried by the Mindanao Current to the Sulawesi Sea and merged into the ITF.
-
作为太平洋和印度洋之间的唯一通道,印尼穿越流(Indonesian Throughflow;ITF)每年输送大量的热和低盐水从太平洋进入印度洋[1-3]。从影响范围上来看,ITF不仅仅作用于太平洋和印度洋,其作用范围也会延伸至南大洋,从而对全球范围内的大洋循环造成影响[2]。ITF与大气间存在着大量的热量和水汽交换,不但受到印度洋-太平洋暖池(Indo-Pacific Warm Pool;IPWP)范围内气候的影响,也反过来影响着IPWP的气候[1-3]。在20世纪70年代中期,热带太平洋和印度洋气候机制的转变可能是由于全球变暖造成的[4],从一定程度上说明了ITF在全球气候变化中的重要性,同时也说明ITF可能与季风和厄尔尼诺-南方涛动(El Niño-Southern Oscillation;ENSO)等气候现象之间有着紧密的联系。
厄尔尼诺事件发生时,西向的信风减弱,造成西太平洋区域的温跃层深度(depth of thermocline;DOT)变浅,表层的暖水向中太平洋以及东太平洋移动。在这种情况下,ITF的温跃层海水温度(thermocline seawater temperature;TWT)明显降低,流量减弱;厄尔尼诺事件的发生,也同样会诱使低盐度的南海表层水通过苏禄海进入望家锡海峡北部,继而抑制ITF表层流的南向移动,DOT变浅[5]。拉尼娜事件发生时则会出现相反的现象,即:西太平洋区域的DOT变深,TWT升高,ITF流量增强[2, 6, 7]。此外,北半球冬季时,在东亚冬季风的驱动下,低盐度的南海表层水通过爪哇海峡进入望家锡海峡南部,ITF的表层流受到抑制,次表层流加强,DOT变浅;夏季时,ITF的表层流则比较顺畅地通过望家锡海峡、并随后进入印度洋,相应地,ITF次表层流减弱[1, 8]。
帝汶海作为ITF的主要出口,是调查ITF水文变化的一个理想的区域。本文对来自帝汶海东缘SO18460钻孔的记录进行再分析,重建了末次冰期以来ITF的古海洋学变化,并将其与区域古气候记录进行对比,探讨其与东亚季风以及ENSO等气候现象之间的关系。
1. 材料与方法
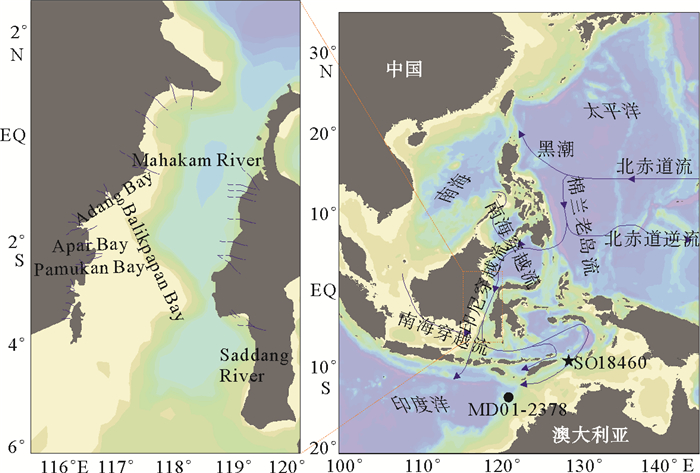
SO18460站(8.79°S、128.64°E,水深1 875 m)位于帝汶海帝汶岛东南方向(图 1)。该站钻孔来源于德国“太阳号”于2005年实施的“印尼穿越流变化和澳大利亚气候历史”的专题航次。
![]() 图 1 SO18460钻孔站位及研究区主要洋流分布(插图内的蓝色虚线代表位于望家锡海峡两侧的河流的大致延伸方向)Figure 1. Coring site of Core SO18460 and distribution of main ocean currents in the studied region(Approximate extensions of rivers into the Makassar Strait are indicated by blue dashed lines and shown in the inset map)
图 1 SO18460钻孔站位及研究区主要洋流分布(插图内的蓝色虚线代表位于望家锡海峡两侧的河流的大致延伸方向)Figure 1. Coring site of Core SO18460 and distribution of main ocean currents in the studied region(Approximate extensions of rivers into the Makassar Strait are indicated by blue dashed lines and shown in the inset map)浮游有孔虫Globigerinoides ruber和Pulleniatina obliquiloculata 壳体的稳定同位素分析测试在德国基尔大学莱布尼兹实验室进行[9]。具体步骤为:从粒径为250~315 μm的样品组分中分别挑选出G. ruber和P. obliquiloculata壳体各20枚,将破碎后的壳体加入超纯乙醇在频率为40 kHz的超声波中清洗3 s。清洗完毕后,将样品放入60 ℃的烘箱中烘干,之后转移到碳酸盐制样装置中(Kiel Ⅰ型),与原磷酸在70 ℃下反应产生二氧化碳,将收集的二氧化碳气体转移到Finnigan MAT251型稳定同位素质谱仪中测定氧碳同位素的比值。
壳体的Mg/Ca比值分析在德国基尔大学地球科学系进行[9]。从粒径为250~315 μm的样品组分中分别挑选出G. ruber和P. obliquiloculata壳体各30枚,将挑选好的样品称重、压碎,按照Martin和Lea(2002)[10]的清洗流程(包含了还原步骤)去除壳体上的污染物,之后在ICP-OES上进行测试。
SO18460孔末次冰期以来的年龄框架基于8个AMS 14C测年点。之后,遵循Fairbanks等(2005)[11]的方法将测得的样品年龄转化为日历年龄(表 1)。最后,将这些测年点进行插值得到SO18460孔25 ka以来完整的时间序列。
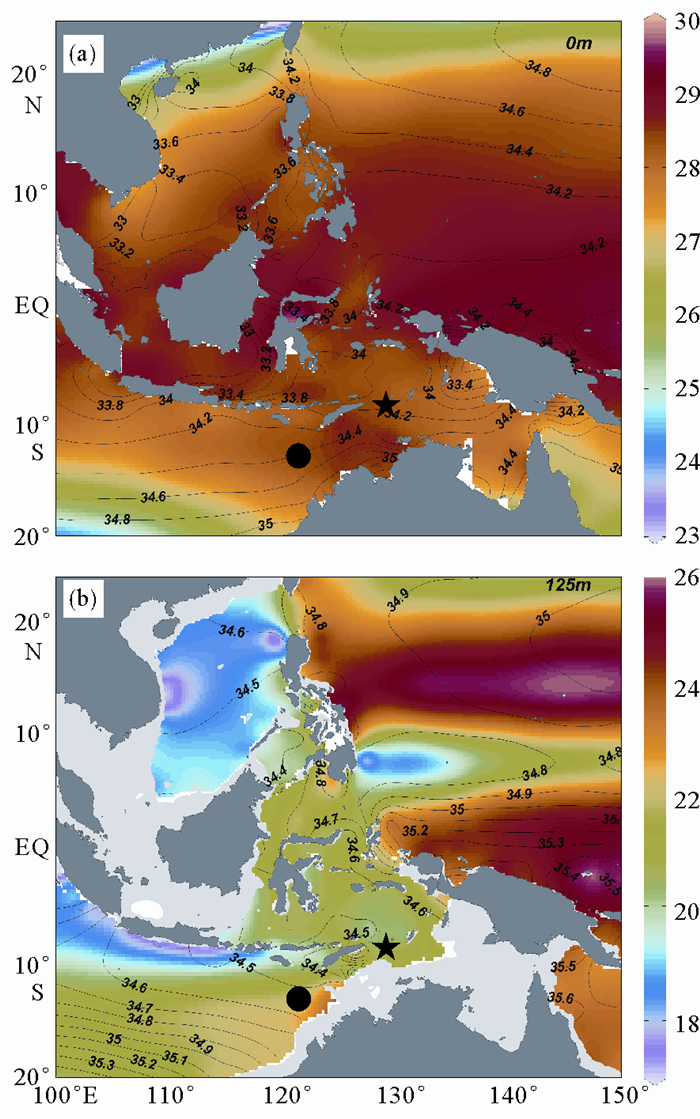
Lab code 深度/cm 14C年龄/aBP 日历年龄/aBP KIA 30820 10 905±25 595±33 KIA 33791 100 5 170±35 5 604±24 KIA 30821 200 11 050 ±50 12677±49 KIA 33792 240 13 990±70 15 935±134 KIA 30822 320 18 370±100 21 469±177 KIA 30823 350 19 800±120 23 256±215 KIA 30824 390 21 810±140 25 847±235 KIA 30825 420 23 720±190 28 082±255 本文选择Anand等(2003)[13]350~500 μm粒径G. ruber的关系式(Mg/Ca= 0.395exp(SST×0.09))将SO18460孔的G. ruber Mg/Ca比值转换为海水表层温度(sea surface temperature;SST),Xu等(2010)[12]认为在帝汶海区该关系式能够更为准确地恢复SST。利用该关系式获得的钻孔顶部沉积样品中G. ruber Mg/Ca比值对应的SST为28.01 ℃,与该钻孔站位处的现代SST(28.37 ℃)(图 2a)基本一致。对于P. obliquiloculata Mg/Ca比值,本文利用Anand等(2003)[13] 350~500 μm粒径P. obliquiloculata的关系式(Mg/Ca= 0.328exp(TWT×0.09))将其转化为TWT。利用该关系式获得的钻孔顶部沉积样品中P. obliquiloculata Mg/Ca比值对应的TWT为20.54 ℃,也与该钻孔站位处的现代TWT(20.18 ℃)基本一致(图 2b)。之后本文利用Bemis等(1998)[14]的δ18O-T关系式(δ18Osw(VSMOW)=0.27+(T-16.5+4.8×δ18O壳体(VPDB))/4.8)分别计算出表层及温跃层海水的δ18O,即δ18Osw。利用该式计算出的δ18Osw已经校正了浮游有孔虫壳体与海水间氧同位素分馏的温度效应,因此,δ18Osw主要包含了全球冰量变化引起的海水δ18O变化与当地海水盐度变化引起的海水δ18O变化。按照Waelbroeck等(2002)[15]对δ18Osw进行了冰量校正,校正过后的δ18Osw(δ18Osw-corr)主要反映了当地海水盐度的变化(图 3e和3f)。
![]() (图件通过Ocean Data View软件[18]制作, 温度(℃)以颜色标识,盐度(psu)以等值线标识。黑色五角星和圆点分别指示SO18460站和MD01-2378站站位)Figure 2. Distribution of modern surface (a) and subsurface (b) seawater temperature[16] and salinity[17] in the studied region(This figure was plotted using the Ocean Data View software[18]. Color shading represents temperature (℃), and isoline denotes salinity (psu). The black-colored star and filled circle denotes coring sites of Cores SO18460 and MD01-2378, respectively)
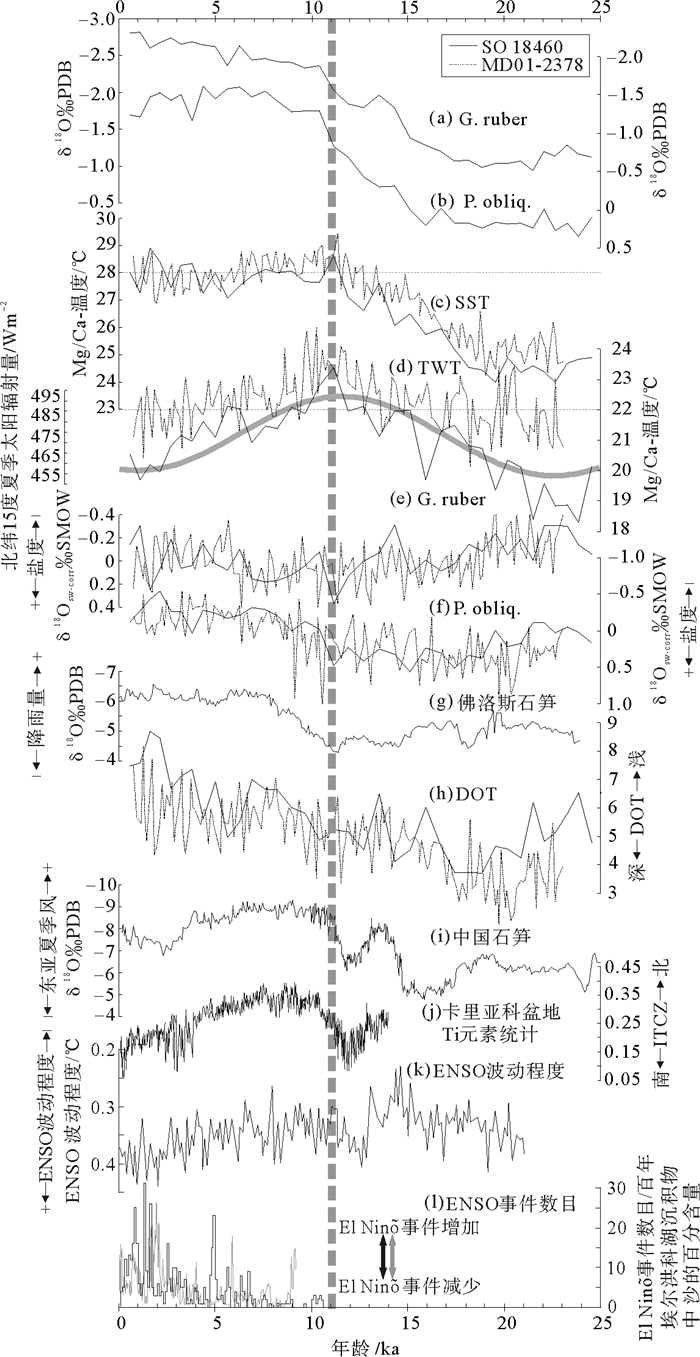
(图件通过Ocean Data View软件[18]制作, 温度(℃)以颜色标识,盐度(psu)以等值线标识。黑色五角星和圆点分别指示SO18460站和MD01-2378站站位)Figure 2. Distribution of modern surface (a) and subsurface (b) seawater temperature[16] and salinity[17] in the studied region(This figure was plotted using the Ocean Data View software[18]. Color shading represents temperature (℃), and isoline denotes salinity (psu). The black-colored star and filled circle denotes coring sites of Cores SO18460 and MD01-2378, respectively)![]() 图 3 末次冰期以来帝汶海区SO18460孔[9]与MD01-2378孔古海洋学记录[19]、中国、佛洛瑞斯石笋氧同位素[25, 44, 45]、卡里亚科盆地Ti元素统计[41]、ENSO波动程度[33]以及ENSO事件记录对比[30, 32](灰色曲线代表北纬15度处夏季(六月)太阳辐射量,两条灰色水平虚线分别指示了28 ℃和22 ℃。灰色垂向虚线表示时间为~11 ka)Figure 3. Comparison of paleoceanographic records from Cores SO18460[9] and MD01-2378[19], China and Flores stalagmite δ18O records[25, 44-45], Cariaco Basin Ti counts[41], ENSO variability[33] and number of ENSO events[30, 32] since the last glacial(Grey curve denotes summer (June) insolation at 15 °N; Grey horizontal dotted lines indicate 28 ℃ and 22 ℃, respectively. Vertical grey dotted line denotes ~11 ka)
图 3 末次冰期以来帝汶海区SO18460孔[9]与MD01-2378孔古海洋学记录[19]、中国、佛洛瑞斯石笋氧同位素[25, 44, 45]、卡里亚科盆地Ti元素统计[41]、ENSO波动程度[33]以及ENSO事件记录对比[30, 32](灰色曲线代表北纬15度处夏季(六月)太阳辐射量,两条灰色水平虚线分别指示了28 ℃和22 ℃。灰色垂向虚线表示时间为~11 ka)Figure 3. Comparison of paleoceanographic records from Cores SO18460[9] and MD01-2378[19], China and Flores stalagmite δ18O records[25, 44-45], Cariaco Basin Ti counts[41], ENSO variability[33] and number of ENSO events[30, 32] since the last glacial(Grey curve denotes summer (June) insolation at 15 °N; Grey horizontal dotted lines indicate 28 ℃ and 22 ℃, respectively. Vertical grey dotted line denotes ~11 ka)需要注意的是,SO18460孔中的有孔虫样品在进行Mg/Ca测试前使用了带有还原步骤的清洗方法,而Anand等(2003)的方程则来自于没有还原步骤处理的样品。因此,在将SO18460孔中的G. ruber和P. obliquiloculata Mg/Ca比值转换为温度前,本文按照Xu等(2008)[19]的方法分别对G. ruber和P. obliquiloculata的Mg/Ca比值进行了6.6%和1.8%的校正。
2. 结果与讨论
2.1 浮游有孔虫氧同位素冰期-间冰期差异
SO18460孔G. ruber壳体δ18O整体上呈现冰期-间冰期变化。末次冰盛期(Last Glacial Maximum;LGM)(18~22 ka)时G. ruber壳体δ18O最重,约为-1.02 ‰;25~16 ka期间,变化非常平缓,平均值为-1.10±0.1 ‰;16~10.4 ka间开始变轻,变化幅度为1.24‰,到~10.4 ka时达到-2.36‰(图 3a)。从10.4 ka开始直到晚全新世,G. ruber壳体δ18O继续变轻,但小于16~10.4 ka期间的变化幅度,约为0.37‰。在晚全新世时,G. ruber壳体δ18O为-2.73‰(图 3a)。整体来说,从LGM到全新世,G. ruber壳体δ18O的平均变化幅度达1.56‰(图 3a),高于全球冰量变化引起的变化值1.0‰~1.1‰[15, 20]。
P. obliquiloculata壳体δ18O的变化趋势与G. ruber的基本保持一致,同样呈现出冰期-间冰期变化。最明显的不同在于10.4 ka之后直到晚全新世,P. obliquiloculata壳体δ18O不像G. ruber壳体δ18O一样保持变轻趋势,而是维持在-1.42±0.14 ‰(图 3b)。在25~16 ka期间,P. obliquiloculata壳体δ18O基本保持不变,平均值为0.17±0.1‰;16~10.4 ka,出现类似于G. ruber壳体δ18O的变轻,其幅度约为1.46‰。在~10.4 ka时,P. obliquiloculata壳体δ18O大约为-1.29‰(图 3b)。整体来说,全新世与LGM间,P. obliquiloculata壳体δ18O的变化幅度比G. ruber的大,达到1.59‰(图 3b),同样高于全球冰量变化引起的变化值1.0‰~1.1‰[15, 20]。
2.2 表层海水温度和盐度的变化及其影响因素
如图 3c所示,末次冰期时,SO18460孔的SST大约为24 ℃;从末次冰期开始直至早全新世,SO18460孔的SST上升了~3.5 ℃,这与附近海区记录的冰期-间冰期温差几乎一致,如:望加锡海峡内MD98-2162孔~3.3 ℃[21]、西太平洋中心区域3cBX孔~3.2 ℃[22]、西太平中心区域ODP806B孔~4 ℃[23]以及帝汶海区MD01-2378孔~3.2 ℃[19]。早全新世之后直至晚全新世,SO18460孔的SST一直维持在28 ℃左右(图 3c)。Yan等(1992)[24]以28 ℃的SST等值线界定现代西太平洋暖池的范围,由此,针对全球冰量的差异可以忽略不计的早全新世到晚全新世这个时段,我们推测SO18460站如同现今的情况一样,位于暖池范围内,类似于同样位于帝汶海区的MD01-2378站(图 3c)[19]。末次冰期时,一方面,全球冰量扩大、海平面下降,热带海区的SST降低约3~4 ℃[19, 21-23],很显然,28 ℃等温线已经不再适应于界定暖池的范围;另一方面,由于冰期时海平面下降导致印尼海区部分、以及南海南部如巽他陆架等区域的出露,必然会改变海盆的面貌和洋流的格局,暖池的定义或许不能只依赖于海水温度的范围。因此,对末次冰期时暖池范围的界定,需要更深入的工作。此外,末次冰期至早全新世SO18460孔的SST与北半球夏季太阳辐射量变化趋势一致;自11 ka开始,北半球夏季太阳辐射量减少,但SO18460孔的SST却始终维持在28 ℃左右。这个现象可能指示,冰期旋回中SO18460孔的SST与太阳辐射量影响下的冰期-间冰期气候交替密切相关;而当SO18460孔位于暖池范围内时,其SST主要受到西太平洋暖池的影响。
图 3e和3g显示,弗洛瑞斯(Flores)石笋[25]记录的25 ka以来的降雨量与SO18460孔的表层海水盐度(surface seawater salinity;SSS)的变化基本一致。这可能表明,在印尼群岛存在着一个区域性的降水模式,SO18460孔的SSS变化受控于区域降雨量。从25 ka到大约11 ka期间,随着区域降雨量的逐渐减少,SO18460孔的SSS出现了一定程度的上升。自~11 ka开始直至晚全新世,SO18460孔的SSS随着区域降雨量的逐渐增加而减小(图 3e和3g)。值得注意的是,SO18460孔的温跃层海水盐度和SSS一样,也与区域降雨量的变化保持一致(图 3f和3g)。我们将其归因于ITF区域内强烈的潮汐和风力作用造成上部水体的混合[26],区域降雨量的信号以海水盐度的形式由表层水体向温跃层水体传递。末次冰期以来MD01-2378孔的表层及温跃层海水盐度的变化与SO18460孔的记录基本一致(图 3e和3f),支撑了上述区域性降水模式的推测。
2.3 温跃层海水温度和温跃层深度的变化及其影响因素
SO18460孔的TWT在末次冰期时大约为19.5 ℃,之后逐渐上升,直至11 ka达到最高值(~23.5 ℃),其冰期-间冰期差异约为4 ℃(图 3d);相比较,11 ka之后直至晚全新世TWT持续下降,到晚全新世时为~20 ℃,下降的幅度为3.5 ℃(图 3d)。现代水文资料显示,帝汶海区多年平均的、以及拉尼娜气候状态下的TWT基本位于22 ℃以上,只有在厄尔尼诺事件发生时帝汶海区的TWT才会低于(或等于)22 ℃[27, 28]。因此,11 ka之后SO18460孔的TWT始终处于22 ℃以下(图 3d),可能指示早至晚全新世ENSO处于类厄尔尼诺状态,与全新世厄尔尼诺事件数量呈逐渐增加的趋势一致[29-33](图 3l; 3k)。对于MD01-2378孔而言,其TWT在11 ka之后开始降低,并基本维持在22 ℃左右波动,同样指示了早至晚全新世ENSO处于类厄尔尼诺状态。但MD01-2378孔的TWT始终高于SO18460孔,这可能是MD01-2378孔的TWT受澳大利亚沿岸暖流的影响所致(图 2b)。
冰期-间冰期时间尺度上,SO18460孔的TWT与北半球夏季太阳辐射量变化步幅一致(图 3d)。北太平洋热带水形成于北太平洋的中心(10°~25°N, 140°E~160°W),深度大约为50~300 m,最显著的特征是盐度高于34.75 psu[34]。它是由于区域表层海水的蒸发量超过降雨量,使得表层海水的盐度增加,从而下沉所形成[35, 36]。因此,北太平洋热带水的温度应受北半球夏季太阳辐射量的影响。北太平洋热带水被北赤道流带到菲律宾海后,在菲律宾海出现分支,一支向北形成黑潮,另一支向南形成棉兰老岛流。跟随棉兰老岛流向南流动的北太平洋热带水进入苏拉威西海并成为ITF的一部分[35, 37]。SO18460孔位于ITF的出口处,可能捕捉到混入ITF的北太平洋热带水的信号,使得该孔的TWT与北半球夏季太阳辐射量变化步幅一致(图 3d)。这一点从MD01-2378孔的TWT的变化上也可以得到佐证(图 3h)。
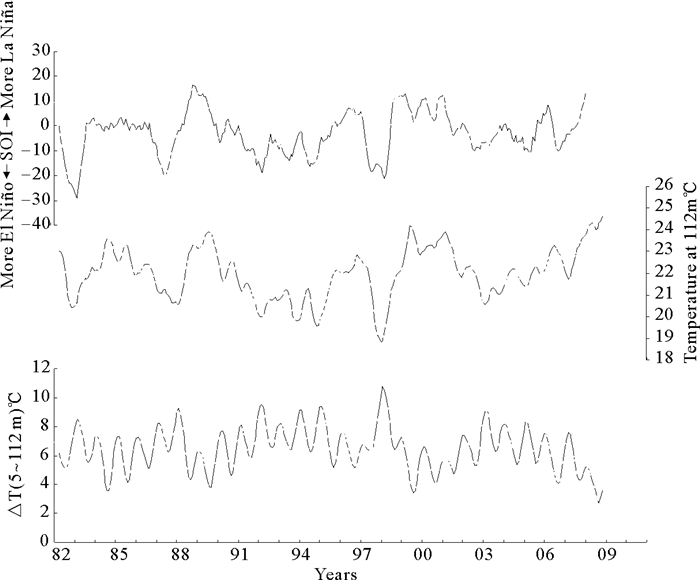
许多研究用表层与温跃层海水温度的差异(ΔT)来追踪DOT的变化[19, 22, 27, 38-40]。图 4中的现代水温资料显示,在SO18460站位,月平均温跃层海水温度(112 m)以及ΔT(5~112 m)的变化与南方涛动指数(Southern Oscillation Index;SOI)之间有着紧密的联系。SOI是东太平洋大溪地岛与西太平洋达尔文岛之间的海平面气压异常值,这个指数有效的反映了太平洋东西两侧气压增强和减弱的演变情况。当SOI为持续性正值时,表明大溪地比达尔文气压偏高的程度超过了正常情况,指示了拉尼娜现象;当SOI为持续性负值时,则表明大溪地气压低于达尔文,指示了厄尔尼诺现象。图 4表明了厄尔尼诺事件发生时,SO18460孔的TWT下降、温跃层变浅;拉尼娜现象出现时,SO18460孔的TWT上升、温跃层变深。自11 ka至晚全新世,SO18460站的DOT持续变浅(图 3h),与MD01-2378站的变化基本一致(图 3h)[19]。综上,11 ka之后SO18460孔TWT的持续下降、DOT的持续变浅(图 3d和3h)可能归因于类厄尔尼诺状态的频发[29-33]。
![]() 图 4 1982—2009年间SO18460站位处月平均次表层海水温度(112m)、表层(5m)和次表层(112m)海水间的温度梯度(ΔT)与南方涛动指数(Southern Ocean Index, SOI)对比(温度数据来自于http://iridl.ldeo.columbia.edu/SOURCES/.CARTONGIESE/.SODA/.v2p0p2-4/;SOI数据来自于http://www.cpc.ncep.noaa.gov/data/indices/sstoi.indices)Figure 4. Comparison of Southern Ocean Index (SOI) with monthly averaged TWT and temperature gradient (ΔT) between the sea surface (5 m) and the subsurface (112 m) at site SO18460 in 1982—2009
图 4 1982—2009年间SO18460站位处月平均次表层海水温度(112m)、表层(5m)和次表层(112m)海水间的温度梯度(ΔT)与南方涛动指数(Southern Ocean Index, SOI)对比(温度数据来自于http://iridl.ldeo.columbia.edu/SOURCES/.CARTONGIESE/.SODA/.v2p0p2-4/;SOI数据来自于http://www.cpc.ncep.noaa.gov/data/indices/sstoi.indices)Figure 4. Comparison of Southern Ocean Index (SOI) with monthly averaged TWT and temperature gradient (ΔT) between the sea surface (5 m) and the subsurface (112 m) at site SO18460 in 1982—2009除此之外,还有两个可能的因素会导致SO18460孔的TWT持续下降、DOT持续变浅。其一,理论上,11 ka之后随着类厄尔尼诺现象的增加,印尼群岛区域降雨量应相对减少,但是佛洛瑞斯石笋记录却显示印尼群岛区域降雨量在11 ka之后开始增加(图 3g)。11 ka之后,随着热带辐合带(Intertropical Convergence Zone;ITCZ)逐渐向南移动[41](图 3j),印尼群岛降雨量逐渐增加(图 3g),大量的淡水通过位于望家锡海峡两侧的河流(包括萨当河、马坎哈河等)(图 1)进入望家锡海峡,导致表层海水盐度变淡。淡化的表层海水将抑制来自西太平洋的表层水通过望家锡海峡进入印度洋,继而造成次表层流加强[1]。11 ka之后SO18460孔TWT持续下降、DOT持续变浅可能缘于此机理。其二,在冰消期全球变暖的背景下,全球海平面持续上升,~9.5 ka时爪哇海峡贯通[42, 43];同时,大约9.5 ka之后东亚冬季风逐渐增强,夏季风逐渐减弱[44, 45](图 3i)。冬季风驱使较淡的南海表层水通过爪哇海峡进入望家锡海峡南部[1, 7],同样会阻止来自西太平洋的表层水通过望家锡海峡进入印度洋,这也可能是造成SO18460孔TWT持续下降、DOT持续变浅的因素(图 3d和3h)。
3. 结论
本文研究结果显示,11 ka以来帝汶海区SO18460孔的SST一直在28 ℃左右波动,与现今的状况类似,表明该孔在整个全新世可能一直受西太平洋暖池的影响。末次冰期到晚全新世,SO18460孔的表层及温跃层海水盐度变化与弗洛瑞斯石笋记录的降雨量变化一致,可能指示印尼群岛区域降雨量的信号以海水盐度的形式通过水体混合由表层向温跃层的传输。11 ka以来SO18460孔TWT始终低于22 ℃,可能指示ENSO处于类厄尔尼诺状态,这一点与全新世厄尔尼诺事件数量呈逐渐增加的趋势一致。而11 ka以来,SO18460孔TWT持续降低、DOT持续变浅则可能归因于厄尔尼诺时间的频发。此外,造成全新世SO18460孔TWT降低、DOT变浅的可能因素还包括:与ITCZ南移相关的印尼群岛降雨量的增加、以及冬季风驱使的南海表层流的加强等等。冰期-间冰期时间尺度上,SO18460孔的TWT与北半球夏季太阳辐射量变化步幅一致,可能是北太平洋热带水混入ITF所致。
致谢: 感谢德国基尔大学Ann Holbourn博士和Wolfgang Kuhnt教授对本文提供的帮助及支持,感谢编辑和审稿人富有建设性的建议和宝贵的意见。 -
![]()
图 1 SO18460钻孔站位及研究区主要洋流分布
(插图内的蓝色虚线代表位于望家锡海峡两侧的河流的大致延伸方向)
Figure 1. Coring site of Core SO18460 and distribution of main ocean currents in the studied region
(Approximate extensions of rivers into the Makassar Strait are indicated by blue dashed lines and shown in the inset map)
![]()
图 2 研究区现代表层(a)、次表层(b)海水温度[16]和盐度[17]分布图
(图件通过Ocean Data View软件[18]制作, 温度(℃)以颜色标识,盐度(psu)以等值线标识。黑色五角星和圆点分别指示SO18460站和MD01-2378站站位)
Figure 2. Distribution of modern surface (a) and subsurface (b) seawater temperature[16] and salinity[17] in the studied region
(This figure was plotted using the Ocean Data View software[18]. Color shading represents temperature (℃), and isoline denotes salinity (psu). The black-colored star and filled circle denotes coring sites of Cores SO18460 and MD01-2378, respectively)
![]()
图 3 末次冰期以来帝汶海区SO18460孔[9]与MD01-2378孔古海洋学记录[19]、中国、佛洛瑞斯石笋氧同位素[25, 44, 45]、卡里亚科盆地Ti元素统计[41]、ENSO波动程度[33]以及ENSO事件记录对比[30, 32]
(灰色曲线代表北纬15度处夏季(六月)太阳辐射量,两条灰色水平虚线分别指示了28 ℃和22 ℃。灰色垂向虚线表示时间为~11 ka)
Figure 3. Comparison of paleoceanographic records from Cores SO18460[9] and MD01-2378[19], China and Flores stalagmite δ18O records[25, 44-45], Cariaco Basin Ti counts[41], ENSO variability[33] and number of ENSO events[30, 32] since the last glacial
(Grey curve denotes summer (June) insolation at 15 °N; Grey horizontal dotted lines indicate 28 ℃ and 22 ℃, respectively. Vertical grey dotted line denotes ~11 ka)
![]()
图 4 1982—2009年间SO18460站位处月平均次表层海水温度(112m)、表层(5m)和次表层(112m)海水间的温度梯度(ΔT)与南方涛动指数(Southern Ocean Index, SOI)对比
(温度数据来自于http://iridl.ldeo.columbia.edu/SOURCES/.CARTONGIESE/.SODA/.v2p0p2-4/;SOI数据来自于http://www.cpc.ncep.noaa.gov/data/indices/sstoi.indices)
Figure 4. Comparison of Southern Ocean Index (SOI) with monthly averaged TWT and temperature gradient (ΔT) between the sea surface (5 m) and the subsurface (112 m) at site SO18460 in 1982—2009
Lab code 深度/cm 14C年龄/aBP 日历年龄/aBP KIA 30820 10 905±25 595±33 KIA 33791 100 5 170±35 5 604±24 KIA 30821 200 11 050 ±50 12677±49 KIA 33792 240 13 990±70 15 935±134 KIA 30822 320 18 370±100 21 469±177 KIA 30823 350 19 800±120 23 256±215 KIA 30824 390 21 810±140 25 847±235 KIA 30825 420 23 720±190 28 082±255  下载: 导出CSV
-
[1] Gordon A L, Susanto R D, Vranes K. Cool Indonesian throughflow as a consequence of restricted surface layer flow[J]. Nature, 2003, 425(6960): 824-828. doi: 10.1038/nature02038
[2] Gordon A L. Oceanography of the Indonesian seas and their throughflow[J]. Oceanography, 2005, 18(4): 14-27. doi: 10.5670/oceanog.2005.01
[3] Sprintall J, Wijffels S E, Molcard R, et al. Direct estimates of the Indonesian throughflow entering the Indian Ocean: 2004-2006[J]. Journal of Geophysical Research, 2009, 114(C7): C07001. doi: 10.1029/2008JC005257
[4] Trenberth K E. Recent observed interdecadal climate changes in the northern hemisphere[J]. Bulletin of the American Meteorological Society, 1990, 71(7): 988-993. doi: 10.1175/1520-0477(1990)071<0988:ROICCI>2.0.CO;2
[5] Gordon A L, Huber B A, Metzger E J, et al. South China Sea throughflow impact on the Indonesian throughflow[J]. Geophysical Research Letters, 2012, 39(11): L11602, doi: 10.1029/2012GL052021.
[6] Lee T, Fukumori I, Menemenlis D, et al. Effects of the Indonesian throughflow on the Pacific and Indian oceans[J]. Journal of Physical Oceanography, 2002, 32(5): 1404-1429. doi: 10.1175/1520-0485(2002)032<1404:EOTITO>2.0.CO;2
[7] Song Q, Vecchi G A, Rosati A J. The role of the indonesian throughflow in the Indo-Pacific climate variability in the GFDL coupled climate model[J]. Journal of Climate, 2007, 20(11): 2434-2451. doi: 10.1175/jcli4133.1
[8] Qu T D, Du Y, Strachan J, et al. Sea surface temperature and its variability in the Indonesian region[J]. Oceanography, 2005, 18(4): 50-61. doi: 10.5670/oceanog.2005.05
[9] Holbourn A, Kuhnt W, Xu J. Indonesian throughflow variability during the last 140 Ka: the Timor sea outflow[J]. Geological Society, London, Special Publications, 2011, 355(1): 283-303, doi: 10.1144/SP355.14.
[10] Martin P A, Lea D W. A simple evaluation of cleaning procedures on fossil benthic foraminiferal Mg/Ca[J]. Geochemistry, Geophysics, Geosystems, 2002, 3(10): 8401, doi: 10.1029/2001GC000280.
[11] Fairbanks R G, Mortlock R A, Chiu T C, et al. Marine radiocarbon calibration curve spanning 0 to 50, 000 years BP based on paired 230Th/234U/238U and 14C dates on pristine corals[J]. Quaternary Science Reviews, 2005, 24(16-17): 1781-1796. doi: 10.1016/j.quascirev.2005.04.007
[12] Xu J, Kuhnt W, Holbourn A, et al. Indo-Pacific Warm Pool variability during the Holocene and Last Glacial Maximum[J]. Paleoceanography, 2010, 25(4): PA4230, doi: 10.1029/2010PA001934.
[13] Anand P, Elderfield H, Conte M H. Calibration of Mg/Ca thermometry in planktonic foraminifera from a sediment trap time series[J]. Paleoceanography, 2003, 18(2): 1050, doi: 10.1029/2002PA000846.
[14] Bemis B E, Spero H J, Bijma J, et al. Reevaluation of the oxygen isotopic composition of planktonic foraminifera: experimental results and revised paleotemperature equations[J]. Paleoceanography, 1998, 13(2): 150-160. doi: 10.1029/98PA00070
[15] Waelbroeck C, Labeyrie L, Michel E, et al. Sea-level and deep water temperature changes derived from benthic foraminifera isotopic records[J]. Quaternary Science Reviews, 2002, 21(1-3): 295-305, doi: 10.1016/S0277-3791(01)00101-9.
[16] Locarnini R A, Mishonov A V, Antonov J I, et al. World ocean atlas 2009, volume 1: temperature[M]//Levitus S. NOAA Atlas NESDIS 68. Washington, DC: U.S. Government Printing Office, 2010: 184.
[17] Antonov J I, Seidov D, Boyer T P, et al. World ocean atlas 2009, volume 2: salinity[M]//Levitus S. NOAA Atlas NESDIS 69. Washington, DC: U.S. Government Printing Office, 2010: 184.
[18] Schlitzer R. Ocean data view: Version 4.6.2[CP/OL]. (2014-03-31). http://odv.awi.de.
[19] Xu J, Holbourn A, Kuhnt W, et al. Centennial changes in the thermocline structure of the Indonesian outflow during terminations Ⅰ and Ⅱ[J]. Earth and Planetary Science Letters, 2008, 273(1-2): 152-162, doi: 10.1016/j.epsl.2008.06.029.
[20] Labeyrie L D, Duplessy J C, Blanc P L. Variations in mode of formation and temperature of oceanic deep waters over the past 1250, 000 years[J]. Nature, 1987, 327(6122): 477-482. doi: 10.1038/327477a0
[21] Visser K, Thunell R, Stott L. Magnitude and timing of temperature change in the Indo-Pacific warm pool during deglaciation[J]. Nature, 2003, 421(6919): 152-155. doi: 10.1038/nature01297
[22] Sagawa T, Yokoyama Y, Ikehara M, et al. Shoaling of the western equatorial Pacific thermocline during the last glacial maximum inferred from multispecies temperature reconstruction of planktonic foraminifera[J]. Palaeogeography, Palaeoclimatology, Palaeoecology, 2012, 346-347: 120-129. doi: 10.1016/j.palaeo.2012.06.002
[23] Lea D W, Pak D K, Spero H J. Climate impact of late quaternary equatorial Pacific sea surface temperature variations[J]. Science, 2000, 289(5485): 1719-1724. doi: 10.1126/science.289.5485.1719
[24] Yan X H, Ho C R, Zheng Q A, et al. Temperature and size variabilities of the western Pacific warm pool[J]. Science, 1992, 258(5088): 1643-1645. doi: 10.1126/science.258.5088.1643
[25] Ayliffe L K, Gagan M K, Zhao J X, et al. Rapid interhemispheric climate links via the Australasian monsoon during the last deglaciation[J]. Nature Communications, 2013, 4: 2908, doi: 10.1038/ncomms3908.
[26] Sprintall J, Gordon A L, Koch-Larrouy A, et al. The Indonesian seas and their role in the coupled ocean-climate system[J]. Nature, 2014, 7(7): 487-492. doi: 10.1038/ngeo2188
[27] Xu J. Change of Indonesian throughflow outflow in response to east asian monsoon and ENSO activities since the Last Glacial[J]. Science China Earth Sciences, 2014, 57(4): 791-801, doi: 10.1007/s11430-014-4845-0.
[28] Carton J A, Giese B S. A reanalysis of ocean climate using simple ocean data assimilation (SODA)[J]. Monthly Weather Review, 2008, 136(8): 2999-3017. doi: 10.1175/2007MWR1978.1
[29] Rodbell D T, Seltzer G O, Anderson D M, et al. A ~15, 000-year record of El Ni o-driven alluviation in southwestern Ecuador[J]. Science, 1999, 283(5401): 516-520. doi: 10.1126-science.283.5401.516/
[30] Moy C M, Seltzer G O, Rodbell D T, et al. Variability of El Ni o/southern oscillation activity at millennial timescales during the Holocene epoch[J]. Nature, 2002, 420(6912): 162-165. doi: 10.1038/nature01194
[31] Koutavas A, deMenocal P B, Olive G C, et al. Mid-Holocene El Ni o-Southern Oscillation (ENSO) attenuation revealed by individual foraminifera in eastern tropical Pacific sediments[J]. Geology, 2006, 34(12): 993-996. doi: 10.1130/G22810A.1
[32] Conroy J L, Overpeck J T, Cole J E, et al. Holocene changes in eastern tropical Pacific climate inferred from a Galápagos lake sediment record[J]. Quaternary Science Reviews, 2008, 27(11-12): 1166-1180.
[33] Liu Z Y, Lu Z Y, Wen X Y, et al. Evolution and forcing mechanisms of El Ni o over the past 21, 000 years[J]. Nature, 2014, 515(7528): 550-553, doi: 10.1038/nature13963.
[34] Qu T D, Mitsudera H, Yamagata T. A climatology of the circulation and water mass distribution near the Philippine coast[J]. Journal of Physical Oceanography, 1999, 29(7): 1488-1505, doi: 10.1175/1520-0485(1999)029<1488:ACOTCA>2.0.CO; 2.
[35] Fine R A, Lukas R, Bingham F M, et al. The western equatorial Pacific: a water mass crossroads[J]. Journal of Geophysical Research, 1994, 99(C12): 25063-25080, doi: 10.1029/94JC02277.
[36] Fine R A, Maillet K A, Sullivan K F, et al. Circulation and ventilation flux of the Pacific Ocean[J]. Journal of Geophysical Research, 2001, 106(10): 22159-22178, doi: 10.1029/1999JC000184.
[37] Gordon A L. Interocean exchange of thermocline water[J]. Journal of Geophysical Research, 1986, 91(C4): 5037-5046. doi: 10.1029/JC091iC04p05037
[38] Mohtadi M, Oppo D W, Lückge A, et al. Reconstructing the thermal structure of the upper ocean: insights from planktic foraminifera shell chemistry and alkenones in modern sediments of the tropical eastern Indian Ocean[J]. Paleoceanography, 2011, 26(3): PA3219, doi: 10.1029/2011PA002132.
[39] Dang H W, Jian Z M, Bassinot F, et al. Decoupled Holocene variability in surface and thermocline water temperatures of the Indo-Pacific Warm Pool[J]. Geophysical Research Letters, 2012, 39(1): L01701. doi: 10.1029/2011gl050154
[40] Fan W J, Jian Z M, Bassinot F, et al. Holocene centennial-scale changes of the Indonesian and South China Sea throughflows: evidences from the Makassar Strait[J]. Global and Planetary Change, 2013, 111: 111-117, doi: 10.1016/j.gloplacha.2013.08.017.
[41] Haug G H, Hughen K A, Sigman D M, et al. Southward migration of the intertropical convergence zone through the Holocene[J]. Science, 2001, 293(5533): 1304-1308. doi: 10.1126/science.1059725
[42] Linsley B K, Rosenthal Y, Oppo D W. Holocene evolution of the Indonesian throughflow and the western Pacific warm pool[J]. Nature Geoscience, 2010, 3(8): 578-583. doi: 10.1038/ngeo920
[43] Griffiths M L, Drysdale R N, Gagan M K, et al. Abrupt increase in east Indonesian rainfall from flooding of the Sunda Shelf ~9500 years ago[J]. Quaternary Science Reviews, 2013, 74: 273-279. doi: 10.1016/j.quascirev.2012.07.006
[44] Wang Y J, Cheng H, Edwards R L, et al. A high-resolution absolute-dated late Pleistocene monsoon record from Hulu Cave, China[J]. Science, 2001, 294(5550): 2345-2348. doi: 10.1126/science.1064618
[45] Yuan D X, Cheng H, Edwards R L, et al. Timing, duration, and transitions of the last interglacial Asian monsoon[J]. Science, 2004, 304(5670): 575-578. doi: 10.1126/science.1091220
-
期刊类型引用(4)
1. 刘冰瑾,黄恩清,田军. 岁差驱动的全新世热带太平洋—印度洋水汽输送. 海洋地质与第四纪地质. 2023(04): 56-70 .  本站查看
本站查看
2. 丁奕凡,田军. 晚中新世以来印度尼西亚海道及印度尼西亚贯穿流的协同演化及其气候效应研究进展. 地球科学进展. 2022(11): 1165-1180 . 百度学术
3. 郭沫贞,吕福亮,侯福斗,李林,杨涛涛,李东. 东爪哇盆地抱球虫灰岩浮游有孔虫组成及指相意义. 沉积学报. 2020(04): 747-758 . 百度学术
4. 徐建,可菲,Wolfgang Kuhnt,Ann Holbourn,张鹏,崔瑞,刘恒,孙金梁. 21 ka以来帝汶海区钻孔堆叠记录的古海洋学意义. 第四纪研究. 2020(06): 1562-1576 . 百度学术
其他类型引用(1)
计量
- 文章访问数: 2531
- HTML全文浏览量: 613
- PDF下载量: 33
- 被引次数: 5