Pore water geochemistry of shallow surface sediments in the southern South China Sea and its implications for methane seepage activities
-
摘要: 海底沉积物孔隙水地球化学特征能快速响应甲烷渗漏活动及其生物地球化学过程,从而记录甲烷渗漏活动特征。对采自南海南部北康盆地的3个重力沉积柱状沉积物孔隙水样品(BH-H75、BH-H13Y和BH-H61)进行了甲烷浓度、溶解无机碳(DIC)和碳同位素(δ13CDIC)、阴离子(SO42−、Cl−)以及主微量元素(Ca2+、Mg2+、Sr2+、Ba2+)等地球化学分析。(△DIC+△Ca2++△Mg2+)/△SO42−比率图解与δ13CDIC深度剖面特征揭示了有机质硫酸盐还原反应(OSR)和硫酸盐驱动-甲烷厌氧氧化反应(SD-AOM)在不同沉积柱中所占比例的不同,其中BH-H13Y沉积柱中OSR和SD-AOM共同存在;BH-H75沉积柱中OSR占主导;在BH-H61沉积柱中SD-AOM占主导,且其底部可能存在微生物产甲烷作用。硫酸盐浓度线性拟合关系指示BH-H13Y的硫酸盐-甲烷过渡带(SMTZ)的深度约为700 cmbsf。结合SO42−浓度、DIC浓度最大值和δ13CDIC最小值推测BH-H61的SMTZ深度约为480 cmbsf。BH-H61和BH-H13Y沉积柱中,较浅的SMTZ深度、上升的DIC浓度以及强烈负偏的δ13CDIC值指示研究区存在甲烷渗漏活动。此外,在BH-H61和BH-H13Y站位,硫酸盐浓度随深度降低的变化梯度在沉积柱下部较上部陡,指示向上迁移的甲烷通量在时间上逐渐增强。孔隙水中Ca2+、Mg2+、Sr2+浓度以及Mg/Ca、Sr/Ca比值变化特征指示研究区沉积物中可能有自生高镁方解石矿物生成;而BH-H61站位SMTZ界面以下,孔隙水中Ba2+浓度升高,指示了硫酸钡的溶解作用。
-
关键词:
- 孔隙水 /
- 硫酸盐驱动甲烷厌氧氧化(SD-AOM) /
- 硫酸盐-甲烷过渡带 (SMTZ) /
- 甲烷渗漏 /
- 北康盆地
Abstract: The geochemical characteristics of pore water in seabed sediments may quickly respond to the changes in the methane seepage and related biogeochemical processes. In this paper, methane, DIC and its carbon isotope value (δ13CDIC), anions (SO42−, Cl−), major and trace elements (Ca2+, Mg2+, Sr2+, Ba2+) are analyzed for the pore water samples (BH-H75, BH-H13Y and BH-H61) collected from the Beikang Basin in the southern SCS. The (△DIC+△Ca2++△Mg2+)/△SO42− ratios and δ13CDIC show that organoclastic sulfate reduction (OSR) and sulfate-driven anaerobic oxidation of methane (SD-AOM) vary from different columns. For the column of BH-H13Y, OSR and SD-AOM occur together. However, OSR is dominant in column BH-H75, while SD-AOM dominates the BH-H61 column. There may be microbial methanogenesis at the deeper layer in the BH-H61 column. Based on the linear fitting sulfate concentrations, the sulfate-methane transition zone (SMTZ) of BH-H13Y is estimated to be about 700 cmbsf. According to SO42− concentrations, the maximum DIC concentration and the minimum δ13CDIC value, the SMTZ depth of BH-H61 is estimated at about 480 cmbsf. Sallower SMTZ depths, increasing DIC concentrations and highly negative δ13CDIC values recorded in BH-H61 and BH-H13Y columns suggest a remarkable methane seepage in the study aera. The gradients for sulfate concentrations of lower part of BH-H61 and BH-H13Y columns are steeper than that of the upper part, indicating that the methane flux upward migration increases with time. Features of Ca2+, Mg2+ and Sr2+ concentrations and Mg/Ca and Sr/Ca ratios in pore water indicate the possibility of the formation of high-Mg calcite. Below the SMTZ interface at BH-H61 column, Ba2+ concentrations increase with depth, indicating the barium sulfate dissolution occurs. -
海底甲烷渗漏活动是指富碳氢化合物(通常以甲烷为主)的流体沿裂隙、断裂等高渗通道及多孔介质以渗流或喷溢的形式从深部向上运移至海底浅部的过程。渗漏的甲烷主要来源于有机碳的原地转化、深部埋藏的天然气水合物分解[1-3]或油气泄漏[4]。甲烷的温室效应强度是二氧化碳的20倍以上,海底中甲烷的大量释放会对全球气候变化产生重大影响。然而研究表明近90%的海底渗漏甲烷被厌氧氧化(Anaerobic Oxidation of Methane, AOM)所消耗而未能释放到大气中[5]。AOM是一种由微生物介导的氧化还原过程,参与的电子受体包括锰氧化物、硝酸盐、铁氧化物、硫酸盐等[6-8]。其中硫酸盐在海底沉积物中广泛存在,通过上覆海水向下扩散或原位储存于海洋沉积物孔隙水中,在沉积物早期成岩过程中发挥重要作用[8]。因此,在甲烷渗漏环境中,硫酸盐作为主要的氧化剂驱动甲烷厌氧氧化作用的发生(Sulfate-Driven Anaerobic Oxidation of Methane, SD-AOM)[6],简化的化学反应式见式(1)。
$$ {\rm{C}}{{\rm{H}}_{\rm{4}}}{\rm{ + SO}}_{\rm{4}}^{{\rm{2 - }}} \to {\rm{H}}{{\rm{S}}^{\rm{ - }}}{\rm{ + HCO}}_{\rm{3}}^{\rm{ - }}{\rm{ + }}{{\rm{H}}_{\rm{2}}}{\rm{O}} $$ (1) SD-AOM发生在一个狭窄的硫酸盐-甲烷过渡带(Sulfate Methane Transition Zone,SMTZ)内[9-14]。反应产物HS−进一步与孔隙水的Fe2+、氧化还原敏感元素(如Mo)等形成自生硫化物矿物;HCO3−提高孔隙水中碱度的同时,与孔隙水中部分碱土金属元素(如Ca2+、Mg2+、Sr2+)结合形成自生碳酸盐岩。这些自生硫化物矿物(如黄铁矿)、自生碳酸盐岩种类以及Mo元素在沉积物中的富集程度可用来推测过去甲烷渗漏的强度和期次[15-19]。相同地,SD-AOM及其相伴的自生矿物形成过程均被记录在沉积物孔隙水中,因此,孔隙水地球化学特征对追踪甲烷渗漏及相关地球化学反应具有一定指示意义[13-14,20-22]。然而,有机质硫酸盐还原作用(Organoclastic Sulfate Reduction,OSR)[23]与SD-AOM同时发生时,可能会使得追踪甲烷渗漏活动变得困难。OSR是沉积物中有机质与硫酸盐发生的氧化还原反应,化学反应式见式(2):
$$ {\rm{2C}}{{\rm{H}}_{\rm{2}}}{\rm{O + SO}}_{\rm{4}}^{{\rm{2 - }}} \to {\rm{2HCO}}_{\rm{3}}^{\rm{ - }}{\rm{ + }}{{\rm{H}}_{\rm{2}}}{\rm{S}} $$ (2) 由于OSR与SD-AOM均是消耗硫酸盐、产生硫化氢还原气体和产生溶解无机碳(DIC)的过程。同时发生时,很难区分二者的相对贡献,进而影响对甲烷渗漏活动的评估。基于此,学者提出了很多识别方法,其中最常见的方法是用DIC产生量与硫酸盐消耗量的比值来辨别孔隙水中OSR与SD-AOM的相对比例[13-14,24]。但若SMTZ深度以下发生了产甲烷作用,则其产生的DIC向上迁移并混合,可能会提高SMTZ及其上部的DIC浓度(如大于30 mM),使得此方法无效[25-29]。因此,又有学者提出稳态反应-传输模型来定量研究OSR和SD-AOM作用过程以及二者消耗硫酸盐的相对占比[21,30]。因为甲烷作用以及甲烷厌氧氧化这两个生物地球化学过程的碳酸氢根产生量与硫酸盐消耗量的比值都是2∶1[29,31],所以此方法仍可保守地估算OSR和SD-AOM对沉积物孔隙水中硫酸盐消耗的相对贡献。此外,OSR和SD-AOM产生的DIC的13C同位素特征差异也可以定性研判二者对硫酸盐还原反应的影响程度[9,24]。
目前,已在中国南海北部的琼东南、西沙、台西南、神狐海域等发现多个甲烷渗漏点[13,19-20,32];然而对南海南部海域的甲烷渗漏活动仍知之甚少。地质和地球物理研究表明南海南沙海域的北康盆地,南沙海槽油气资源潜力巨大[33-35]。地震记录也表明在南沙海域发育有适宜烃类气体泄漏和迁移的通道[33,35-36],并识别出了广泛的似海底反射层(BSR)[33]。粗略统计南沙海域北康盆地的石油地质资源量为8.86×10⁸ t,天然气地质资源量为14 855×108 m3[35]。另一方面,在北康盆地发现自生黄铁矿与石膏共生的现象[37]以及较高的磁化率带[38],可能与深部富烃类流体渗流有关。孔隙水地球化学分析和数值模拟综合研究推测北康盆地海域存在甲烷渗漏的迹象[21]。然而目前对北康盆地是否存在活动的甲烷渗漏尚无明确结论,而孔隙水地球化学特征是认识甲烷渗漏的重要证据。基于此,本文拟对采自南海南部北康盆地的3个重力沉积柱状沉积物孔隙水样品(BH-H75、BH-H13Y和BH-H61)进行甲烷浓度、DIC及其 δ13CDIC、阴离子(SO42−、Cl−、Br−)以及主微量元素(Ca2+、Mg2+、Sr2+、Ba2+)分析,探究SD-AOM生物地球化学过程,进一步了解北康盆地研究区甲烷渗漏活动情况。
1. 区域地质背景
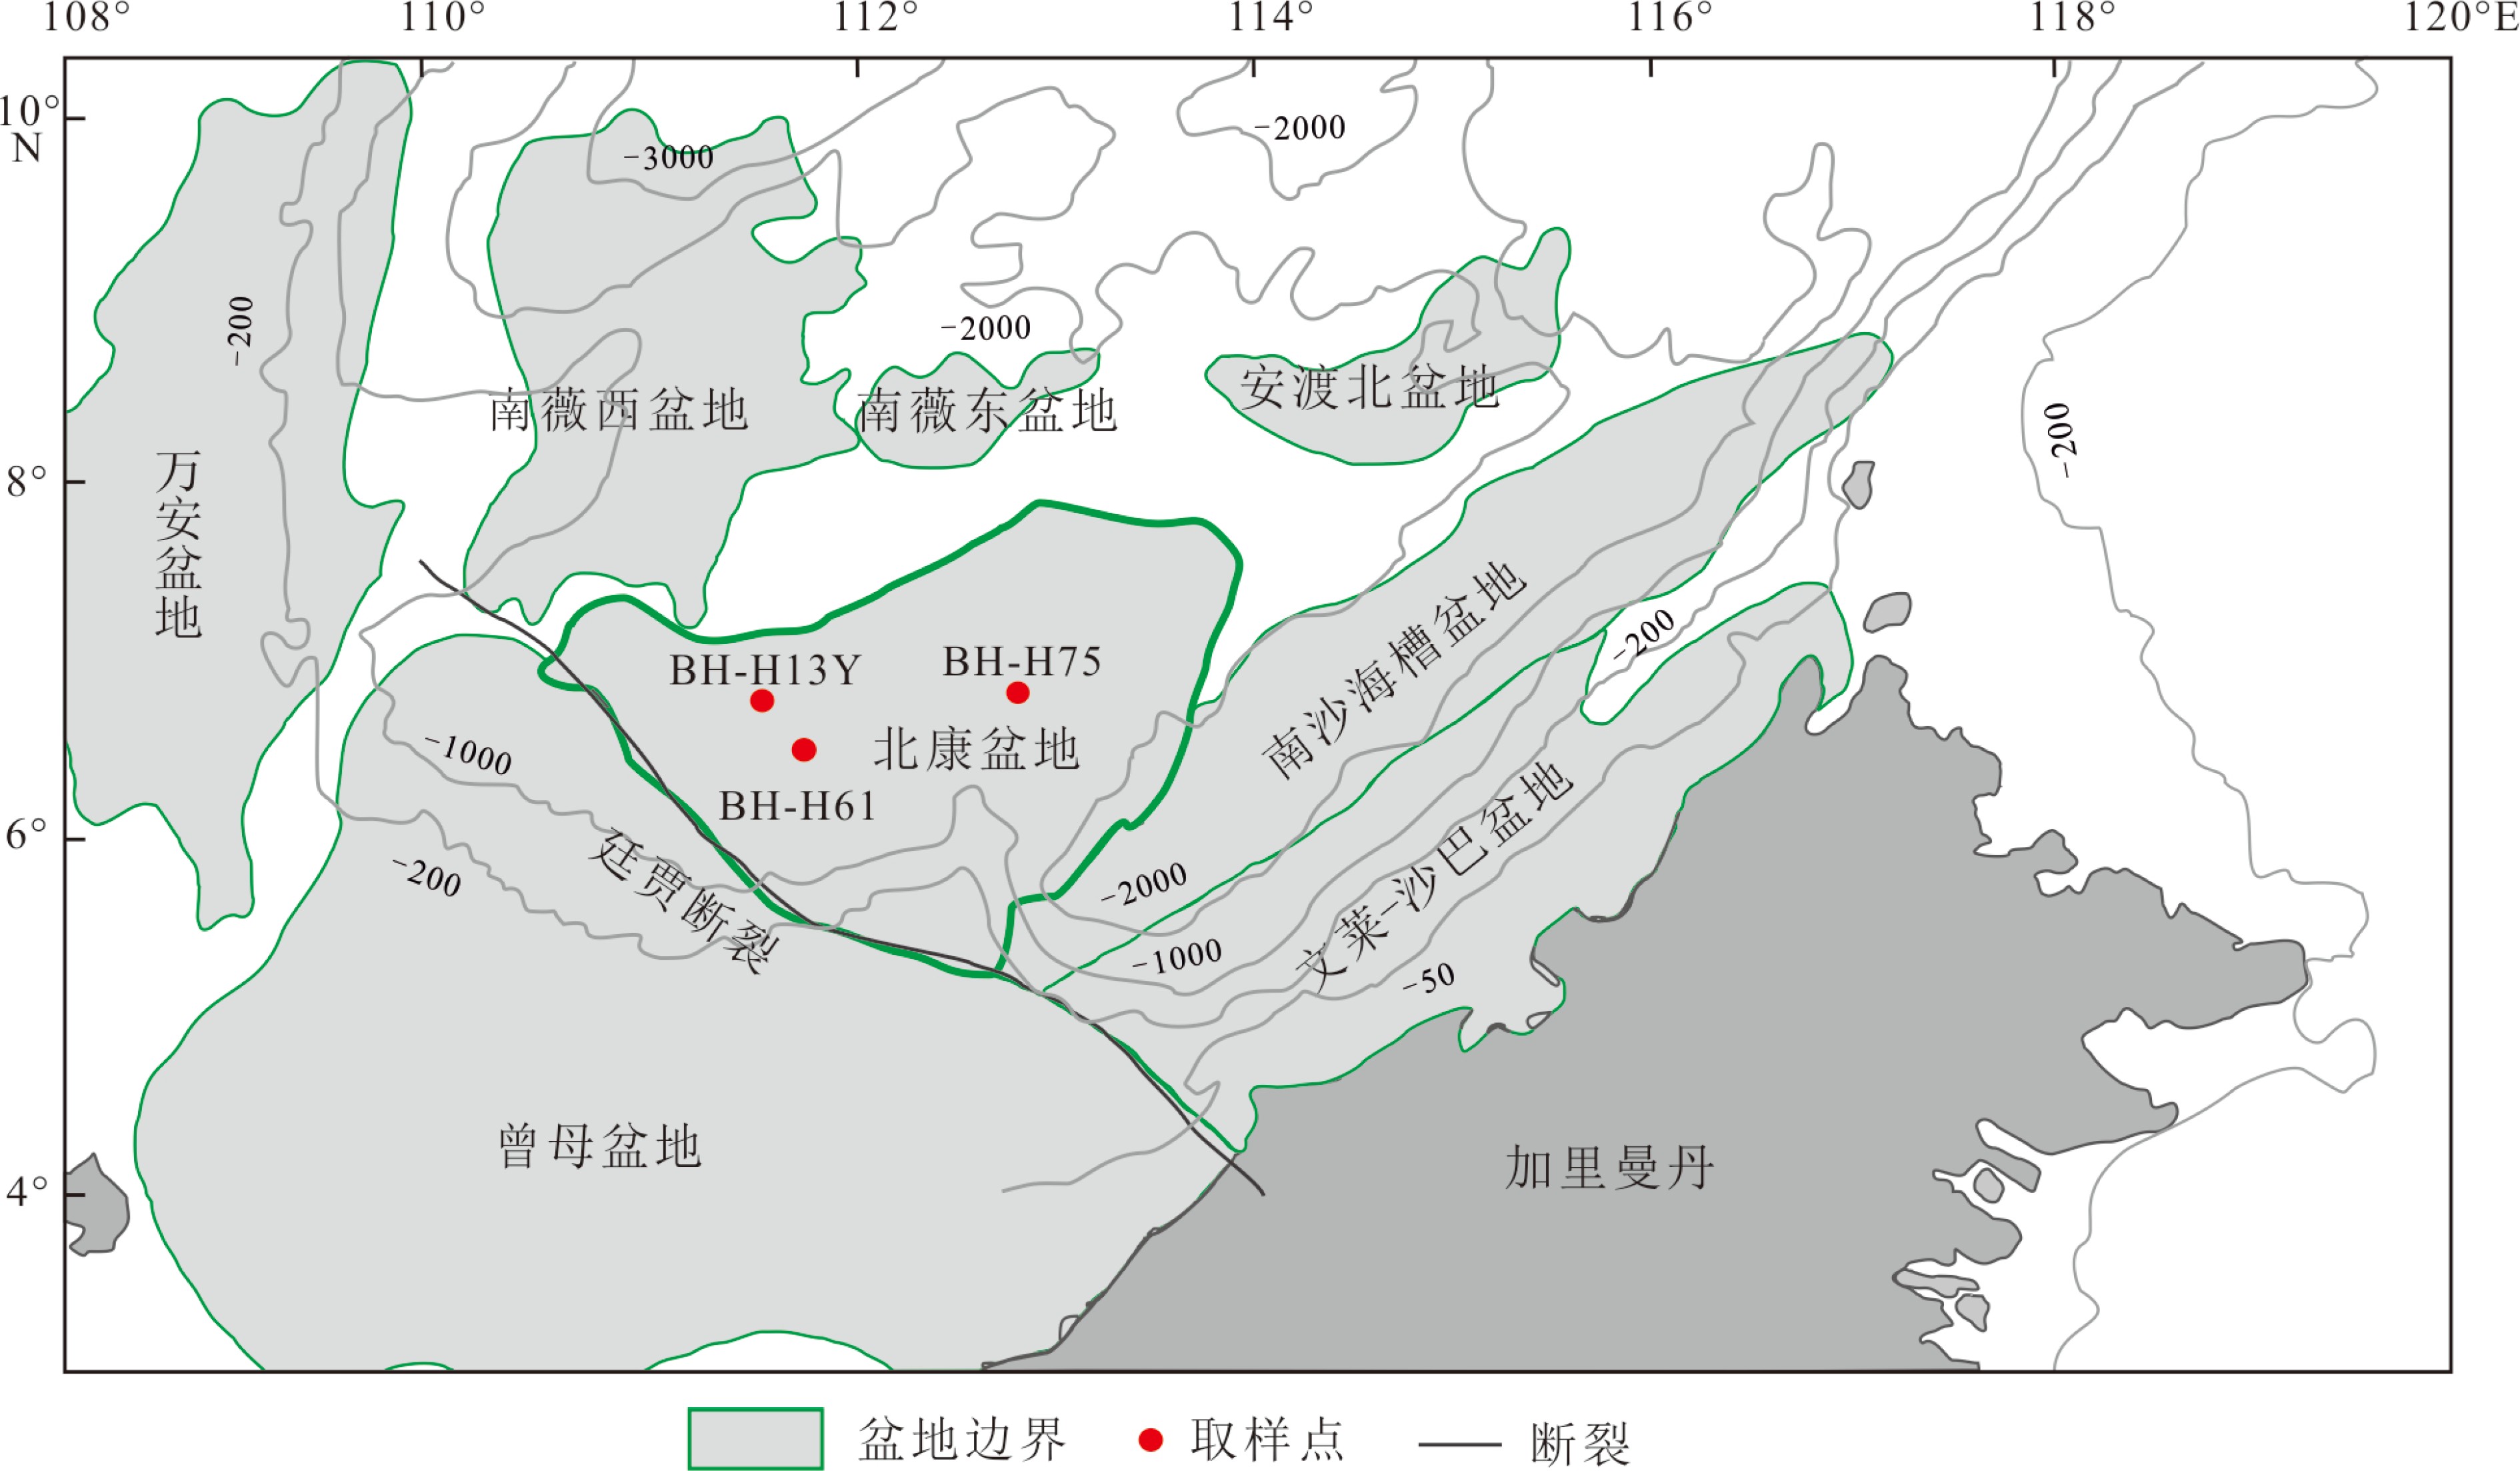
北康盆地位于南海南部边缘(图1),是南沙中部海域重要的含油气盆地。盆地面积约6×10⁴ km2,水深为100~2 000 m。北康盆地位于南沙中部海域大陆坡上,地质构造十分复杂,大量发育北东向、北西向断裂,其中北东向断裂最具规模;盆地从东部到北部相邻的盆地依次为南沙海槽盆地、安渡北盆地、南薇东盆地和南薇西盆地,西南部通过走滑性质的廷贾断裂带与曾母盆地相连;盆地内主要发育中始新统—第四系,地层厚度变化较大,最厚处超过13 km [39]。盆地基底主要为前新生代变质岩和酸性-基性火成岩,其中在东部地区主要分布火成岩[40]。此外,北康盆地中也发育大量烃源岩;分别为中始新统、上始新统—下渐新统湖相泥岩、海陆过渡相泥岩、上渐新统—中中新统的浅海-半深海相泥岩[41-42]。区域烃源岩的大量分布、疏导体系、生物礁以及古地热场结构特征指示北康盆地油气潜力以及天然气水合物资源量巨大[35,41-43],并在相邻的南沙海槽发现BSRs[44]。构造和气源条件表明北康盆地具备天然气水合物形成、发育的有力条件,为南海水合物成藏一级远景区之一[34,45]。
![]()
2. 材料与方法
2.1 孔隙水采集与预处理
2019年8月,广州海洋地质调查局在南海南部(工区为南沙海域)开展了HYSH201905航次的调查,进而评价天然气水合物资源储量。本文研究的柱状沉积物样品利用大型重力活塞取样器获得,样品信息见表1。现场取样后,沉积柱(直径约120 mm)立刻被切成1 m长度,柱子的顶底部使用塑料盖与磁带封闭,并水平放置。以20 cm为间距使用电钻机进行打孔,随后利用0.2 µm过滤膜的Rhizon进行孔隙水采集。在采集BH-H61沉积柱底部孔隙水过程中,闻到强烈的臭鸡蛋气味。采集的所有孔隙水样品均分为两份平行样,第一份平行样取1.8 mL孔隙水样,加入体积为20 μL 的2 M 硝酸酸化处理(pH<2),用于测试主、微量元素;第二份平行样为剩余的孔隙水样,不作任何处理并全部盛入15 mL样品瓶中,立刻用橡胶塞密封。所有的孔隙水样品均储存于4 ℃的冰箱中,以供进一步研究需要。
表 1 南海南部北康盆地海域采集的3个沉积柱信息Table 1. Information of three sedimentary columns collected from the Beikang Basin in the southern SCS站位 北纬 东经 水深/m 岩心长度/cm 海底温度/℃ 校准地温梯度/(K/km) BH-H75 6.8482° 112.8052° 1 663 397 2.826 88.9 BH-H13Y 6.7107° 111.4839° 1 867 400 2.61 87.2 BH-H61 6.4809° 111.7519° 1 938 518 2.585 36.1 2.2 孔隙水地球化学分析与扩散通量计算
孔隙水中的主要阳离子(Na+、K+、Ca2+、Mg2+)采用电感耦合等离子体光谱仪(ICAP-7200系列,Thermo,USA)测试。在测试前,样品稀释10倍,随后取8 mL转移至进样管中进行阳离子测试,测试精度大于5%。微量元素(Ba2+、Sr2+)采用电感耦合等离子体质谱仪(iCAP Q系列,Thermo,USA)进行测试,检出最低值约 0.06 μg/kg, 精度及准确度均优于5%。Cl−和SO42−浓度采用离子色谱仪(ICS-1100型,Thermo,USA)进行测试。平行试验结果显示Cl−和SO42−浓度的RSD(n=5)分别为0.35%和0.28%,均小于1%,说明实验具有较好的重复性。DIC及其δ13CDIC采用连续流质谱仪(Delta V Advantage,Thermo,USA)进行测试。测试方法如下:首先在12 mL的样品瓶(Labco)中加入适量无水H3PO4,随后采用氦气进行排空处理,去除瓶内空气对样品碳同位素比值测定的影响;其次在经过氦气排空处理后的样品瓶中加入0.2 mL水样,将产生的CO2驱赶并转移至质谱仪中,测定同位素分馏平衡后的CO2同位素比值。δ13C值以VPDB国际标准作为参考标准。DIC浓度及其δ13CDIC的测试精度分别优于2%和0.2‰。甲烷浓度采用Agilent 6850系列气相色谱仪(Thermo,USA)进行测试,测试精度优于2%。所有离子的分析测试工作均在自然资源部第三海洋研究所分析测试中心完成。
沉积物孔隙水中硫酸盐的分子扩散通量采用菲克第一定律计算,公式见式(3)和式(4)。
$$ J = - {\rm{\varphi }}{{{D}}_{\rm{S}}}\partial C/\partial x$$ (3) $${{{D}}_{\rm{S}}}{\rm{ = }}{{{D}}_{\rm{0}}}{\rm{/(1 - 2ln\varphi )}}$$ (4) 其中,J代表硫酸盐扩散通量(mmol•m−2•a−1);φ代表孔隙率,假设为75% [47];Ds代表沉积物扩散系数(m2•s−1);C为硫酸盐浓度(mmol•L−1);x为沉积物深度(m);Do为海水中硫酸盐的扩散系数,文中Do取5.72×10⁻¹⁰ m2•s−1[48]。
3. 结果
3.1 阴离子组分、CH4、DIC、δ13CDIC
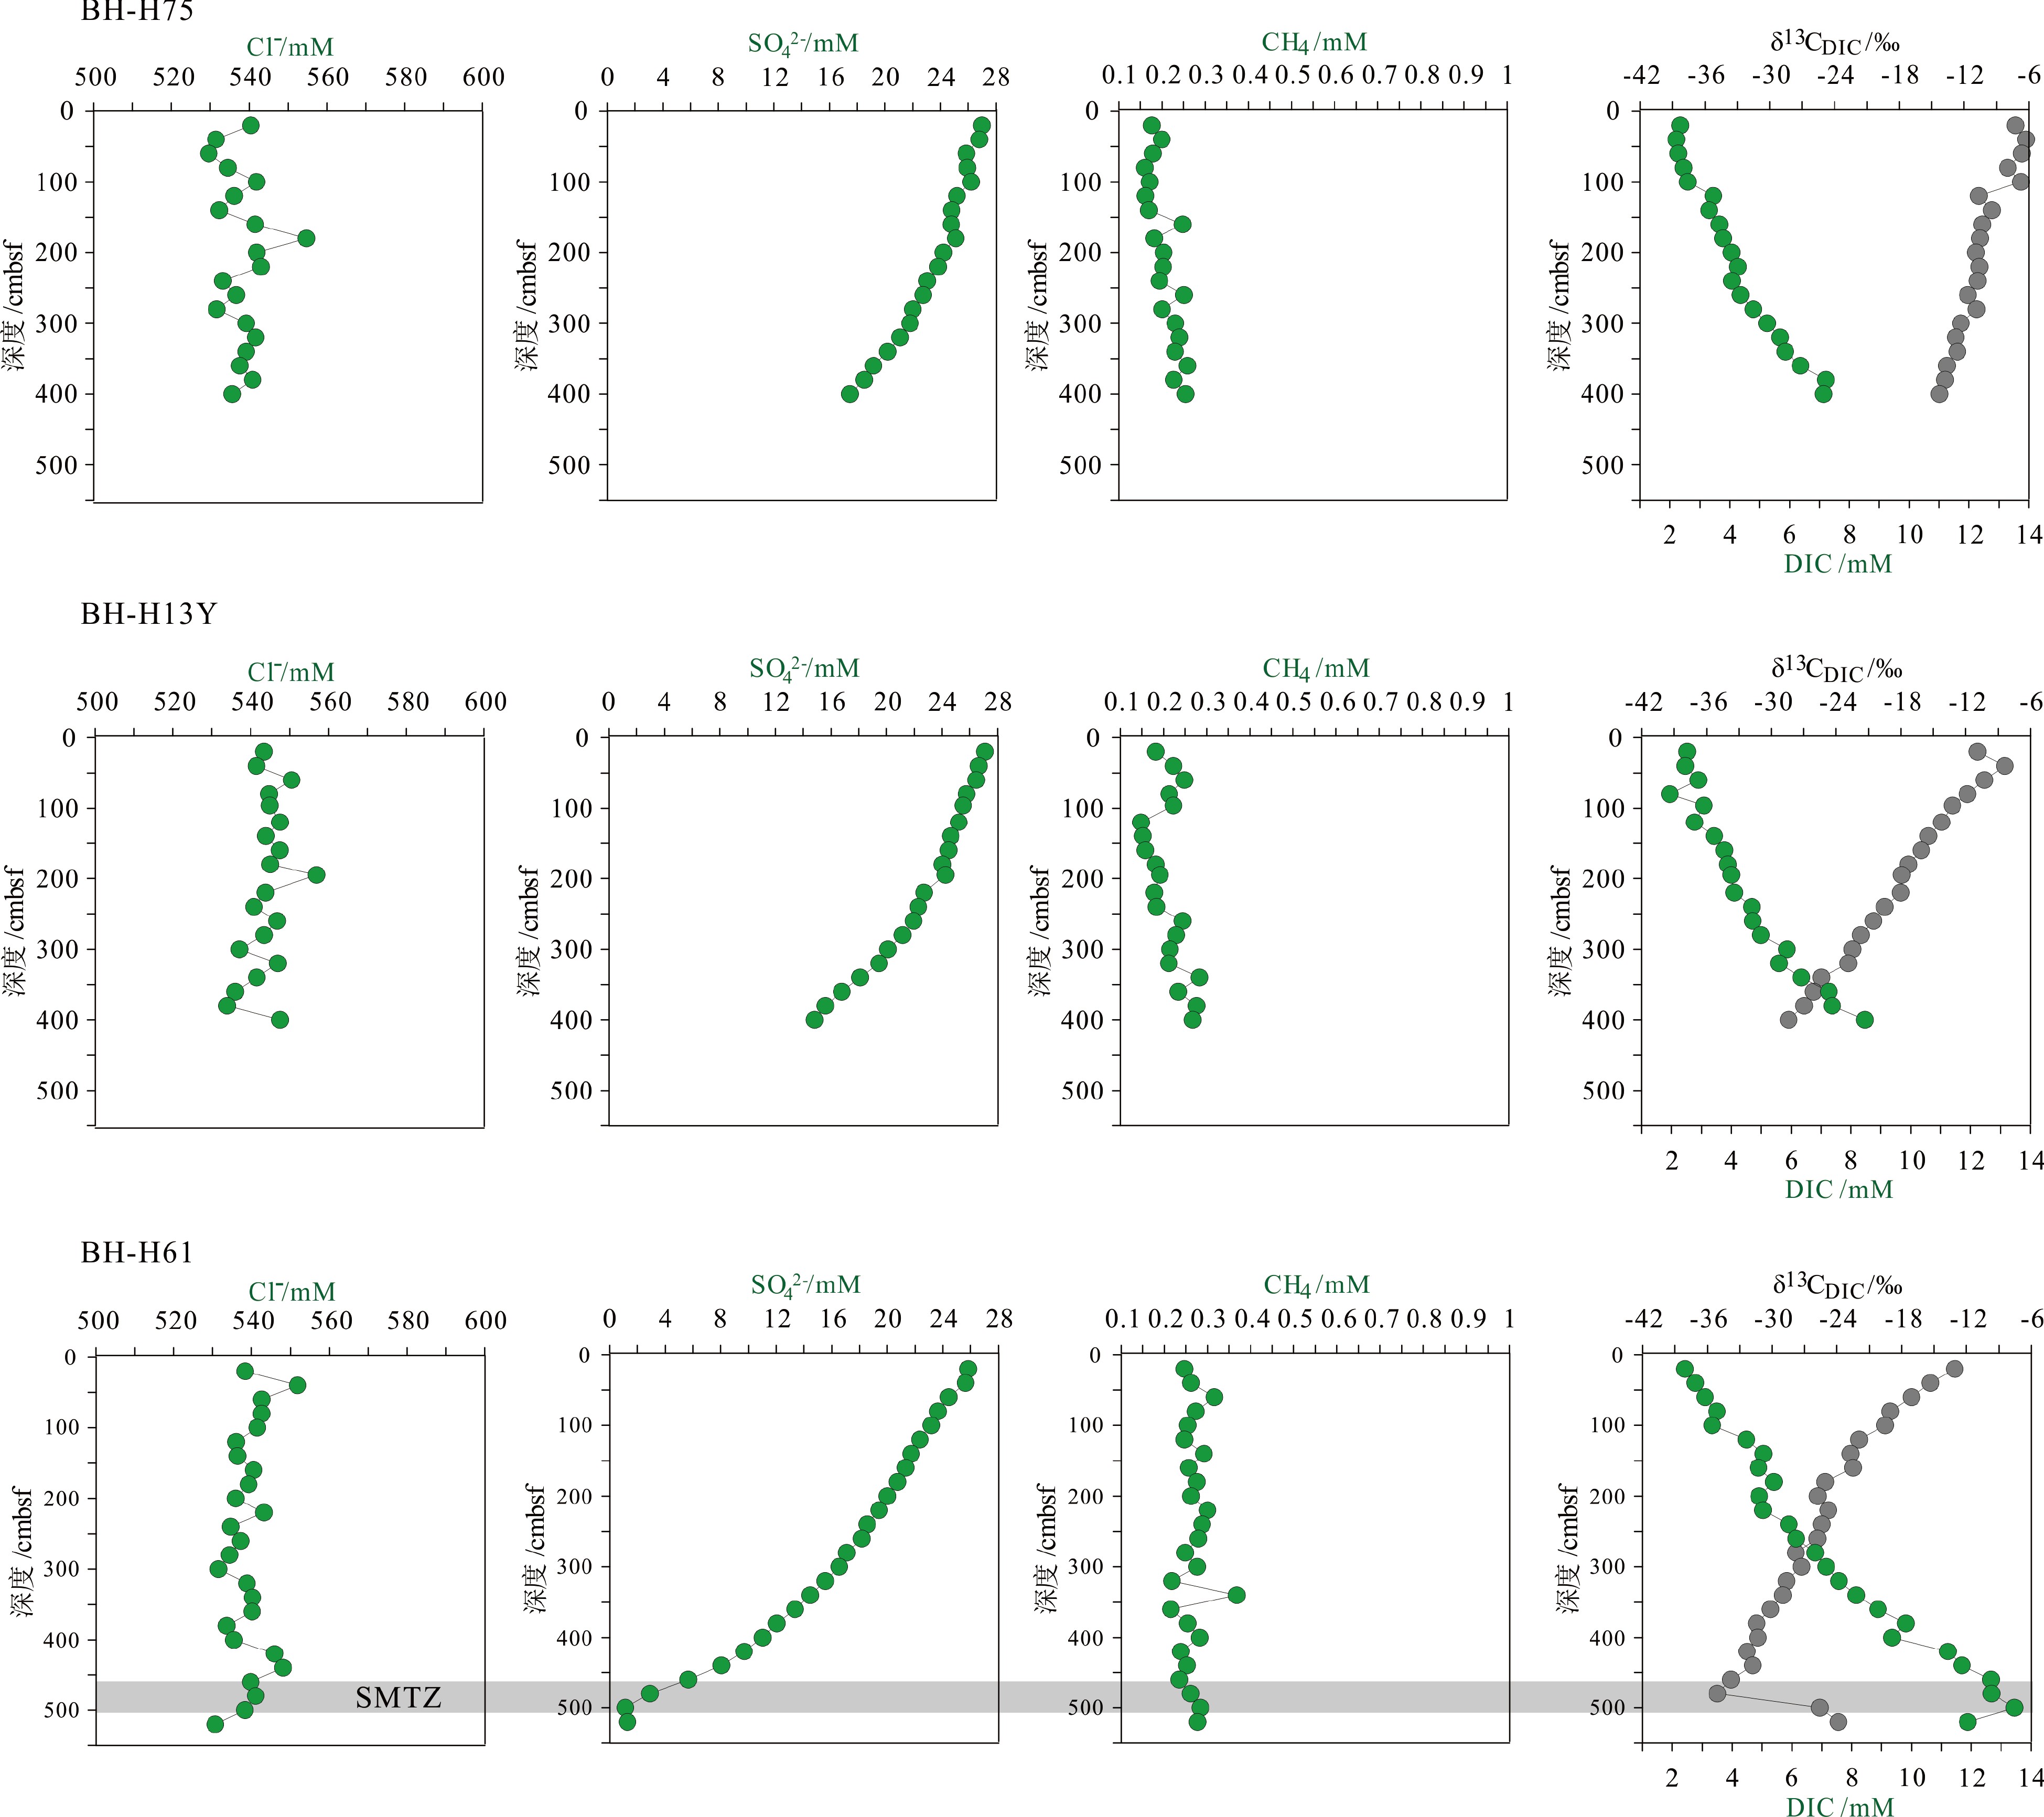
3个沉积柱孔隙水中Cl−浓度在深度剖面上无显著变化趋势,浓度为529.6~556.9 mM,与典型海水中的浓度值(558 mM)较为接近(图2,表2)。而3个站位的
${\rm{SO}}_4^{2 - }$ 浓度均向下逐渐降低;尤其在BH-H61站位,${\rm{SO}}_4^{2 - }$ 浓度降低趋势尤为显著,分别从沉积物上部(20 cmbsf)的25.84 mM降低至沉积物底部的1.28 mM。3个站位的甲烷含量随深度无显著变化,且浓度较低(0.148~0.368 mM)。DIC浓度的变化趋势与${\rm{SO}}_4^{2 - }$ 浓度变化相反(图2),浓度随深度逐渐升高,在3个沉积柱表层(20 cmbsf),DIC浓度变化范围为2.35~2.52 mM,接近典型海水值(2.1 mM)。δ13CDIC随深度逐渐降低。值得注意的是,在BH-H61的480 cmbsf处,对应DIC浓度较大值(12.67 mM)和δ13CDIC值最小值(−35.07‰)。![]() 图 2 研究区BH-H75、BH-H13Y、BH-H61站位沉积物孔隙水中阴离子组分、CH4、DIC及其δ13CDIC的深度剖面图Figure 2. Depth profile of anion components, methane, DIC and δ13CDIC values in sediment pore water of BH-H75, BH-H13Y and BH-H61 sites表 2 BH-H75、BH-H13Y和BH-H61站位沉积物孔隙水中甲烷浓度、阴离子(SO42−、Cl−)、主微量元素(Na+、K+、Ca2+、Mg2+、Sr2+、Ba2+)、DIC和δ13CDIC、Sr/Ca与Mg/Ca比值特征Table 2. Features of methane concentration, anions (SO42−、Cl−), major trace elements (Na+、K+、Ca2+、Mg2+、Sr2+、Ba2+), DIC and δ13CDIC, Sr/Ca and Mg/Ca ratios of sediment pore water in BH-H75, BH-H13Y and BH-H61 sites
图 2 研究区BH-H75、BH-H13Y、BH-H61站位沉积物孔隙水中阴离子组分、CH4、DIC及其δ13CDIC的深度剖面图Figure 2. Depth profile of anion components, methane, DIC and δ13CDIC values in sediment pore water of BH-H75, BH-H13Y and BH-H61 sites表 2 BH-H75、BH-H13Y和BH-H61站位沉积物孔隙水中甲烷浓度、阴离子(SO42−、Cl−)、主微量元素(Na+、K+、Ca2+、Mg2+、Sr2+、Ba2+)、DIC和δ13CDIC、Sr/Ca与Mg/Ca比值特征Table 2. Features of methane concentration, anions (SO42−、Cl−), major trace elements (Na+、K+、Ca2+、Mg2+、Sr2+、Ba2+), DIC and δ13CDIC, Sr/Ca and Mg/Ca ratios of sediment pore water in BH-H75, BH-H13Y and BH-H61 sites站位 取样深度/
cmbsfCH4/
mMSO42−/
mMCl−/
mMNa+/
mMK+/
mMMg2+/
mMCa2+/
mMSr2+/
μMBa2+/
μMDIC/
mMδ13CDIC/
‰Mg/Ca Sr/Ca BH-H75 20 0.176 26.99 540.4 443.3 12.42 48.54 9.09 110.02 0.763 2.347 −7.23 3.238 0.0265 40 0.200 26.80 531.5 442.75 12.47 48.41 9.17 112.07 0.517 2.217 −6.26 3.202 0.0267 60 0.179 25.87 529.6 444.57 12.69 48.49 9.28 107.03 0.527 2.282 −6.65 3.167 0.0252 80 0.161 25.94 534.5 444.81 12.85 48.38 9.24 109.98 0.476 2.455 −7.96 3.174 0.0260 100 0.172 26.22 541.9 445.53 12.89 48.36 8.89 108.24 0.473 2.593 −6.73 3.299 0.0266 120 0.162 25.19 536.1 442.19 11.69 48.08 9.03 140.37 0.604 3.449 −10.64 3.228 0.0340 140 0.170 24.81 532.3 443.87 12.17 48.13 9.18 111.29 0.467 3.309 −9.44 3.181 0.0265 160 0.248 24.78 541.5 444.44 12.3 48.24 9.01 107.27 0.453 3.657 −10.32 3.248 0.0260 180 0.182 25.10 554.8 441.66 12.04 47.81 9.05 105.17 0.477 3.780 −10.52 3.203 0.0254 200 0.204 24.21 541.9 446.06 12.28 48.3 9.16 107.66 0.462 4.059 −10.90 3.199 0.0257 220 0.203 23.83 543.1 442.09 12.01 47.74 8.71 105.59 0.554 4.267 −10.58 3.325 0.0265 240 0.194 23.06 533.2 443.16 12.18 47.6 9.24 104.66 0.522 4.072 −10.75 3.125 0.0248 260 0.251 22.75 536.6 443.3 12.06 47.59 8.53 105.72 0.519 4.355 −11.65 3.383 0.0271 280 0.200 22.01 531.7 436.13 12.07 46.52 8.57 102.99 0.634 4.786 −10.85 3.292 0.0263 300 0.231 21.81 539.2 441.42 12.04 46.9 8.42 105.08 0.572 5.251 −12.30 3.379 0.0273 320 0.241 21.09 541.7 437.66 11.85 46.2 7.98 102.24 0.559 5.678 −12.77 3.510 0.0280 340 0.230 20.21 539.2 446.32 12.19 46.86 8.11 102.58 0.591 5.856 −12.63 3.502 0.0276 360 0.259 19.18 537.5 443.86 12.08 46.49 9.69 102.43 0.592 6.364 −13.60 2.911 0.0231 380 0.227 18.50 540.9 448.83 12.29 46.61 7.9 101.95 0.631 7.210 −13.78 3.578 0.0282 400 0.255 17.49 535.6 444.61 12.05 45.94 7.56 98.68 0.769 7.132 −14.29 3.685 0.0285 BH-H13Y 20 0.182 27.09 543.43 457.45 12.67 49.8 9.52 110.95 0.695 2.524 −10.90 3.171 0.0255 40 0.223 26.65 541.46 457.73 12.76 49.63 9.58 114.23 0.630 2.461 −8.37 3.143 0.0261 60 0.249 26.47 550.53 454.46 12.55 49.23 9.46 109.03 0.543 2.892 −10.27 3.156 0.0252 80 0.213 25.77 544.72 447.61 12.26 48.67 9.13 108.59 0.520 1.942 −11.84 3.231 0.0260 96 0.223 25.52 544.89 456.75 12.6 49.59 9.29 108.43 0.491 3.082 −13.23 3.237 0.0255 120 0.148 25.21 547.51 455.22 12.96 49.45 9.11 108.59 0.473 2.766 −14.23 3.293 0.0261 140 0.152 24.63 543.91 451.65 12.56 48.83 8.84 106.81 0.446 3.428 −15.44 3.350 0.0264 160 0.158 24.47 547.45 451.41 12.48 48.94 9.02 106.87 0.436 3.769 −16.12 3.289 0.0259 180 0.182 24.03 545.01 457.18 12.44 49.17 8.82 108.91 0.447 3.884 −17.32 3.380 0.0270 195 0.192 24.25 556.92 452.68 12.31 48.78 8.62 107.75 0.543 3.998 −17.94 3.431 0.0273 220 0.179 22.71 543.81 452.49 12.32 48.37 8.67 104.89 0.490 4.095 −18.02 3.384 0.0265 240 0.184 22.29 540.84 451.25 12.22 48.06 8.94 104.56 0.461 4.686 −19.49 3.259 0.0256 260 0.244 21.95 546.77 448.87 12.03 47.7 8.51 103.90 0.483 4.713 −20.54 3.401 0.0267 280 0.230 21.15 543.46 449.36 12.01 47.18 8.39 103.50 0.508 4.991 −21.72 3.409 0.0270 BH-H13Y 300 0.215 20.11 537.08 447.42 12 46.51 8.32 102.63 0.539 5.861 −22.49 3.391 0.0270 320 0.212 19.46 546.95 453.52 12 47.19 8.29 103.31 0.604 5.592 −22.87 3.453 0.0272 340 0.283 18.10 541.56 449.22 11.85 46.31 8 103.42 0.645 6.344 −25.37 3.509 0.0282 360 0.235 16.78 535.98 449.7 11.8 45.87 7.99 102.00 0.693 7.263 −26.09 3.484 0.0279 380 0.276 15.59 533.93 444.82 12.66 45.19 7.55 97.01 0.754 7.374 −26.96 3.628 0.0281 400 0.267 14.82 547.52 449.07 11.56 45.21 7.92 99.01 0.813 8.463 −28.40 3.462 0.0273 BH-H61 20 0.247 25.84 538.4 454.1 13.09 49.28 8.96 104.35 0.558 2.422 −13.08 3.335 0.0255 40 0.262 25.64 551.9 451.77 13.14 48.42 10.6 101.93 0.523 2.766 −15.33 2.769 0.0210 60 0.316 24.42 542.6 453.09 13.01 48.48 8.01 106.13 0.543 3.096 −17.09 3.672 0.0290 80 0.273 23.65 542.6 451.84 12.81 48.16 8.34 105.04 0.527 3.491 −19.05 3.500 0.0275 100 0.254 23.18 541.5 450.5 12.87 47.64 7.59 102.04 0.552 3.332 −19.52 3.808 0.0294 120 0.247 22.35 536.0 450.57 12.13 48.43 7.97 102.09 0.537 4.478 −21.95 3.685 0.0280 140 0.292 21.72 536.4 453.87 12.28 48.42 8.05 103.68 0.568 5.051 −22.73 3.647 0.0282 160 0.257 21.32 540.5 454.5 12.3 48.27 7.91 106.74 0.655 4.880 −22.50 3.702 0.0295 180 0.275 20.74 539.3 456.83 12.47 48.13 7.72 102.96 0.587 5.396 −25.10 3.783 0.0292 200 0.262 20.02 535.9 454.22 12.64 47.43 7.3 103.11 0.626 4.905 −25.78 3.941 0.0309 220 0.300 19.41 543.2 447.65 12.12 46.83 7.44 97.33 0.655 5.036 −24.80 3.815 0.0286 240 0.288 18.55 534.6 452.94 12.16 47.36 7.25 98.69 0.732 5.899 −25.41 3.960 0.0298 260 0.279 18.16 537.2 449.73 12.12 46.77 7.42 101.83 0.817 6.140 −25.81 3.824 0.0300 280 0.248 17.09 534.3 451.92 11.96 46.44 7.24 93.98 0.860 6.779 −27.81 3.888 0.0284 300 0.276 16.54 531.5 453.23 12.05 46.11 6.82 100.82 1.023 7.145 −27.27 4.099 0.0323 320 0.218 15.53 538.8 453.64 11.96 45.61 6.62 100.99 1.249 7.571 −28.66 4.175 0.0333 340 0.368 14.45 540.2 446.22 12.12 44.36 6.42 95.29 1.367 8.152 −29.02 4.192 0.0325 360 0.215 13.36 540.2 448.78 11.88 44.39 6.2 96.56 1.657 8.880 −30.16 4.338 0.0340 380 0.254 12.03 533.6 441.29 11.74 43.31 5.93 93.73 1.981 9.809 −31.44 4.431 0.0346 400 0.282 11.03 535.4 445.44 11.8 43.45 5.99 91.60 2.217 9.353 −31.32 4.400 0.0334 420 0.238 9.69 545.9 449.54 11.72 43.1 5.41 89.43 2.600 11.214 −32.33 4.833 0.0362 440 0.253 8.06 548.1 444.96 11.8 42.15 5.06 90.38 3.317 11.688 −31.80 5.047 0.0390 460 0.235 5.67 539.8 446.84 11.87 41.69 4.92 87.55 4.437 12.656 −33.81 5.134 0.0389 480 0.261 2.90 541.1 443.6 11.76 40.55 3.95 86.94 6.049 12.674 −35.07 6.221 0.0481 500 0.284 1.13 538.3 440.84 11.69 40.24 3.24 86.91 8.980 13.449 −25.59 7.542 0.0587 520 0.277 1.28 530.7 436.26 12.05 39.84 3.64 83.04 9.311 11.883 −23.87 6.647 0.0499 3.2 部分碱土金属元素浓度
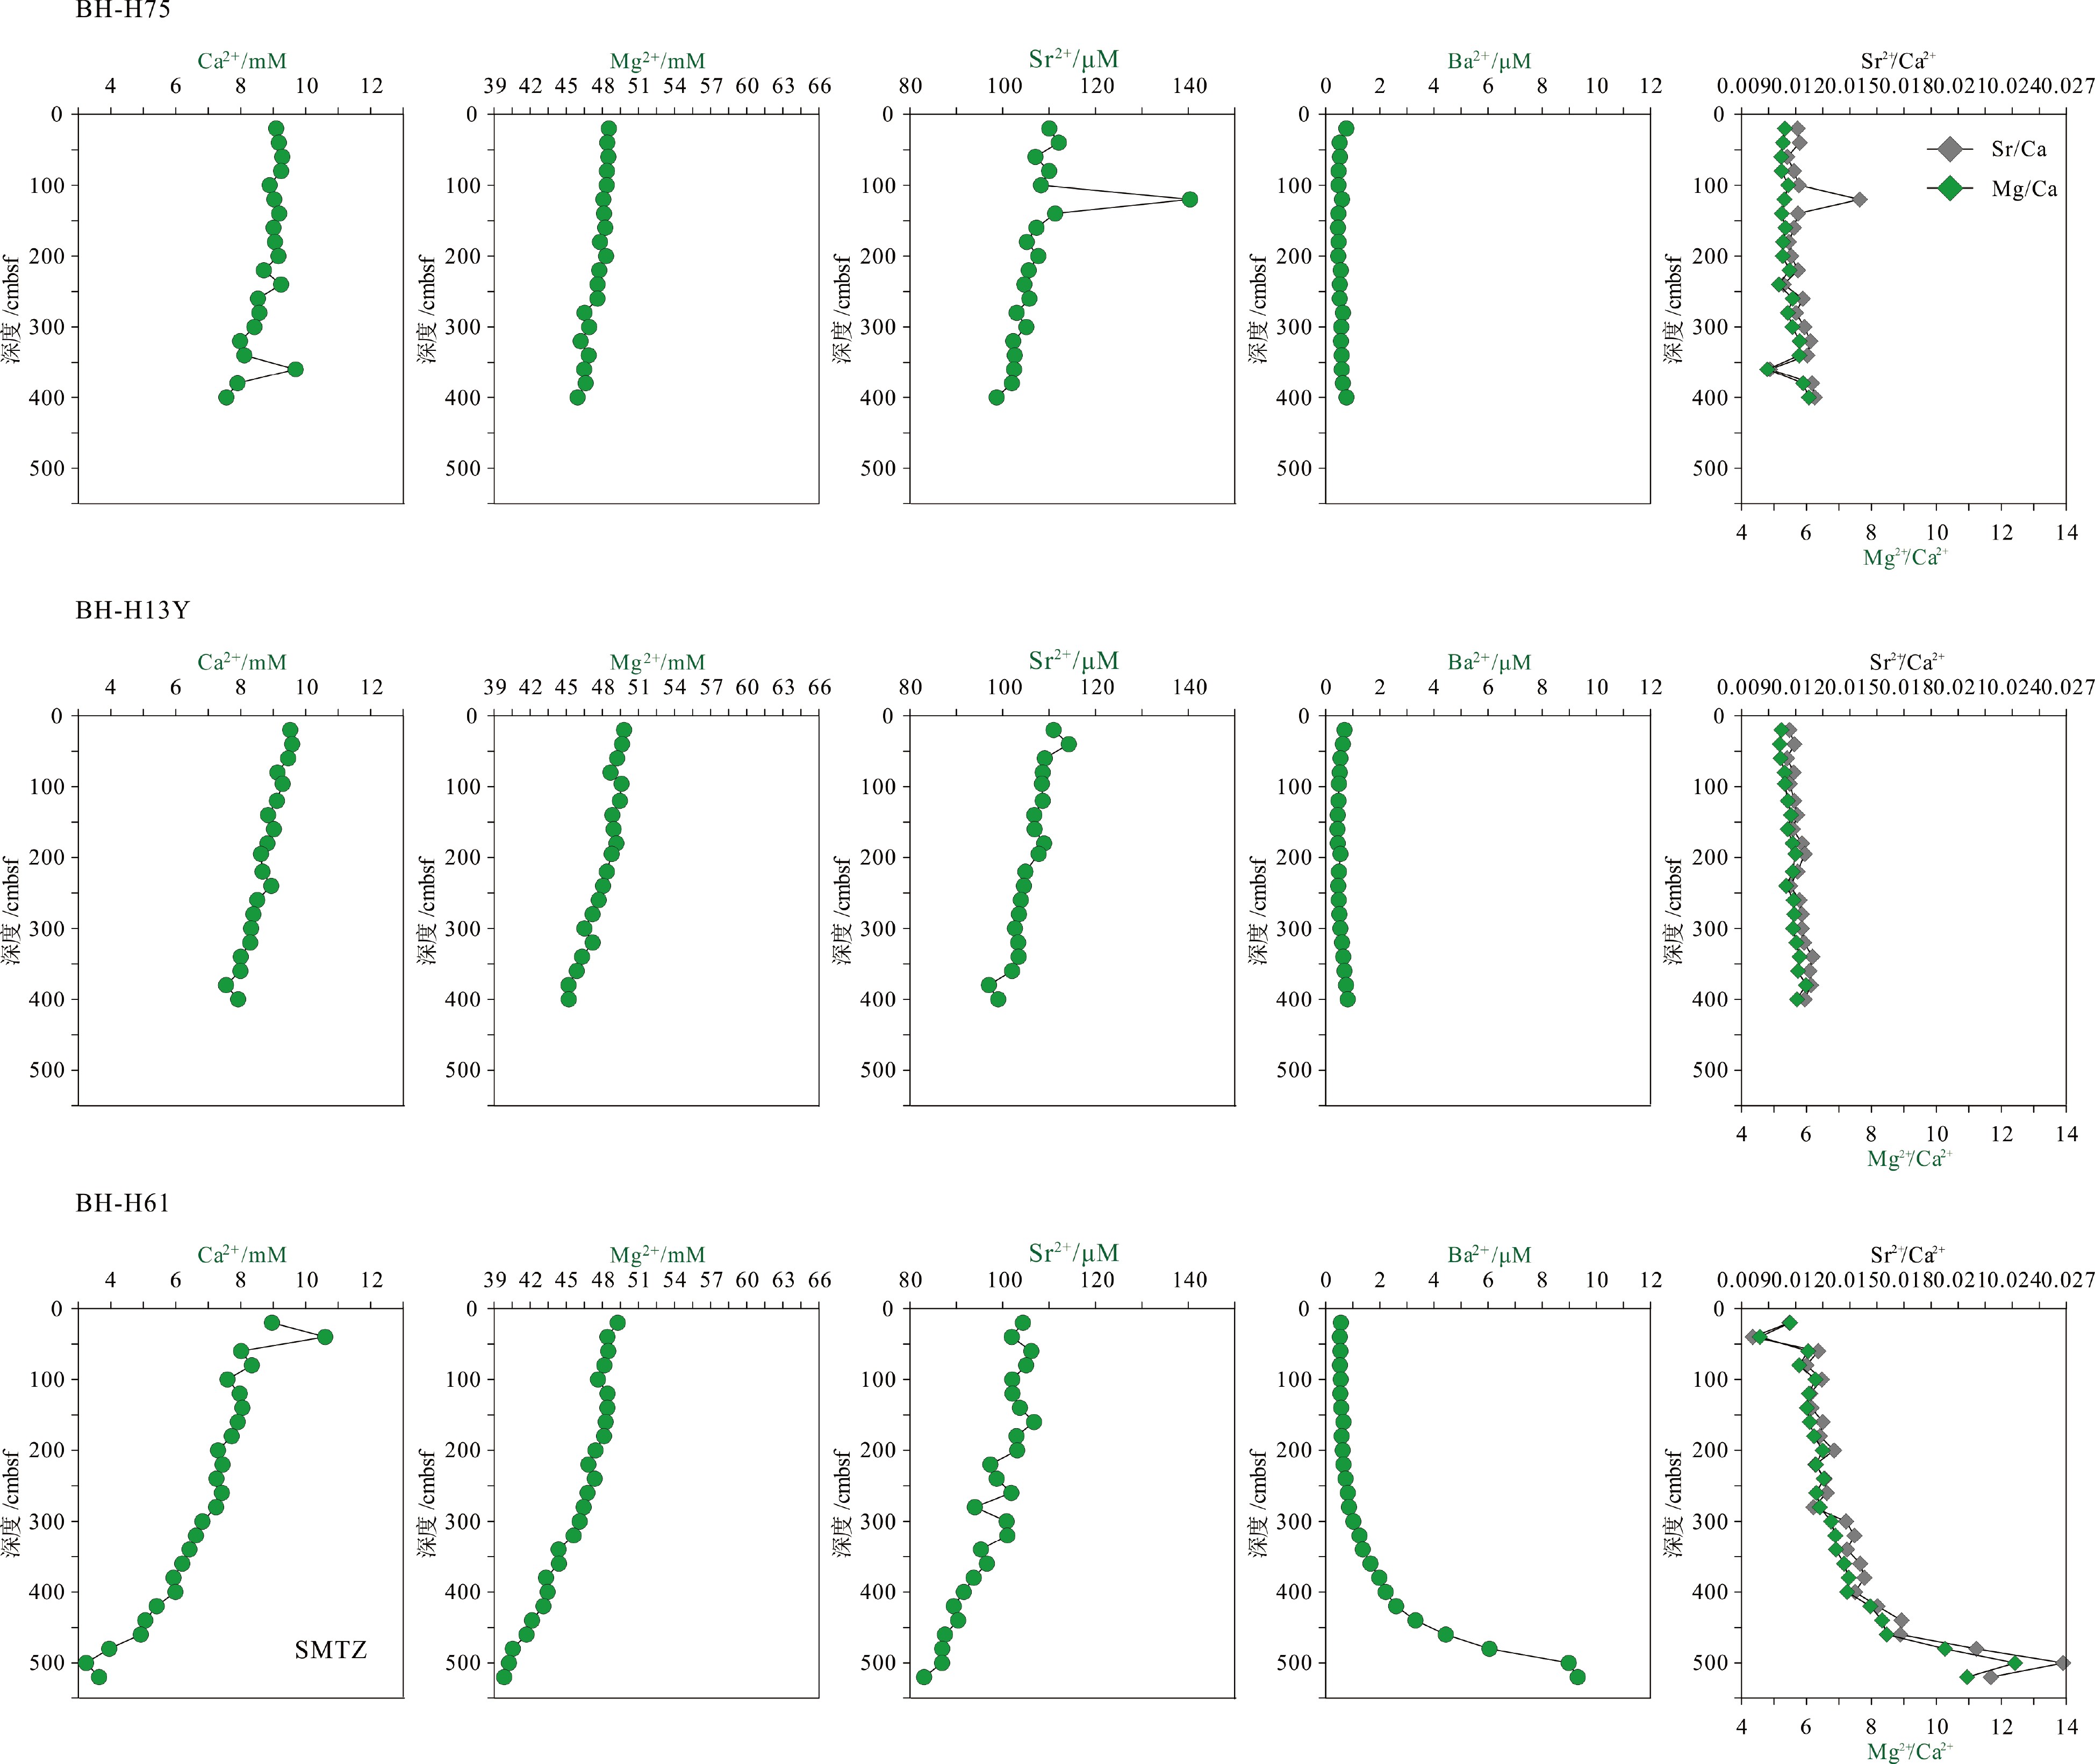
部分碱土金属元素浓度(Ca2+、Mg2+、Sr2+、Ba2+)深度剖面见图3(表2)。研究区3个沉积柱的Ca2+、Mg2+、Sr2+浓度均随深度逐渐降低,在BH-H75和BH-H13Y中仅观察到轻微的降低趋势,对应的Sr/Ca、Mg/Ca比值在深度剖面上轻微升高。而在BH-H61沉积柱中的Ca2+、Mg2+、Sr2+浓度的降低趋势更为显著,其中Ca2+、Mg2+浓度分别降低至沉积柱底部的3.24和39.84 mM,较典型海水值(分别为10.3和53.2 mM)分别贫化了68%和25%。Sr/Ca、Mg/Ca摩尔比值在BH-H61沉积柱底部达到峰值。Ba2+浓度在BH-H75和BH-H13Y沉积柱中均维持较低的水平(0.436~0.813 μM)。在BH-H61沉积柱上部(20~280 cmbsf),Ba2+浓度较低(0.523~0.86 μM);而在BH-H61沉积柱下部(300 cmbsf以下),Ba2+浓度随深度逐渐升高,在沉积柱底部达到峰值(9.31 μM)。
![]() 图 3 研究区BH-H75、BH-H13Y和BH-H61沉积物孔隙水中部分碱土金属元素浓度(Ca2+、Mg2+、Sr2+、Ba2+)、Sr/Ca与Mg/Ca比值深度剖面图Figure 3. Depth profiles of partial alkaline-earth metal elements (Ca2+, Mg2+, Sr2+, Ba2+) and Sr/Ca and Mg/Ca ratios of sediment pore water in BH-H75, BH-H13Y and BH-H61 sites
图 3 研究区BH-H75、BH-H13Y和BH-H61沉积物孔隙水中部分碱土金属元素浓度(Ca2+、Mg2+、Sr2+、Ba2+)、Sr/Ca与Mg/Ca比值深度剖面图Figure 3. Depth profiles of partial alkaline-earth metal elements (Ca2+, Mg2+, Sr2+, Ba2+) and Sr/Ca and Mg/Ca ratios of sediment pore water in BH-H75, BH-H13Y and BH-H61 sites4. 讨论
4.1 OSR与SD-AOM硫酸盐消耗比例
在3个沉积柱中,
${\rm{SO}}_4^{2 - }$ 浓度均随深度逐渐降低,${\rm{SO}}_4^{2 - }$ 在BH-H61站位的下降趋势最为显著(图2),而导致硫酸盐浓度降低的机制可能有稀释作用[22]、自生重晶石(BaSO4)形成[49]或硫酸盐还原反应[13-14,20]。氯元素在海水中化学性质较为保守,因此,它能示踪淡水稀释的行为。在冲绳海槽西部海底泥火山附近的C01和C10站位沉积物孔隙水中,Xu等[22]观察到周围孔隙水中离子浓度(如${\rm{SO}}_4^{2 - }$ 、Cl−浓度)降低,并推测可能由黏土矿物脱水的稀释作用导致[22]。本研究中,Cl−浓度随深度无显著变化,在典型海水值附近波动(图2,表2),表明研究区几乎未受稀释作用的影响。自生重晶石沉淀也会降低孔隙水中${\rm{SO}}_4^{2 - }$ 浓度[49],但由于研究区Ba2+浓度变化在微摩尔级(图3),而${\rm{SO}}_4^{2 - }$ 浓度变化在毫摩尔级(图2),因此,研究区即使有自生重晶石沉淀的生成,重晶石矿物的形成应该不会造成孔隙水中${\rm{SO}}_4^{2 - }$ 浓度梯度呈现如此显著的变化。在厌氧的海洋沉积物中,OSR和SD-AOM是消耗孔隙水中硫酸盐的两种重要途径[13, 20, 22],研究区3个沉积柱的${\rm{SO}}_4^{2 - }$ 浓度呈规律性下降,显示研究区极有可能发生了OSR或SD-AOM,或者两者同时发生。孔隙水中(△DIC+△Ca2++△Mg2+)/△SO42−比率图解是识别研究区沉积物孔隙水中OSR和SD-AOM最常用的方法[13-14,19,23-24]。OSR和SD-AOM消耗1 mol硫酸盐的同时,分别产生2和1 mol的碳酸氢根(反应式见式(1)和式(2)),即二者碳酸氢根产生量与硫酸盐消耗量的比值分别为2∶1和1∶1。因此,可根据孔隙水中碳酸氢根产生量与硫酸盐消耗量的不同比值来评估OSR和SD-AOM消耗硫酸盐的相对贡献。由于孔隙水中Ca2+、Mg2+离子也会消耗部分碳酸氢根,所以计算总碳酸氢根产生量时,还需考虑Ca2+和Mg2+离子消耗的碳酸氢根总量。首先,根据孔隙水中
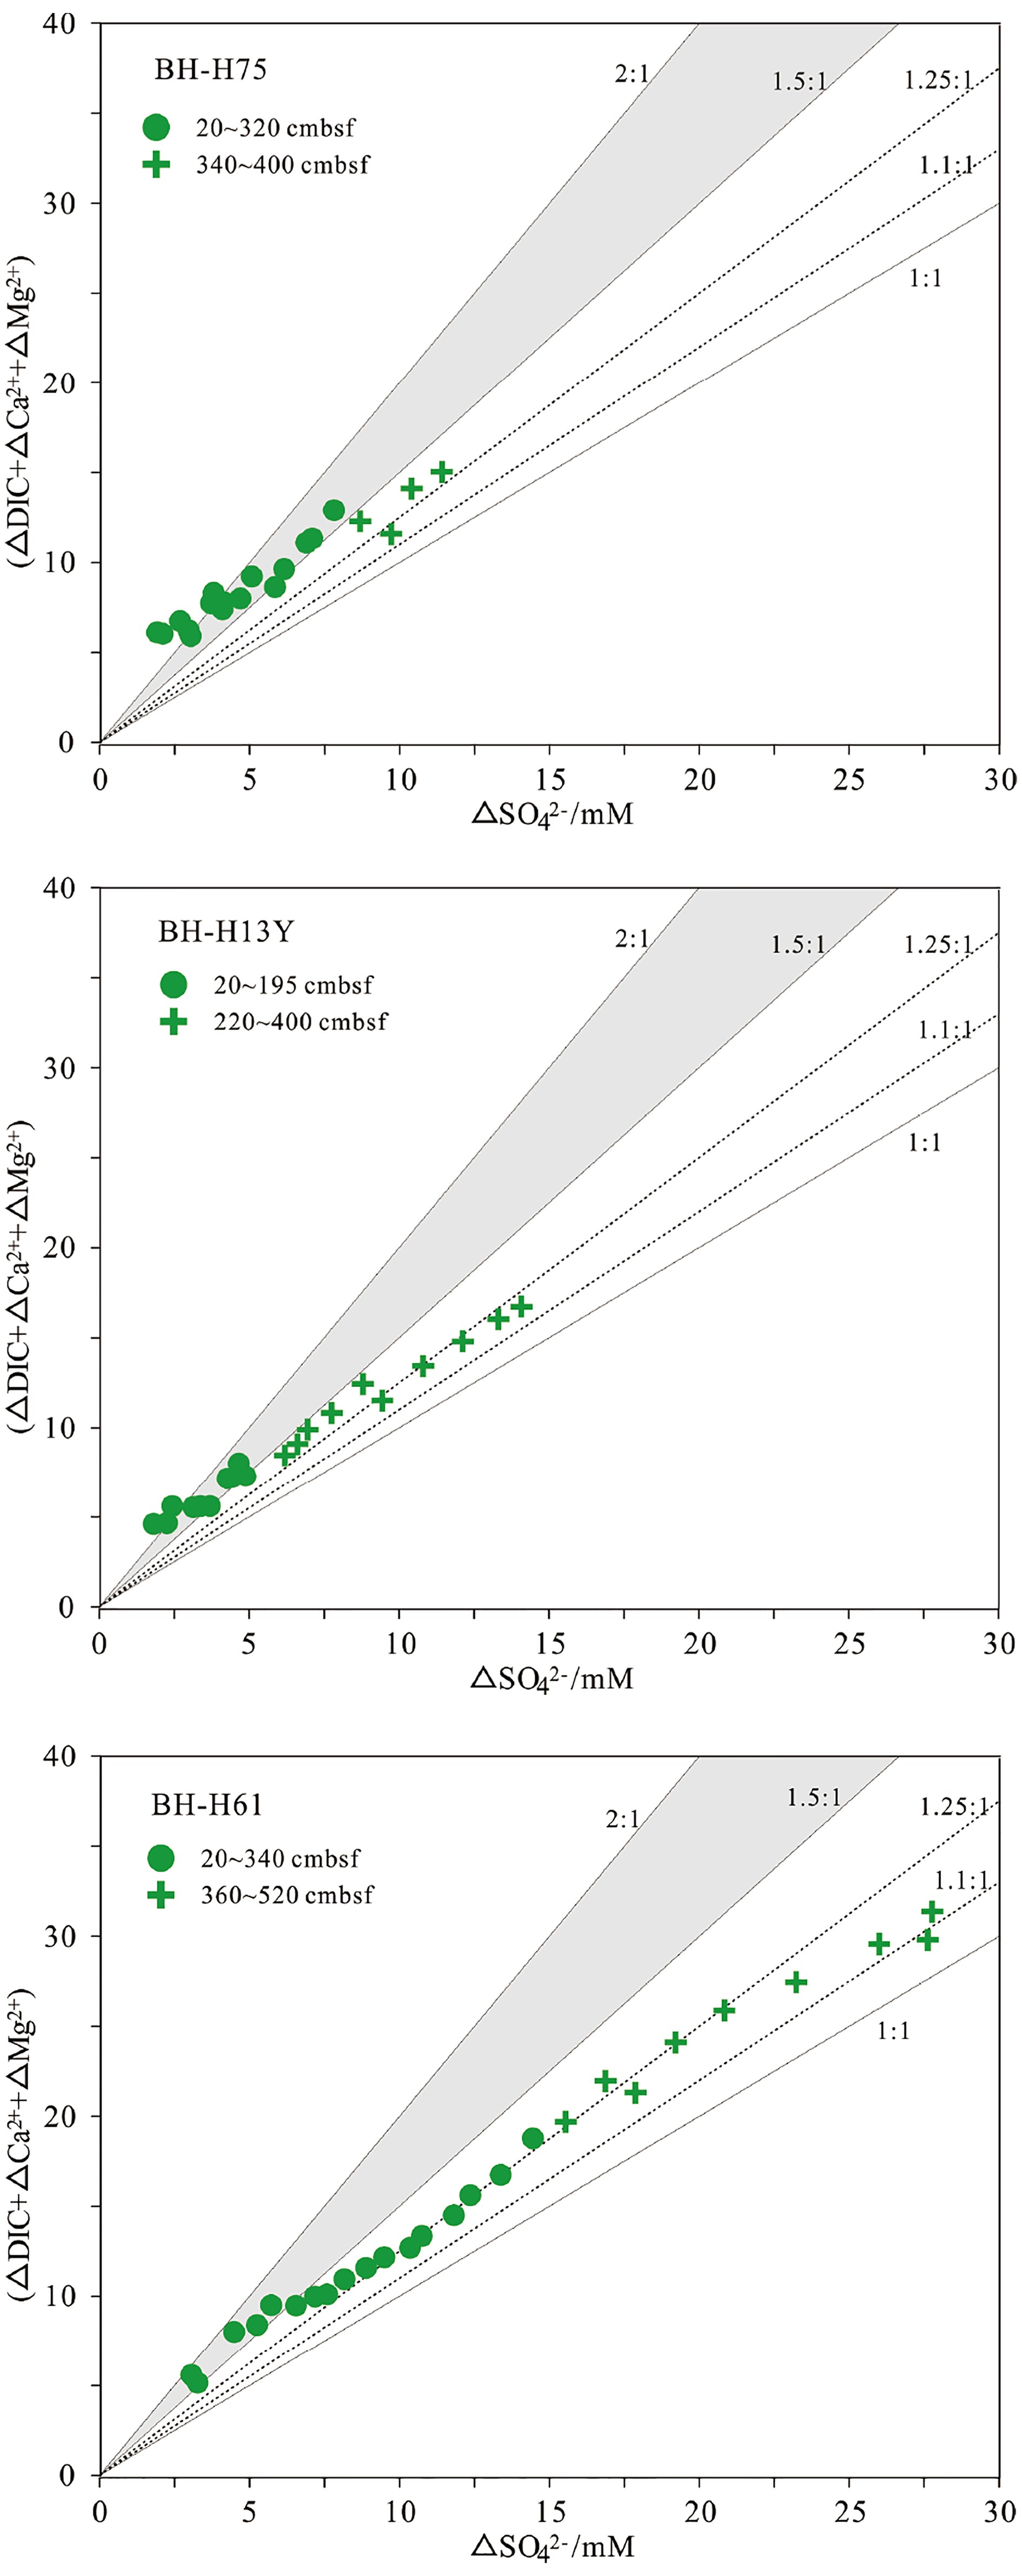
${\rm{SO}}_4^{2 - }$ 、DIC、Ca2+和Mg2+浓度与典型海水浓度(${\rm{SO}}_4^{2 - }$ :28.9 mM;DIC:2.1 mM;Ca2+:10.3 mM;Mg2+:53.2 mM)的差异可以分别计算出△${\rm{SO}}_4^{2 - }$ 、△DIC、△Ca2+和△Mg2+。随后根据(△DIC+△Ca2++△Mg2+)/△SO42−比值来评估OSR和SD-AOM的相对比例。3个沉积柱的(△DIC+△Ca2++△Mg2+)/△SO42−比值见图4。在BH-H75的20~320 cmbsf深度内,数据在2∶1和1.5∶1实线内分布,表明在此深度内OSR占主导;在340~400 cmbsf深度间隔内,数据在1.5∶1和1∶1线内分布,表明靠近沉积柱底部可能受SD-AOM的影响。在BH-H13Y站位的20~195 cmbsf深度内,数据在2∶1和1.5∶1实线内分布,表明在此深度内OSR占主导;而在220~400 cmbsf深度内,数据在1.5∶1和1∶1线内分布(主要围绕1.25∶1虚线分布),表明靠近沉积柱底部SD-AOM占主导地位(约75%)。BH-H61的数据变化趋势呈现一定规律性。在BH-H61的20~340 cmsbf深度内,数据靠近1.25∶1虚线分布,显示SD-AOM占主导(约75%);在360~520 cmsbf深度内,数据在1.25∶1和1.1∶1虚线内分布,显示SD-AOM占主导(平均82.5%)。![]() 图 4 孔隙水中硫酸盐的消耗量与DIC的产生量(Ca2+、Mg2+离子校正后)的相关关系图图中2∶1、1∶1的实线分别代表OSR和SD-AOM的贡献为100%,在这两个实线内,表示这两个过程均发生。其中1.5∶1实线表示OSR和AOM各占50%;1.25∶1和1.1∶1虚线表示SD-AOM的贡献分别占75%和90%,OSR仅占25%和10%。Figure 4. Relationship between the consumption of sulfate and the production of DIC (After correction by Ca2+ and Mg2+ ions)The solid lines of 2∶1 and 1∶1 in the figure represent the 100% contribution of OSR and SD-AOM respectively. Within these two solid lines, It indicates both processes occur. The 1.5∶1 solid line indicates OSR and AOM account for 50% respectively;The dashed lines of 1.25∶1 and 1.1∶1 indicate the contribution of SD-AOM accounts for 75% and 90%, while OSR accounts for only 25% and 10%.
图 4 孔隙水中硫酸盐的消耗量与DIC的产生量(Ca2+、Mg2+离子校正后)的相关关系图图中2∶1、1∶1的实线分别代表OSR和SD-AOM的贡献为100%,在这两个实线内,表示这两个过程均发生。其中1.5∶1实线表示OSR和AOM各占50%;1.25∶1和1.1∶1虚线表示SD-AOM的贡献分别占75%和90%,OSR仅占25%和10%。Figure 4. Relationship between the consumption of sulfate and the production of DIC (After correction by Ca2+ and Mg2+ ions)The solid lines of 2∶1 and 1∶1 in the figure represent the 100% contribution of OSR and SD-AOM respectively. Within these two solid lines, It indicates both processes occur. The 1.5∶1 solid line indicates OSR and AOM account for 50% respectively;The dashed lines of 1.25∶1 and 1.1∶1 indicate the contribution of SD-AOM accounts for 75% and 90%, while OSR accounts for only 25% and 10%.此外,孔隙水中δ13CDIC变化特征也能定性辨别OSR和SD-AOM[9,24]。研究区DIC的可能来源包括:①底部海水向下扩散或原位储存于孔隙水中的DIC;②有机质降解过程产生的DIC;③AOM产生的DIC;④产甲烷作用残余的DIC向上迁移混合。这些不同来源DIC的δ13CDIC值不尽相同,因此,可用δ13CDIC值的变化特征识别产生DIC的生物地球化学过程。本研究中,3个沉积柱的δ13CDIC均随深度逐渐降低。BH-H75的δ13CDIC值在沉积柱底部降低至−15.69‰,在海水(δ13C约为0)和南海沉积有机质碳同位素值(δ13C约为−20‰)[50]范围内,表明BH-H75可能主要受OSR影响,且底部受SD-AOM的影响较小。δ13CDIC在BH-H13Y沉积柱底部降低至−28.4‰,轻于沉积有机质的δ13C值(约−20‰),推测其DIC可能来自于深部SD-AOM、浅部OSR混合。在BH-H61底部的480 cmbsf处,δ13CDIC降低至最小值(−35.07‰),结合(△DIC+△Ca2++△Mg2+)/△SO42−比率图解结果(图4),认为孔隙水中DIC主要来源于SD-AOM。然而在BH-H61的480 cmbsf深度以下,δ13CDIC值呈轻微正偏(−35.07‰~−23.87‰),这种现象可能与底部微生物产甲烷作用有关。由于产甲烷作用的微生物优先消耗反应物二氧化碳或乙酸中轻的12C同位素,导致残余DIC中富集13C同位素[51],这种富13C同位素的DIC向上迁移混合,使得上覆沉积物孔隙水中δ13CDIC值正偏[28]。BH-H61站位的地温梯度为36.1 K/km(海底温度约2.6 ℃)(表1),考虑到微生物介导的产甲烷过程发生的温度低于50 ℃[5,52],因此,微生物产甲烷作用在BH-H61底部发生的可能性较大。总之,(△DIC+△Ca2++△Mg2+)/△SO42−比率图解与δ13CDIC值深度剖面特征显示在BH-H13Y沉积柱中OSR和SD-AOM共同作用,而在BH-H75沉积柱中OSR占主导,在BH-H61沉积柱中SD-AOM占主导,且其底部可能存在微生物产甲烷作用。
4.2 SMTZ深度与甲烷通量的估算
SMTZ深度主要由上升的甲烷通量控制,一般相对较高的甲烷通量对应较浅的SMTZ深度,反之则相反[53-54]。SMTZ深度计算一般根据最小二乘线性回归的方法进行拟合,再外推硫酸盐降低为0 mM时对应的深度[13-14,21,31],但前提是沉积柱是AOM主导的生物地球化学过程。因此,计算SMTZ深度时,不考虑研究区OSR占主导的BH-H75沉积柱以及BH-H13Y沉积柱上部(20~195 cmbsf)。在BH-H13Y沉积柱下部(220~400 cmbsf)SD-AOM主导,根据线性回归的方法推断其SMTZ深度约为700 cmbsf(图5)。此外,
${\rm{SO}}_4^{2 - }$ 浓度、DIC浓度最大值和δ13CDIC最小值也可用于判定SMTZ深度[55]。在BH-H61中,${\rm{SO}}_4^{2 - }$ 浓度的变化与DIC浓度最大值和δ13CDIC最小值具有很好的一致性,从而推测其SMTZ深度为480 cmbsf(图2,图5),这与Feng等在北康盆地BH-CL29站位观察的SMTZ的深度(530 cmbsf)接近[21]。但总的来说,北康盆地研究区观察的SMTZ深度(480和700 cmbsf)均浅于邻近海域南沙海槽的SMTZ深度(800~1 100 cmbsf)[56]。由于取样过程的降压和去气,测试的甲烷浓度远低于真实浓度(图2),所以用测试的甲烷浓度计算甲烷通量十分不准确。但是SD-AOM消耗硫酸盐与甲烷的比例为1∶1,可用硫酸盐通量近似代替进入SMTZ中的甲烷通量。值得注意的是,BH-H61和BH-H13Y沉积柱上部的硫酸盐通量远低于下部(图5),可能指示向上迁移的甲烷通量在时间上逐渐增强,从而反映一种非稳态环境下甲烷通量的变化模式[57]。BH-H61上部(20~340 cmbsf)硫酸盐向下扩散的通量为30 mmol•m−2•a−1,且SD-AOM消耗硫酸盐比例为75%,推算早期甲烷渗漏通量为22 mmol•m−2•a−1(图5);BH-H61下部(360~520 cmbsf)硫酸盐向下扩散的通量为72.4 mmol•m−2•a−1,SD-AOM消耗硫酸盐比例为82%,推算现今甲烷渗漏通量为60 mmol•m−2•a−1(图5),比早期甲烷渗漏通量增加了38 mmol•m−2•a−1。BH-H13Y上部的硫酸盐向下扩散通量为15 mmol•m−2•a−1,但这些硫酸盐主要被有机质降解消耗,表明前期的微弱甲烷渗漏对孔隙水化学组成的影响较少;在该沉积柱下部(220~400 cmbsf深度间隔内)硫酸盐向下扩散的通量为40 mmol•m−2•a−1,且SD-AOM对硫酸盐消耗的贡献为75%(图4),因此,估算现今的甲烷渗漏通量为30 mmol•m−2•a−1(图5)。本文估算的甲烷通量变化范围为22~60 mmol•m−2•a−1,与Feng等[21]在北康盆地研究区通过反应-传输模型模拟的结果接近(34.6~62.7 mmol•m-2•a−1)。南海北部的东沙海域(35~59 mmol•m−2•a−1)[14,32]和南海北部西沙海域麻坑区(14 mmol•m−2•a−1)[13]以及布莱克海台(20 mmol•m−2•a−1)[58]的计算数据也与本文结果具有很好的一致性。但是,本文估算的甲烷通量低于墨西哥湾海域(20~200 mmol•m−2•a−1)[59]和挪威中部G11麻坑区(300~540 mmol•m−2•a−1)[24],可能指示相对较低的甲烷渗漏环境。综上所述,BH-H61和BH-H13Y沉积柱中记录的较浅的SMTZ深度、上升的DIC浓度和强烈负偏的δ13CDIC值指示研究区存在甲烷渗漏活动,并且,向下变陡的硫酸盐浓度梯度表明甲烷渗漏强度随时间增强。![]() 图 5 BH-H13Y、BH-H61的硫酸盐浓度深度剖面图和SMTZ深度与甲烷通量Figure 5. Depth profiles of sulfate concentrations, the depth of SMTZ and the methane flux in BH-H13Y and BH-H61 sites
图 5 BH-H13Y、BH-H61的硫酸盐浓度深度剖面图和SMTZ深度与甲烷通量Figure 5. Depth profiles of sulfate concentrations, the depth of SMTZ and the methane flux in BH-H13Y and BH-H61 sites4.3 自生碳酸盐岩形成与重晶石溶解的孔隙水地球化学证据
自生碳酸盐岩沉淀能有效减少沉积物向上覆海水中释放的碳通量,在全球海洋碳循环中发挥重要作用[18,60]。有机质降解(产甲烷作用除外)和AOM产生的DIC提高孔隙水中碱度的同时,还能促进自生碳酸盐岩形成[61]。研究区孔隙水DIC浓度的升高(图2)对应Ca2+、Mg2+、Sr2+浓度的降低(图3,表2),表明可能有自生碳酸盐岩沉淀生成。研究区孔隙水中Mg2+/Ca2+摩尔比值随深度逐渐升高(图3),其中在BH-H61升高趋势最为显著,在SMTZ深度均达到最大值,可能指示有低Mg2+/Ca2+比值(<4.86)的自生碳酸盐岩矿物形成,包括高镁方解石和文石(高镁方解石的Mg2+/Ca2+摩尔比为0.28;文石的Mg2+/Ca2+摩尔比为0.00125)[61-62]。沉淀的碳酸盐矿物种类也可用于指示沉积物中甲烷的传输行为[18]:文石倾向形成于高硫酸盐浓度和中—强甲烷渗漏环境,发育于近沉积物-水界面的沉积物中;而高镁方解石则倾向形成于低硫酸盐浓度和低—中等强度的甲烷渗漏环境,沉淀在SMTZ附近及以上沉积物孔隙中,孔隙水中的高硫酸盐浓度会对其形成产生抑制作用[63]。此外,孔隙水中Sr2+/Ca2+比值变化特征可进一步识别自生碳酸盐岩的矿物种类[25]。Sr2+/Ca2+摩尔比随深度逐渐升高(图3),表明在研究区可能有低Sr2+/Ca2+比值(<0.011)的高镁方解石矿物形成(高镁方解石的Sr2+/Ca2+摩尔比为0.003) [62]。图6展示了孔隙水中Mg/Ca与 Sr/Ca相关关系图,可看出研究区孔隙水数据靠近高镁方解石沉淀线一侧分布,数据变化趋势与高镁方解石沉淀线以及前人数据趋势一致[62],进一步指示可能存在高镁方解石沉淀。研究区沉积物孔隙水中出现高镁方解石沉淀的证据,而缺乏文石沉淀的证据,粗略指示研究区的甲烷渗漏可能处于低—中等强度,这与本研究甲烷通量的计算结果相符。
![]() 图 6 研究区孔隙水中Mg/Ca- Sr/Ca图中两条实线表示当孔隙水中形成文石或者髙镁方解石时,孔隙水相对于海水Mg/Ca和Sr/Ca的变化关系,灰色菱形为前人的数据[62],绿色菱形代表研究区3个沉积柱的数据。Figure 6. The weight ratio of Mg/Ca vs. Sr/Ca in sediment pore water of the study areaTwo solid lines indicate the change relationship of pore water Mg/Ca and Sr/Ca with respect to that of seawater, when aragonite or high Mg-calcite is formed in sedimentary pore water. Grey diamonds in the figure are the previous data[62]. Green diamonds represent the data of the three sedimentary columns of the study area.
图 6 研究区孔隙水中Mg/Ca- Sr/Ca图中两条实线表示当孔隙水中形成文石或者髙镁方解石时,孔隙水相对于海水Mg/Ca和Sr/Ca的变化关系,灰色菱形为前人的数据[62],绿色菱形代表研究区3个沉积柱的数据。Figure 6. The weight ratio of Mg/Ca vs. Sr/Ca in sediment pore water of the study areaTwo solid lines indicate the change relationship of pore water Mg/Ca and Sr/Ca with respect to that of seawater, when aragonite or high Mg-calcite is formed in sedimentary pore water. Grey diamonds in the figure are the previous data[62]. Green diamonds represent the data of the three sedimentary columns of the study area.一般地,海洋沉积物中的钡元素少量以自生重晶石形式存在,大部分主要赋存于铝硅酸盐中[64]。因为重晶石和铝硅酸盐中硫酸钡溶解度低,所以海水及沉积物孔隙水中的Ba2+浓度也较低。然而,SD-AOM对孔隙水中硫酸盐的消耗促进重晶石的溶解,从而释放Ba2+离子进入孔隙水。尤其在硫酸盐浓度严重亏损的SMTZ中,大量Ba2+离子被释放进入SMTZ层位,并在SMTZ深度内形成显著的Ba峰[49,54]。在研究区,BH-H75和BH-H13Y沉积柱以及BH-H61沉积柱上部(20~280 cmbsf),Ba2+浓度变化趋势不明显(0.436~0.86 μM),可能仅继承了原位海水的浓度特征。然而在BH-H61沉积柱下部(300 cmbsf以下),Ba2+浓度随深度逐渐升高,在柱子底部达到最大值9.31 μM(图3),表明重晶石可能在SMTZ附近及下部出现了溶解作用。
5. 结论
(1)BH-H75、BH-H13Y、BH-H61沉积柱中均发生了硫酸盐还原反应(OSR或SD-AOM),但每个沉积柱中OSR和SD-AOM的贡献存在差异。(△DIC+△Ca2++△Mg2+)/△SO42−比值和DIC的13C同位素特征表明在BH-H75沉积柱中OSR占主导,在BH-H61沉积柱中SD-AOM占主导,在BH-H13Y站位,浅部发生了OSR,深部发生了SD-AOM。
(2)根据线性拟合硫酸盐浓度及DIC浓度最大值、δ13CDIC最小值特征推测BH-H13Y和BH-H61的SMTZ深度约为700和480 cmbsf。BH-H61和BH-H13Y沉积柱中,较浅的SMTZ深度、上升的DIC浓度和强烈负偏的δ13CDIC值指示研究区存在甲烷渗漏活动。BH-H61和BH-H13Y的硫酸盐浓度梯度向下逐渐变陡,可能表明甲烷渗漏强度随时间增强。根据硫酸盐扩散通量估算,BH-H61沉积柱上部记录的早期甲烷渗漏通量为22 mmol•m−2•a−1;下部记录的现今甲烷渗漏通量为60 mmol•m−2•a−1,较早期增加了38 mmol•m−2•a−1,可能显示甲烷渗漏强度随时间逐渐增强的趋势。BH-H13Y沉积柱上部的硫酸盐主要被有机质降解所消耗,下部记录的甲烷渗漏通量为30 mmol•m−2•a−1。
(3)孔隙水中部分碱土金属离子浓度变化特征及Mg/Ca与 Sr/Ca比值指示在3个沉积柱中存在自生碳酸盐岩矿物的沉淀,且以高镁方解石沉淀为主,与根据硫酸盐扩散通量估算的低—中等强度甲烷渗漏通量相符。在BH-H61沉积柱下部,Ba2+浓度变化特征显示重晶石可能在SMTZ附近及下部出现了溶解作用。
-
![]()
![]()
图 2 研究区BH-H75、BH-H13Y、BH-H61站位沉积物孔隙水中阴离子组分、CH4、DIC及其δ13CDIC的深度剖面图
Figure 2. Depth profile of anion components, methane, DIC and δ13CDIC values in sediment pore water of BH-H75, BH-H13Y and BH-H61 sites
![]()
图 3 研究区BH-H75、BH-H13Y和BH-H61沉积物孔隙水中部分碱土金属元素浓度(Ca2+、Mg2+、Sr2+、Ba2+)、Sr/Ca与Mg/Ca比值深度剖面图
Figure 3. Depth profiles of partial alkaline-earth metal elements (Ca2+, Mg2+, Sr2+, Ba2+) and Sr/Ca and Mg/Ca ratios of sediment pore water in BH-H75, BH-H13Y and BH-H61 sites
![]()
图 4 孔隙水中硫酸盐的消耗量与DIC的产生量(Ca2+、Mg2+离子校正后)的相关关系图
图中2∶1、1∶1的实线分别代表OSR和SD-AOM的贡献为100%,在这两个实线内,表示这两个过程均发生。其中1.5∶1实线表示OSR和AOM各占50%;1.25∶1和1.1∶1虚线表示SD-AOM的贡献分别占75%和90%,OSR仅占25%和10%。
Figure 4. Relationship between the consumption of sulfate and the production of DIC (After correction by Ca2+ and Mg2+ ions)
The solid lines of 2∶1 and 1∶1 in the figure represent the 100% contribution of OSR and SD-AOM respectively. Within these two solid lines, It indicates both processes occur. The 1.5∶1 solid line indicates OSR and AOM account for 50% respectively;The dashed lines of 1.25∶1 and 1.1∶1 indicate the contribution of SD-AOM accounts for 75% and 90%, while OSR accounts for only 25% and 10%.
![]()
图 5 BH-H13Y、BH-H61的硫酸盐浓度深度剖面图和SMTZ深度与甲烷通量
Figure 5. Depth profiles of sulfate concentrations, the depth of SMTZ and the methane flux in BH-H13Y and BH-H61 sites
![]()
图 6 研究区孔隙水中Mg/Ca- Sr/Ca
图中两条实线表示当孔隙水中形成文石或者髙镁方解石时,孔隙水相对于海水Mg/Ca和Sr/Ca的变化关系,灰色菱形为前人的数据[62],绿色菱形代表研究区3个沉积柱的数据。
Figure 6. The weight ratio of Mg/Ca vs. Sr/Ca in sediment pore water of the study area
Two solid lines indicate the change relationship of pore water Mg/Ca and Sr/Ca with respect to that of seawater, when aragonite or high Mg-calcite is formed in sedimentary pore water. Grey diamonds in the figure are the previous data[62]. Green diamonds represent the data of the three sedimentary columns of the study area.
表 1 南海南部北康盆地海域采集的3个沉积柱信息
Table 1 Information of three sedimentary columns collected from the Beikang Basin in the southern SCS
站位 北纬 东经 水深/m 岩心长度/cm 海底温度/℃ 校准地温梯度/(K/km) BH-H75 6.8482° 112.8052° 1 663 397 2.826 88.9 BH-H13Y 6.7107° 111.4839° 1 867 400 2.61 87.2 BH-H61 6.4809° 111.7519° 1 938 518 2.585 36.1  下载: 导出CSV
表 2 BH-H75、BH-H13Y和BH-H61站位沉积物孔隙水中甲烷浓度、阴离子(SO42−、Cl−)、主微量元素(Na+、K+、Ca2+、Mg2+、Sr2+、Ba2+)、DIC和δ13CDIC、Sr/Ca与Mg/Ca比值特征
Table 2 Features of methane concentration, anions (SO42−、Cl−), major trace elements (Na+、K+、Ca2+、Mg2+、Sr2+、Ba2+), DIC and δ13CDIC, Sr/Ca and Mg/Ca ratios of sediment pore water in BH-H75, BH-H13Y and BH-H61 sites
站位 取样深度/
cmbsfCH4/
mMSO42−/
mMCl−/
mMNa+/
mMK+/
mMMg2+/
mMCa2+/
mMSr2+/
μMBa2+/
μMDIC/
mMδ13CDIC/
‰Mg/Ca Sr/Ca BH-H75 20 0.176 26.99 540.4 443.3 12.42 48.54 9.09 110.02 0.763 2.347 −7.23 3.238 0.0265 40 0.200 26.80 531.5 442.75 12.47 48.41 9.17 112.07 0.517 2.217 −6.26 3.202 0.0267 60 0.179 25.87 529.6 444.57 12.69 48.49 9.28 107.03 0.527 2.282 −6.65 3.167 0.0252 80 0.161 25.94 534.5 444.81 12.85 48.38 9.24 109.98 0.476 2.455 −7.96 3.174 0.0260 100 0.172 26.22 541.9 445.53 12.89 48.36 8.89 108.24 0.473 2.593 −6.73 3.299 0.0266 120 0.162 25.19 536.1 442.19 11.69 48.08 9.03 140.37 0.604 3.449 −10.64 3.228 0.0340 140 0.170 24.81 532.3 443.87 12.17 48.13 9.18 111.29 0.467 3.309 −9.44 3.181 0.0265 160 0.248 24.78 541.5 444.44 12.3 48.24 9.01 107.27 0.453 3.657 −10.32 3.248 0.0260 180 0.182 25.10 554.8 441.66 12.04 47.81 9.05 105.17 0.477 3.780 −10.52 3.203 0.0254 200 0.204 24.21 541.9 446.06 12.28 48.3 9.16 107.66 0.462 4.059 −10.90 3.199 0.0257 220 0.203 23.83 543.1 442.09 12.01 47.74 8.71 105.59 0.554 4.267 −10.58 3.325 0.0265 240 0.194 23.06 533.2 443.16 12.18 47.6 9.24 104.66 0.522 4.072 −10.75 3.125 0.0248 260 0.251 22.75 536.6 443.3 12.06 47.59 8.53 105.72 0.519 4.355 −11.65 3.383 0.0271 280 0.200 22.01 531.7 436.13 12.07 46.52 8.57 102.99 0.634 4.786 −10.85 3.292 0.0263 300 0.231 21.81 539.2 441.42 12.04 46.9 8.42 105.08 0.572 5.251 −12.30 3.379 0.0273 320 0.241 21.09 541.7 437.66 11.85 46.2 7.98 102.24 0.559 5.678 −12.77 3.510 0.0280 340 0.230 20.21 539.2 446.32 12.19 46.86 8.11 102.58 0.591 5.856 −12.63 3.502 0.0276 360 0.259 19.18 537.5 443.86 12.08 46.49 9.69 102.43 0.592 6.364 −13.60 2.911 0.0231 380 0.227 18.50 540.9 448.83 12.29 46.61 7.9 101.95 0.631 7.210 −13.78 3.578 0.0282 400 0.255 17.49 535.6 444.61 12.05 45.94 7.56 98.68 0.769 7.132 −14.29 3.685 0.0285 BH-H13Y 20 0.182 27.09 543.43 457.45 12.67 49.8 9.52 110.95 0.695 2.524 −10.90 3.171 0.0255 40 0.223 26.65 541.46 457.73 12.76 49.63 9.58 114.23 0.630 2.461 −8.37 3.143 0.0261 60 0.249 26.47 550.53 454.46 12.55 49.23 9.46 109.03 0.543 2.892 −10.27 3.156 0.0252 80 0.213 25.77 544.72 447.61 12.26 48.67 9.13 108.59 0.520 1.942 −11.84 3.231 0.0260 96 0.223 25.52 544.89 456.75 12.6 49.59 9.29 108.43 0.491 3.082 −13.23 3.237 0.0255 120 0.148 25.21 547.51 455.22 12.96 49.45 9.11 108.59 0.473 2.766 −14.23 3.293 0.0261 140 0.152 24.63 543.91 451.65 12.56 48.83 8.84 106.81 0.446 3.428 −15.44 3.350 0.0264 160 0.158 24.47 547.45 451.41 12.48 48.94 9.02 106.87 0.436 3.769 −16.12 3.289 0.0259 180 0.182 24.03 545.01 457.18 12.44 49.17 8.82 108.91 0.447 3.884 −17.32 3.380 0.0270 195 0.192 24.25 556.92 452.68 12.31 48.78 8.62 107.75 0.543 3.998 −17.94 3.431 0.0273 220 0.179 22.71 543.81 452.49 12.32 48.37 8.67 104.89 0.490 4.095 −18.02 3.384 0.0265 240 0.184 22.29 540.84 451.25 12.22 48.06 8.94 104.56 0.461 4.686 −19.49 3.259 0.0256 260 0.244 21.95 546.77 448.87 12.03 47.7 8.51 103.90 0.483 4.713 −20.54 3.401 0.0267 280 0.230 21.15 543.46 449.36 12.01 47.18 8.39 103.50 0.508 4.991 −21.72 3.409 0.0270 BH-H13Y 300 0.215 20.11 537.08 447.42 12 46.51 8.32 102.63 0.539 5.861 −22.49 3.391 0.0270 320 0.212 19.46 546.95 453.52 12 47.19 8.29 103.31 0.604 5.592 −22.87 3.453 0.0272 340 0.283 18.10 541.56 449.22 11.85 46.31 8 103.42 0.645 6.344 −25.37 3.509 0.0282 360 0.235 16.78 535.98 449.7 11.8 45.87 7.99 102.00 0.693 7.263 −26.09 3.484 0.0279 380 0.276 15.59 533.93 444.82 12.66 45.19 7.55 97.01 0.754 7.374 −26.96 3.628 0.0281 400 0.267 14.82 547.52 449.07 11.56 45.21 7.92 99.01 0.813 8.463 −28.40 3.462 0.0273 BH-H61 20 0.247 25.84 538.4 454.1 13.09 49.28 8.96 104.35 0.558 2.422 −13.08 3.335 0.0255 40 0.262 25.64 551.9 451.77 13.14 48.42 10.6 101.93 0.523 2.766 −15.33 2.769 0.0210 60 0.316 24.42 542.6 453.09 13.01 48.48 8.01 106.13 0.543 3.096 −17.09 3.672 0.0290 80 0.273 23.65 542.6 451.84 12.81 48.16 8.34 105.04 0.527 3.491 −19.05 3.500 0.0275 100 0.254 23.18 541.5 450.5 12.87 47.64 7.59 102.04 0.552 3.332 −19.52 3.808 0.0294 120 0.247 22.35 536.0 450.57 12.13 48.43 7.97 102.09 0.537 4.478 −21.95 3.685 0.0280 140 0.292 21.72 536.4 453.87 12.28 48.42 8.05 103.68 0.568 5.051 −22.73 3.647 0.0282 160 0.257 21.32 540.5 454.5 12.3 48.27 7.91 106.74 0.655 4.880 −22.50 3.702 0.0295 180 0.275 20.74 539.3 456.83 12.47 48.13 7.72 102.96 0.587 5.396 −25.10 3.783 0.0292 200 0.262 20.02 535.9 454.22 12.64 47.43 7.3 103.11 0.626 4.905 −25.78 3.941 0.0309 220 0.300 19.41 543.2 447.65 12.12 46.83 7.44 97.33 0.655 5.036 −24.80 3.815 0.0286 240 0.288 18.55 534.6 452.94 12.16 47.36 7.25 98.69 0.732 5.899 −25.41 3.960 0.0298 260 0.279 18.16 537.2 449.73 12.12 46.77 7.42 101.83 0.817 6.140 −25.81 3.824 0.0300 280 0.248 17.09 534.3 451.92 11.96 46.44 7.24 93.98 0.860 6.779 −27.81 3.888 0.0284 300 0.276 16.54 531.5 453.23 12.05 46.11 6.82 100.82 1.023 7.145 −27.27 4.099 0.0323 320 0.218 15.53 538.8 453.64 11.96 45.61 6.62 100.99 1.249 7.571 −28.66 4.175 0.0333 340 0.368 14.45 540.2 446.22 12.12 44.36 6.42 95.29 1.367 8.152 −29.02 4.192 0.0325 360 0.215 13.36 540.2 448.78 11.88 44.39 6.2 96.56 1.657 8.880 −30.16 4.338 0.0340 380 0.254 12.03 533.6 441.29 11.74 43.31 5.93 93.73 1.981 9.809 −31.44 4.431 0.0346 400 0.282 11.03 535.4 445.44 11.8 43.45 5.99 91.60 2.217 9.353 −31.32 4.400 0.0334 420 0.238 9.69 545.9 449.54 11.72 43.1 5.41 89.43 2.600 11.214 −32.33 4.833 0.0362 440 0.253 8.06 548.1 444.96 11.8 42.15 5.06 90.38 3.317 11.688 −31.80 5.047 0.0390 460 0.235 5.67 539.8 446.84 11.87 41.69 4.92 87.55 4.437 12.656 −33.81 5.134 0.0389 480 0.261 2.90 541.1 443.6 11.76 40.55 3.95 86.94 6.049 12.674 −35.07 6.221 0.0481 500 0.284 1.13 538.3 440.84 11.69 40.24 3.24 86.91 8.980 13.449 −25.59 7.542 0.0587 520 0.277 1.28 530.7 436.26 12.05 39.84 3.64 83.04 9.311 11.883 −23.87 6.647 0.0499
下载: 导出CSV
-
[1] Dickens G R. Rethinking the global carbon cycle with a large, dynamic and microbially mediated gas hydrate capacitor [J]. Earth and Planetary Science Letters, 2003, 213(3-4): 169-183. doi: 10.1016/S0012-821X(03)00325-X
[2] Luff R, Wallmann K. Fluid flow, methane fluxes, carbonate precipitation and biogeochemical turnover in gas hydrate-bearing sediments at Hydrate Ridge, Cascadia Margin: Numerical modeling and mass balances [J]. Geochimica et Cosmochimica Acta, 2003, 67(18): 3403-3421. doi: 10.1016/S0016-7037(03)00127-3
[3] Egger M, Riedinger N, Mogollón J M, et al. Global diffusive fluxes of methane in marine sediments [J]. Nature Geoscience, 2018, 11(6): 421-425. doi: 10.1038/s41561-018-0122-8
[4] Joye S B, Boetius A, Orcutt B N, et al. The anaerobic oxidation of methane and sulfate reduction in sediments from Gulf of Mexico cold seeps [J]. Chemical Geology, 2004, 205(3-4): 219-238. doi: 10.1016/j.chemgeo.2003.12.019
[5] Reeburgh W S. Oceanic methane biogeochemistry [J]. Chemical Reviews, 2007, 107(2): 486-513. doi: 10.1021/cr050362v
[6] Boetius A, Ravenschlag K, Schubert C J, et al. A marine microbial consortium apparently mediating anaerobic oxidation of methane [J]. Nature, 2000, 407(6804): 623-626. doi: 10.1038/35036572
[7] Beal E J, House C H, Orphan V J. Manganese- and iron-dependent marine methane oxidation [J]. Science, 2009, 325(5937): 184-187. doi: 10.1126/science.1169984
[8] Ettwig K F, Butler M K, Le Paslier D, et al. Nitrite-driven anaerobic methane oxidation by oxygenic bacteria [J]. Nature, 2010, 464(7288): 543-548. doi: 10.1038/nature08883
[9] Borowski W S, Paull C K, Ussler W. Global and local variations of interstitial sulfate gradients in deep-water, continental margin sediments: Sensitivity to underlying methane and gas hydrates [J]. Marine Geology, 1999, 159(1-4): 131-154. doi: 10.1016/S0025-3227(99)00004-3
[10] Torres M E, Wallmann K, Tréhu A M, et al. Gas hydrate growth, methane transport, and chloride enrichment at the southern summit of Hydrate Ridge, Cascadia margin off Oregon [J]. Earth and Planetary Science Letters, 2004, 226(1-2): 225-241. doi: 10.1016/j.jpgl.2004.07.029
[11] Gay A, Lopez M, Ondreas H, et al. Seafloor facies related to upward methane flux within a Giant Pockmark of the Lower Congo Basin [J]. Marine Geology, 2006, 226(1-2): 81-95. doi: 10.1016/j.margeo.2005.09.011
[12] Kastner M, Claypool G, Robertson G. Geochemical constraints on the origin of the pore fluids and gas hydrate distribution at Atwater Valley and Keathley Canyon, northern Gulf of Mexico [J]. Marine and Petroleum Geology, 2008, 25(9): 860-872. doi: 10.1016/j.marpetgeo.2008.01.022
[13] Luo M, Chen L Y, Wang S H, et al. Pockmark activity inferred from pore water geochemistry in shallow sediments of the pockmark field in southwestern Xisha Uplift, northwestern South China Sea [J]. Marine and Petroleum Geology, 2013, 48: 247-259. doi: 10.1016/j.marpetgeo.2013.08.018
[14] Hu Y, Feng D, Liang Q Y, et al. Impact of anaerobic oxidation of methane on the geochemical cycle of redox-sensitive elements at cold-seep sites of the northern South China Sea [J]. Deep Sea Research Part II: Topical Studies in Oceanography, 2015, 122: 84-94. doi: 10.1016/j.dsr2.2015.06.012
[15] Habicht K S, Canfield D E. Isotope fractionation by sulfate-reducing natural populations and the isotopic composition of sulfide in marine sediments [J]. Geology, 2001, 29(6): 555-558. doi: 10.1130/0091-7613(2001)029<0555:IFBSRN>2.0.CO;2
[16] Peketi A, Mazumdar A, Joshi R K, et al. Tracing the Paleo sulfate-methane transition zones and H2S seepage events in marine sediments: An application of C-S-Mo systematics [J]. Geochemistry, Geophysics, Geosystems, 2012, 13(10): Q10007.
[17] Sato H, Hayashi K I, Ogawa Y, et al. Geochemistry of deep sea sediments at cold seep sites in the Nankai Trough: Insights into the effect of anaerobic oxidation of methane [J]. Marine Geology, 2012, 323-325: 47-55. doi: 10.1016/j.margeo.2012.07.013
[18] Schrag D P, Higgins J A, Macdonald F A, et al. Authigenic carbonate and the history of the global carbon cycle [J]. Science, 2013, 339(6119): 540-543. doi: 10.1126/science.1229578
[19] Hu Y, Feng D, Peckmann J, et al. The impact of diffusive transport of methane on pore-water and sediment geochemistry constrained by authigenic enrichments of carbon, sulfur, and trace elements: A case study from the Shenhu area of the South China Sea [J]. Chemical Geology, 2020, 553: 119805. doi: 10.1016/j.chemgeo.2020.119805
[20] Ye H, Yang T, Zhu G R, et al. Pore water geochemistry in shallow sediments from the northeastern continental slope of the South China sea [J]. Marine and Petroleum Geology, 2016, 75: 68-82. doi: 10.1016/j.marpetgeo.2016.03.010
[21] Feng J X, Yang S X, Liang J Q, et al. Methane seepage inferred from the porewater geochemistry of shallow sediments in the Beikang Basin of the southern South China Sea [J]. Journal of Asian Earth Sciences, 2018, 168: 77-86. doi: 10.1016/j.jseaes.2018.02.005
[22] Xu C L, Wu N Y, Sun Z L, et al. Methane seepage inferred from pore water geochemistry in shallow sediments in the western slope of the Mid-Okinawa Trough [J]. Marine and Petroleum Geology, 2018, 98: 306-315. doi: 10.1016/j.marpetgeo.2018.08.021
[23] Masuzawa T, Handa N, Kitagawa H, et al. Sulfate reduction using methane in sediments beneath a bathyal “cold seep” giant clam community off Hatsushima island, Sagami bay, Japan [J]. Earth and Planetary Science Letters, 1992, 110(1-4): 39-50. doi: 10.1016/0012-821X(92)90037-V
[24] Chen Y, Ussler III W, Haflidason H, et al. Sources of methane inferred from pore-water δ13C of dissolved inorganic carbon in Pockmark G11, offshore Mid-Norway [J]. Chemical Geology, 2010, 275(3-4): 127-138. doi: 10.1016/j.chemgeo.2010.04.013
[25] Snyder G T, Hiruta A, Matsumoto R, et al. Pore water profiles and authigenic mineralization in shallow marine sediments above the methane-charged system on Umitaka Spur, Japan Sea [J]. Deep Sea Research Part II: Topical Studies in Oceanography, 2007, 54(11-13): 1216-1239. doi: 10.1016/j.dsr2.2007.04.001
[26] Kim J H, Park M H, Chun J H, et al. Molecular and isotopic signatures in sediments and gas hydrate of the central/southwestern Ulleung Basin: high alkalinity escape fuelled by biogenically sourced methane [J]. Geo-Marine Letters, 2011, 31(1): 37-49. doi: 10.1007/s00367-010-0214-y
[27] Hong W L, Torres M E, Kim J H, et al. Carbon cycling within the sulfate-methane-transition-zone in marine sediments from the Ulleung Basin [J]. Biogeochemistry, 2013, 115(1-3): 129-148. doi: 10.1007/s10533-012-9824-y
[28] Chatterjee S, Dickens G R, Bhatnagar G, et al. Pore water sulfate, alkalinity, and carbon isotope profiles in shallow sediment above marine gas hydrate systems: A numerical modeling perspective [J]. Journal of Geophysical Research: Solid Earth, 2011, 116(B9): B09103.
[29] Komada T, Burdige D J, Magen C, et al. Recycling of organic matter in the sediments of Santa Monica basin, California borderland [J]. Aquatic Geochemistry, 2016, 22(5-6): 593-618. doi: 10.1007/s10498-016-9308-0
[30] 梁华催, 梁前勇, 胡钰, 等. 南海东沙海域浅表层柱状沉积物孔隙水地球化学特征及对冷泉流体活动的指示[J]. 地球化学, 2017, 46(4):333-344 doi: 10.3969/j.issn.0379-1726.2017.04.004 LIANG Huacui, LIANG Qianyong, HU Yu, et al. Pore water geochemistry of shallow surface sediments in the Dongsha area of the South China Sea and its implications for the activities of cold seep fluids [J]. Geochimica, 2017, 46(4): 333-344. doi: 10.3969/j.issn.0379-1726.2017.04.004
[31] Hu Y, Luo M, Chen L Y, et al. Methane source linked to gas hydrate system at hydrate drilling areas of the South China Sea: Porewater geochemistry and numerical model constraints [J]. Journal of Asian Earth Sciences, 2018, 168: 87-95. doi: 10.1016/j.jseaes.2018.04.028
[32] Wu D D, Wu N Y, Zhang M, et al. Relationship of Sulfate-Methane Interface (SMI), methane flux and the underlying gas hydrate in Dongsha Area, Northern South China Sea [J]. Earth Science, 2013, 38(6): 1309-1320.
[33] Liu H L, Yao Y J, Deng H. Geological and geophysical conditions for potential natural gas hydrate resources in southern South China Sea waters [J]. Journal of Earth Science, 2011, 22(6): 718-725. doi: 10.1007/s12583-011-0222-5
[34] 魏伟, 张金华, 魏兴华, 等. 我国南海天然气水合物资源潜力分析[J]. 地球物理学进展, 2012, 27(6):2646-2655 doi: 10.6038/j.issn.1004-2903.2012.06.044 WEI Wei, ZHANG Jinhua, WEI Xinghua, et al. Resource potential analysis of natural gas hydrate in South China Sea [J]. Progress in Geophysics, 2012, 27(6): 2646-2655. doi: 10.6038/j.issn.1004-2903.2012.06.044
[35] 张厚和, 刘鹏, 廖宗宝, 等. 南沙海域北康盆地油气勘探潜力[J]. 中国石油勘探, 2017, 22(3):40-48 doi: 10.3969/j.issn.1672-7703.2017.03.005 ZHANG Houhe, LIU Peng, LIAO Zongbao, et al. Oil and gas exploration potential in Beikang Basin, Nansha sea area [J]. China Petroleum Exploration, 2017, 22(3): 40-48. doi: 10.3969/j.issn.1672-7703.2017.03.005
[36] Trung N N. The gas hydrate potential in the South China Sea [J]. Journal of Petroleum Science and Engineering, 2012, 88-89: 41-47. doi: 10.1016/j.petrol.2012.01.007
[37] 苏新, 陈芳, 于兴河, 等. 南海陆坡中新世以来沉积物特性与气体水合物分布初探[J]. 现代地质, 2005, 19(1):1-13 doi: 10.3969/j.issn.1000-8527.2005.01.001 SU Xin, CHEN Fang, YU Xinghe, et al. A pilot study on miocene through holocene sediments from the continental slope of the south china sea in correlation with possible distribution of gas hydrates [J]. Geoscience, 2005, 19(1): 1-13. doi: 10.3969/j.issn.1000-8527.2005.01.001
[38] Chen Z, Yan W, Tang X Z, et al. Magnetic susceptibility in surface sediments in the southern South China Sea and its implication for sub-sea methane venting [J]. Journal of Earth Science, 2009, 20(1): 193-204. doi: 10.1007/s12583-009-0019-y
[39] 张莉, 王嘹亮, 易海. 北康盆地的形成与演化[J]. 中国海上油气(地质), 2003, 17(4):245-248 ZHANG Li, WANG Liaoliang, YI Hai. The formation and evolution of Beikang Basin [J]. China Offshore Oil and Gas (Geology), 2003, 17(4): 245-248.
[40] 王嘹亮, 梁金强, 曾繁彩. 北康盆地新生代沉积特征[J]. 南海地质研究, 2000:58-72 WANG Liaoliang, LIANG Jinqiang, ZENG Fancai. Cenozoic sedimentation of Beikang Basin [J]. Gresearch of Eological South China Sea, 2000: 58-72.
[41] 刘振湖. 北康盆地古地热场与油气远景[J]. 海洋地质与第四纪地质, 2004, 24(2):79-84 LIU Zhenhu. Paleogeothermal field and petroleum prospect of the Beikang Basin, South China Sea [J]. Marine Geology & Quaternary Geology, 2004, 24(2): 79-84.
[42] 杨振, 张光学, 张莉, 等. 南海南部北康盆地生物礁的类型及油气勘探前景[J]. 中国地质, 2017, 44(3):428-438 YANG Zhen, ZHANG Guangxue, ZHANG Li, et al. The style and hydrocarbon prospects of reefs in the Beikang Basin, southern South China Sea [J]. Geology in China, 2017, 44(3): 428-438.
[43] 骆帅兵, 张莉, 周江羽, 等. 南海南部北康盆地烃源岩特征及发育模式探讨[J/OL]. 中国地质, 2020: 1-21. (2020-04-20). https://kns.cnki.net/KCMS/detail/detail.aspx?dbcode=CJFQ&dbname=CAPJLAST&filename=DIZI20200417002&v=MDgzMjlOSE1xNDVDWk9zTll3OU16bVJuNmo1N1QzZmxxV00wQ0xMN1I3cWRadVpzRkMvbFY3M0tKVmc9SVNUUlo3RzRI. LUO Shuaibing, ZHANG Li, ZHOU Jiangyu, et al. Study on the characteristics and development patterns of source rocks in Beikang basin, South China Sea[J/OL]. Geology in China, 2020: 1-21. (2020-04-20). https://kns.cnki.net/KCMS/detail/detail.aspx?dbcode=CJFQ&dbname=CAPJLAST&filename=DIZI20200417002&v=MDgzMjlOSE1xNDVDWk9zTll3OU16bVJuNmo1N1QzZmxxV00wQ0xMN1I3cWRadVpzRkMvbFY3M0tKVmc9SVNUUlo3RzRI.
[44] 卢振权, 强祖基, 吴必豪. 利用卫星热红外遥感探测南海天然气水合物[J]. 地质学报, 2002, 76(1):101-106 LU Zhenquan, QIANG Zuji, WU Bihao. Exploring gas hydrates by satellite-based thermal infrared remote sensing in the South China Sea [J]. Acta Geologica Sinica, 2002, 76(1): 101-106.
[45] 王淑红, 宋海斌, 颜文, 等. 南海南部天然气水合物稳定带厚度及资源量估算[J]. 天然气工业, 2005, 25(8):24-27, 4 doi: 10.3321/j.issn:1000-0976.2005.08.008 WANG Shuhong, SONG Haibin, YAN Wen, et al. Stable zone thickness and resource estimation of gas hydrate in southern South China Sea [J]. Natural Gas Industry, 2005, 25(8): 24-27, 4. doi: 10.3321/j.issn:1000-0976.2005.08.008
[46] 赵中贤, 孙珍, 陈广浩, 等. 南沙海域新生代构造特征和沉降演化[J]. 地球科学—中国地质大学学报, 2011, 36(5):815-822 ZHAO Zhongxian, SUN Zhen, CHEN Guanghao, et al. Cenozoic structural characteristics and subsidence evolution in NanSha [J]. Earth Science—Journal of China University of Geosciene, 2011, 36(5): 815-822.
[47] Wang P, Prell W L, Blum P. Initial Reports, 184[C]//Proc. Ocean Drill. Prog. 2000.
[48] Schulz H D. Quantification of early diagenesis: dissolved constituents in pore water and signals in the solid phase[M]//Schulz H D, Zabel M. (Marine Geochemistry. Berlin, Germany: Springer, 2006: 73-124.
[49] Torres M E, Brumsack H J, Bohrmann G, et al. Barite fronts in continental margin sediments: A new look at barium remobilization in the zone of sulfate reduction and formation of heavy barites in diagenetic fronts [J]. Chemical Geology, 1996, 127(1-3): 125-139. doi: 10.1016/0009-2541(95)00090-9
[50] 陈法锦, 陈建芳, 金海燕等. 南海表层沉积物与沉降颗粒物中有机碳的δ13C对比研究及其古环境再造意义[J]. 沉积学报, 2012, 30(2):340-345 CHEN Fajin, CHEN Jianfang, JIN Haiyan, et al. Correlation of delta~(13) Corg in Surface Sediments with Sinking Particulate Matter in South China Sea and Implication for Reconstructing Paleo-environment [J]. Acta Sedimentologica Sinica, 2012, 30(2): 340-345.
[51] Whiticar M J. Carbon and hydrogen isotope systematics of bacterial formation and oxidation of methane [J]. Chemical Geology, 1999, 161(1-3): 291-314. doi: 10.1016/S0009-2541(99)00092-3
[52] Claypool G E, Kvenvolden K A. Methane and other hydrocarbon gases in marine sediment [J]. Annual Review of Earth and Planetary Sciences, 1983, 11: 299-327. doi: 10.1146/annurev.ea.11.050183.001503
[53] Borowski W S, Paull C K, Ussler III W. Marine pore-water sulfate profiles indicate in situ methane flux from underlying gas hydrate [J]. Geology, 1996, 24(7): 655-658. doi: 10.1130/0091-7613(1996)024<0655:MPWSPI>2.3.CO;2
[54] Dickens G R. Sulfate profiles and barium fronts in sediment on the Blake Ridge: Present and past methane fluxes through a large gas hydrate reservoir [J]. Geochimica et Cosmochimica Acta, 2001, 65(4): 529-543. doi: 10.1016/S0016-7037(00)00556-1
[55] Ussler III W, Paull C K. Rates of anaerobic oxidation of methane and authigenic carbonate mineralization in methane-rich deep-sea sediments inferred from models and geochemical profiles [J]. Earth and Planetary Science Letters, 2008, 266(3-4): 271-287. doi: 10.1016/j.jpgl.2007.10.056
[56] Berner U, Faber E. Hydrocarhon gases in surface sediments of the South China Sea[M]//Jin X L. Marine Geology and Geophysics of the South China Sea. Beijing: China Ocean Press, 1990: 199-21l.
[57] Hensen C, Zabel M, Pfeifer K, et al. Control of sulfate pore-water profiles by sedimentary events and the significance of anaerobic oxidation of methane for the burial of sulfur in marine sediments [J]. Geochimica et Cosmochimica Acta, 2003, 67(14): 2631-2647. doi: 10.1016/S0016-7037(03)00199-6
[58] Borowski W S. A review of methane and gas hydrates in the dynamic, stratified system of the Blake Ridge region, offshore southeastern North America [J]. Chemical Geology, 2004, 205(3-4): 311-346. doi: 10.1016/j.chemgeo.2003.12.022
[59] Coffin R, Hamdan L, Plummer R, et al. Analysis of methane and sulfate flux in methane-charged sediments from the Mississippi Canyon, Gulf of Mexico [J]. Marine and Petroleum Geology, 2008, 25(9): 977-987. doi: 10.1016/j.marpetgeo.2008.01.014
[60] Sun X L, Turchyn A V. Significant contribution of authigenic carbonate to marine carbon burial [J]. Nature Geoscience, 2014, 7(3): 201-204. doi: 10.1038/ngeo2070
[61] Bayon G, Pierre C, Etoubleau J, et al. Sr/Ca and Mg/Ca ratios in Niger Delta sediments: Implications for authigenic carbonate genesis in cold seep environments [J]. Marine Geology, 2007, 241(1-4): 93-109. doi: 10.1016/j.margeo.2007.03.007
[62] Nöthen K, Kasten S. Reconstructing changes in seep activity by means of pore water and solid phase Sr/Ca and Mg/Ca ratios in pockmark sediments of the Northern Congo Fan [J]. Marine Geology, 2011, 287(1-4): 1-13. doi: 10.1016/j.margeo.2011.06.008
[63] Xu C L, Wu N Y, Sun Z L, et al. Assessing methane cycling in the seep sediments of the mid-Okinawa Trough: Insights from pore-water geochemistry and numerical modeling [J]. Ore Geology Reviews, 2021, 129: 103909. doi: 10.1016/j.oregeorev.2020.103909
[64] Gonneea M E, Paytan A. Phase associations of barium in marine sediments [J]. Marine Chemistry, 2006, 100(1-2): 124-135. doi: 10.1016/j.marchem.2005.12.003
-
期刊类型引用(1)
1. 董刚,蔡峰,孙治雷,闫桂京,梁杰,李清,孙运宝,李昂,骆迪,翟滨,郭建卫,窦振亚. 海洋浅表层天然气水合物地质取样技术及样品现场处置方法. 海洋地质前沿. 2022(07): 1-9 .  百度学术
百度学术
其他类型引用(0)


计量
- 文章访问数: 2483
- HTML全文浏览量: 642
- PDF下载量: 94
- 被引次数: 1