Provenance evolution since Middle Holocene of the sediments on the East Siberian shelf: Evidence from elemental geochemistry
-
摘要: 北极地区对全球气候变化非常敏感,是研究古环境和古气候变化的关键区域。东西伯利亚海作为北极重要的边缘海之一,对东西伯利亚陆架和陆坡沉积物来源的研究将有助于加深对北极沉积环境和气候变化的认识。本文通过对东西伯利亚海西部LV77-36岩心沉积物中碎屑组分的主微量、稀土元素进行分析,阐述了各指标随年代的变化特征,并探讨了中全新世以来东西伯利亚海西部碎屑沉积来源的变化及其对古环境演变的响应。结果表明中全新世以来LV77-36岩心沉积物主要来源于勒拿河、因迪吉尔卡河、亚纳河和马更些河的河流输入,以及西伯利亚地台和新西伯利亚群岛的海岸侵蚀物质。与其他古气候参数对比发现,海冰和洋流的变化对源区物质在东西伯利亚陆架的分散和沉积有着重要的影响。全新世晚期由于楚科奇海海冰的增加、西伯利亚沿岸流的减弱和波弗特环流的增强,导致北美端元的物质贡献相较全新世中期有小幅度增加。Abstract: The Arctic region is very sensitive to global climate change. It is a key area in the world to the study of paleoenvironmental and paleoclimatic changes. The East Siberian Sea (ESS) is one of the important marginal seas in the Arctic region. Study of the sediment provenance of the ESS shelf is essential to the overall understanding of the Arctic environmental and climatic changes. Based on the analyzing results of the major, trace and rare earth elements from the core of LV77-36, this paper described the change patterns of concerned indices with time, discussed the variation of detrital components in the ESS sediments since Middle Holocene, and finally, revealed the response of provenance evolution to paleoenvironment changes. The results show that since Middle Holocene, the sediments of the core LV77-36 are mainly coming from the suspended materials carried by the Lena, Indigirka, Yana and Mackenzie rivers, in addition to the coastal erosive materials from the Siberian platform and New Siberian Islands. According to the Comparison with other paleoclimatic parameters, it is found that the changes of sea ice and ocean currents have important effects on the dispersion and deposition of sediments on the East Siberia shelf. In Late Holocene, due to the increase in sea ice in the Chukchi Sea, the weakening of the Siberian coastal current and the strengthening of the Beaufort circulation, the material contributed by the North American end member increased slightly compared to the Middle Holocene sediments.
-
北冰洋由于其独特的地理位置和海冰变化,对气候变化有着一系列的反馈机制,同时也是气候变化的主要驱动力[1-2]。北极地区最明显的气候变化表现在海冰覆盖面积逐渐减小[3],其中东西伯利亚海是北极海冰活动最剧烈的区域[4-5]。作为连接西伯利亚大陆和北冰洋的重要边缘海之一,东西伯利亚海的海冰后退使永久性冻土融化,甲烷排放量增加[6-8],从而对全球大气组成和环境变化产生更严重的影响。文献调查显示,东西伯利亚海已开展沉积物矿物组成[9]、永久冻土作用机制[6]、有机碳来源[8, 10-13]和环境特征[4, 14-18]等方面的研究工作。研究指出,河流携带的陆源物质是北极陆架区沉积物的重要来源[19],但在东西伯利亚海和拉普捷夫海陆架区,海岸侵蚀对沉积物的贡献也不容忽视[7, 20]。Rachold等在对拉普捷夫海和波弗特海的研究中发现,拉普捷夫海的海岸侵蚀物质输入是河流沉积物的两倍多[21]。Astakhov等根据东西伯利亚海表层沉积物中稀土元素的分布特征,解释了该地区稀土元素的物质来源和迁移路径,认为东西伯利亚海地区稀土元素主要来自勒拿河的输入和周边地区的海岸侵蚀[22-23]。通过分析GC58岩心沉积物的δ13C数据,Keskitalo发现全新世时期东西伯利亚海沉积物中的陆源碳大多来自海岸侵蚀[12]。Nikolaeva等也提出东西伯利亚海的沉积过程受到古火山侵蚀岩的影响[9]。尽管前人在西伯利亚海沉积物矿物组成、有机碳来源等方面取得了一些进展,但由于东西伯利亚海海冰和永久冻土的存在,沉积物的采样难度大,使得对该海域沉积物来源的研究程度一直较低。
沉积物是母岩风化剥蚀的产物,在搬运和沉积过程中受到各种环境条件的影响,而沉积物中可以代表源岩特征的稳定元素,如主量元素Ti,微量元素中的高场强元素(包含稀土元素),受到风化和水动力分选等的影响较小,可以作为示踪物源的有效指标[24-25]。本文在前人研究的基础上,选取位于东西伯利亚陆架的LV77-36岩心,通过对其沉积物碎屑组分的主微量元素以及稀土元素进行分析,探讨中全新世以来东西伯利亚陆架沉积物碎屑组分来源的变化及其对古环境演化的响应。
1. 区域概况
1.1 地质背景
东西伯利亚海南靠西伯利亚,北向有马卡洛夫海盆和门捷列夫海脊,东面以弗兰格尔岛与楚科奇海相隔,西面有新西伯利亚群岛,并通过德米特里–拉普捷夫海峡与拉普捷夫海相连。东西伯利亚海的入海河流主要是因迪吉尔卡河、阿拉泽亚河和科雷马河,年总径流量和悬浮物质的输入量分别是201.8 km3/a和29.7×106 t/a[26]。其中科雷马河是三者中的第一大河流,其流域面积约647×103 km2,径流量达122 km3/a,输沙量为10.1×106 t/a[27-28]。因迪吉尔卡河的流域面积大约是360×103 km2,径流量为54.2 km3/a,远低于科雷马河,但输沙量最高,为11.1×106 t/a[27-28]。作为流入西伯利亚陆架最大的入海径流,勒拿河的径流量为532 km3/a,输沙量为20.7×106 t/a[29];亚纳河的径流量为31.9 km3/a,输沙量为4.0×106 t/a[26]。虽然勒拿河和亚纳河向北汇入拉普捷夫海,但在西伯利亚沿岸流的作用下也可以为东西伯利亚海提供沉积物。
由西向东,西伯利亚的地质体主要有:① 西伯利亚地台,分布在俄罗斯的中部,岩石类型主要是沉积岩和溢流玄武岩[30];② 维尔霍杨斯克山脉,由西向东分别是陆架碎屑沉积和深海页岩沉积[31];③ 科雷马–奥莫隆地块,主要是岛弧物质和大陆碎片的混合沉积;④ 鄂霍茨克–楚科奇火山带,在西伯利亚东北部的横向上呈带状分布,西部以酸性–中酸性火山岩为主,东部以中性–基性火山岩为主[32-33];⑤ 楚科奇地块,位于火山带的北部,主要为沉积岩,新西伯利亚群岛和弗兰格尔岛岩性与其相同[34-35]。
1.2 海冰和洋流
整体上北极海冰覆盖范围受到纬度高低、洋流方向和海陆位置等多种因素的共同影响,卫星数据显示近几十年来北极海冰面积明显减少[1, 36]。北冰洋地区的海冰分为多年海冰和季节性海冰,多年海冰仅占北冰洋海冰的14%,季节性海冰占北冰洋海冰的86%,主要位于边缘海的浅水陆架区[37-38]。季节性海冰变化的具体表现为:每年10月至来年7月是海冰形成期,3月份海冰面积最大,在此期间会冻结悬浮颗粒;每年8—9月,随着气温升高,海冰破裂融化,在9月份达到夏季海冰覆盖范围的最小值,在此阶段,海冰可以随洋流一起将冻结物质搬运到其他区域[39-40]。
北冰洋东、西部海域的水动力条件复杂,主要由北极入海径流输入的淡水、北极陆架水、西伯利亚沿岸流、穿极流、太平洋入流水和波弗特环流构成区域内的主要环流系统[33]。其中西伯利亚沿岸流源于拉普捷夫海,穿过水深20 m左右的德米特里–拉普捷夫海峡,经东西伯利亚海后到达楚科奇海[41]。太平洋水经白令海峡流入楚科奇海后,分为三支继续向北扩散,其中一支沿阿拉斯加海岸继续向东北方向流动,称为阿拉斯加沿岸流,中间为白令海陆架水,大致沿170°W经线向北流,最后向西北方向流动的是阿纳德尔流,到达弗兰格尔岛附近[41]。位于欧亚盆地的穿极流呈逆时针流动,可将西伯利亚陆架的海冰输送至弗拉姆海峡[42-43],而波弗特环流位于美亚盆地,呈顺时针流动,主要将波弗特海和加拿大北极的物质运往北冰洋中部[42-43]。研究指出,表面大气压力梯度变化,如北极涛动(AO),对波弗特环流和穿极流在北冰洋的运动模式造成很大的影响[42]。北极涛动正相时(+AO),穿极流向北美靠近,波弗特环流减弱[42];相反,在北极涛动负相时(–AO),波弗特海处于一个高压系统的控制下,导致波弗特环流增强,向东西伯利亚海一侧延伸,而穿极流则被限制在北极西伯利亚一侧[42-43]。
2. 材料与方法
2.1 研究材料
LV77-36岩心(74.10°N、155.66°E)位于东西伯利亚海西部陆架区(图1),由执行第一次中俄北极联合科学考察项目的“拉夫任捷耶夫院士号”科学考察船于2016年9月通过重力取样获得。该站位水深36 m,岩心总长为376 cm,颜色呈灰褐色。沉积物岩性比较均一,主要由黏土质粉砂组成。
![]() 图 1 东西伯利亚海陆架概况及LV77-36岩心位置环流模式根据文献[41, 44]绘制;地形根据文献[33]绘制。 a. 东西伯利亚海陆架概况(ACC:阿拉斯加沿岸流, BSSW:白令海陆架水, AC:阿纳德尔流, SCC:西伯利亚沿岸流, TPD:穿极流, BG:波弗特环流。红色圆点为LV77-36岩心位置;紫色圆点为鄂霍茨克–楚科奇火山带,蓝色圆点为维尔霍杨斯克褶皱带,绿色圆点为西西伯利亚地台取样位置,数据来源:GEOROC 数据库;白色区域为现代夏季北冰洋海冰覆盖范围,数据来源:www.meereisportal.de);b. LV77-36岩心位置(AO:北极涛动;黑色箭头:负北极涛动时期的TPD和BG, 白色箭头:正北极涛动时期的TPD和BG)。Figure 1. Schematic map of Arctic East Siberian Shelf and site of LV77-36Circumfluence modified from references[41, 44]; the different terraines modified from references[33]. a. Overview of the Arctic East Siberian Shelf(ACC: Alaskan Coastal Current, BSSW: Bering Sea Shelf Water, AC: Anadel Current,SCC: Siberian Coastal Current, TPD: Transpolar Drift, BG: Beaufort Gyre. The red dot represents site core LV77-36; purple dots represent sites in the Okhotsk-Chukochi volcanic belt, blue dots represent sites in the Verkhoyansk fold belt and green dots represent sites in the West Siberian platform, data source; GEOROC Database; The white area is the extent of Arctic sea ice in the modern summer, data source: www.meereisportal.de); b. The location of core LV77-36(Black arrow: TPD and BG during the negative Arctic Oscillation, White arrow: TPD and BG during the Positive Arctic Oscillation).
图 1 东西伯利亚海陆架概况及LV77-36岩心位置环流模式根据文献[41, 44]绘制;地形根据文献[33]绘制。 a. 东西伯利亚海陆架概况(ACC:阿拉斯加沿岸流, BSSW:白令海陆架水, AC:阿纳德尔流, SCC:西伯利亚沿岸流, TPD:穿极流, BG:波弗特环流。红色圆点为LV77-36岩心位置;紫色圆点为鄂霍茨克–楚科奇火山带,蓝色圆点为维尔霍杨斯克褶皱带,绿色圆点为西西伯利亚地台取样位置,数据来源:GEOROC 数据库;白色区域为现代夏季北冰洋海冰覆盖范围,数据来源:www.meereisportal.de);b. LV77-36岩心位置(AO:北极涛动;黑色箭头:负北极涛动时期的TPD和BG, 白色箭头:正北极涛动时期的TPD和BG)。Figure 1. Schematic map of Arctic East Siberian Shelf and site of LV77-36Circumfluence modified from references[41, 44]; the different terraines modified from references[33]. a. Overview of the Arctic East Siberian Shelf(ACC: Alaskan Coastal Current, BSSW: Bering Sea Shelf Water, AC: Anadel Current,SCC: Siberian Coastal Current, TPD: Transpolar Drift, BG: Beaufort Gyre. The red dot represents site core LV77-36; purple dots represent sites in the Okhotsk-Chukochi volcanic belt, blue dots represent sites in the Verkhoyansk fold belt and green dots represent sites in the West Siberian platform, data source; GEOROC Database; The white area is the extent of Arctic sea ice in the modern summer, data source: www.meereisportal.de); b. The location of core LV77-36(Black arrow: TPD and BG during the negative Arctic Oscillation, White arrow: TPD and BG during the Positive Arctic Oscillation).2.2 分析方法
2.2.1 年龄框架建立
AMS14C年龄引自Astakhov数据[23],实验在BETA公司的AMS放射性碳实验室完成。在LV77-36岩心的0~376 cm取7个层位贝壳样品,测得14C年龄为1.2~7.8 ka,日历校正年龄为0.7~8.2 cal.kaBP,通过内插法计算出沉积物的底部年龄为8.3 cal.kaBP。
2.2.2 主微量元素测定
LV77-36岩心沉积物以1 cm间隔取样,在0~100 cm和100~376 cm分别按大约9 cm和13 cm的间距选样,对30个沉积物样品进行元素分析测试。将沉积物样品冷冻干燥后研磨至200目粉末,称取约0.6 g样品倒入离心管,加入40 mL超纯水于室温下震荡离心去除可交换态;加入10%的乙酸并在室温下震荡16 h去除碳酸盐组分;在残余物中加入25 g 0.5 mol/L的盐酸羟胺与15%的乙酸混合溶液,去除自生铁锰氧化物组分[45-46];将残留的硅酸盐组分烘干研磨,称取约0.05 g放入聚四氟乙烯罐中,加入HNO3和HF进行高温高压溶样,并定容到50 g。用Thermal ICAP 6300型电感耦合等离子光谱仪(ICP-OES)测试主量元素(Al、Fe、Ca、Mg、K、Na、Mn、P和Ti)含量,用Thermal X series Ⅱ型电感耦合等离子质谱仪(ICP-MS)测试微量元素(Cu、Zn、Li、Sc、Co、Ni、REE等)含量。在分析测试时选取空白样、平行样,并采用标准物质GSD-9进行质量控制,相对误差小于0.5%。分析测试均在自然资源部海洋地质与成矿作用重点实验室完成。
3. 结果
3.1 碎屑组分的主微量元素特征
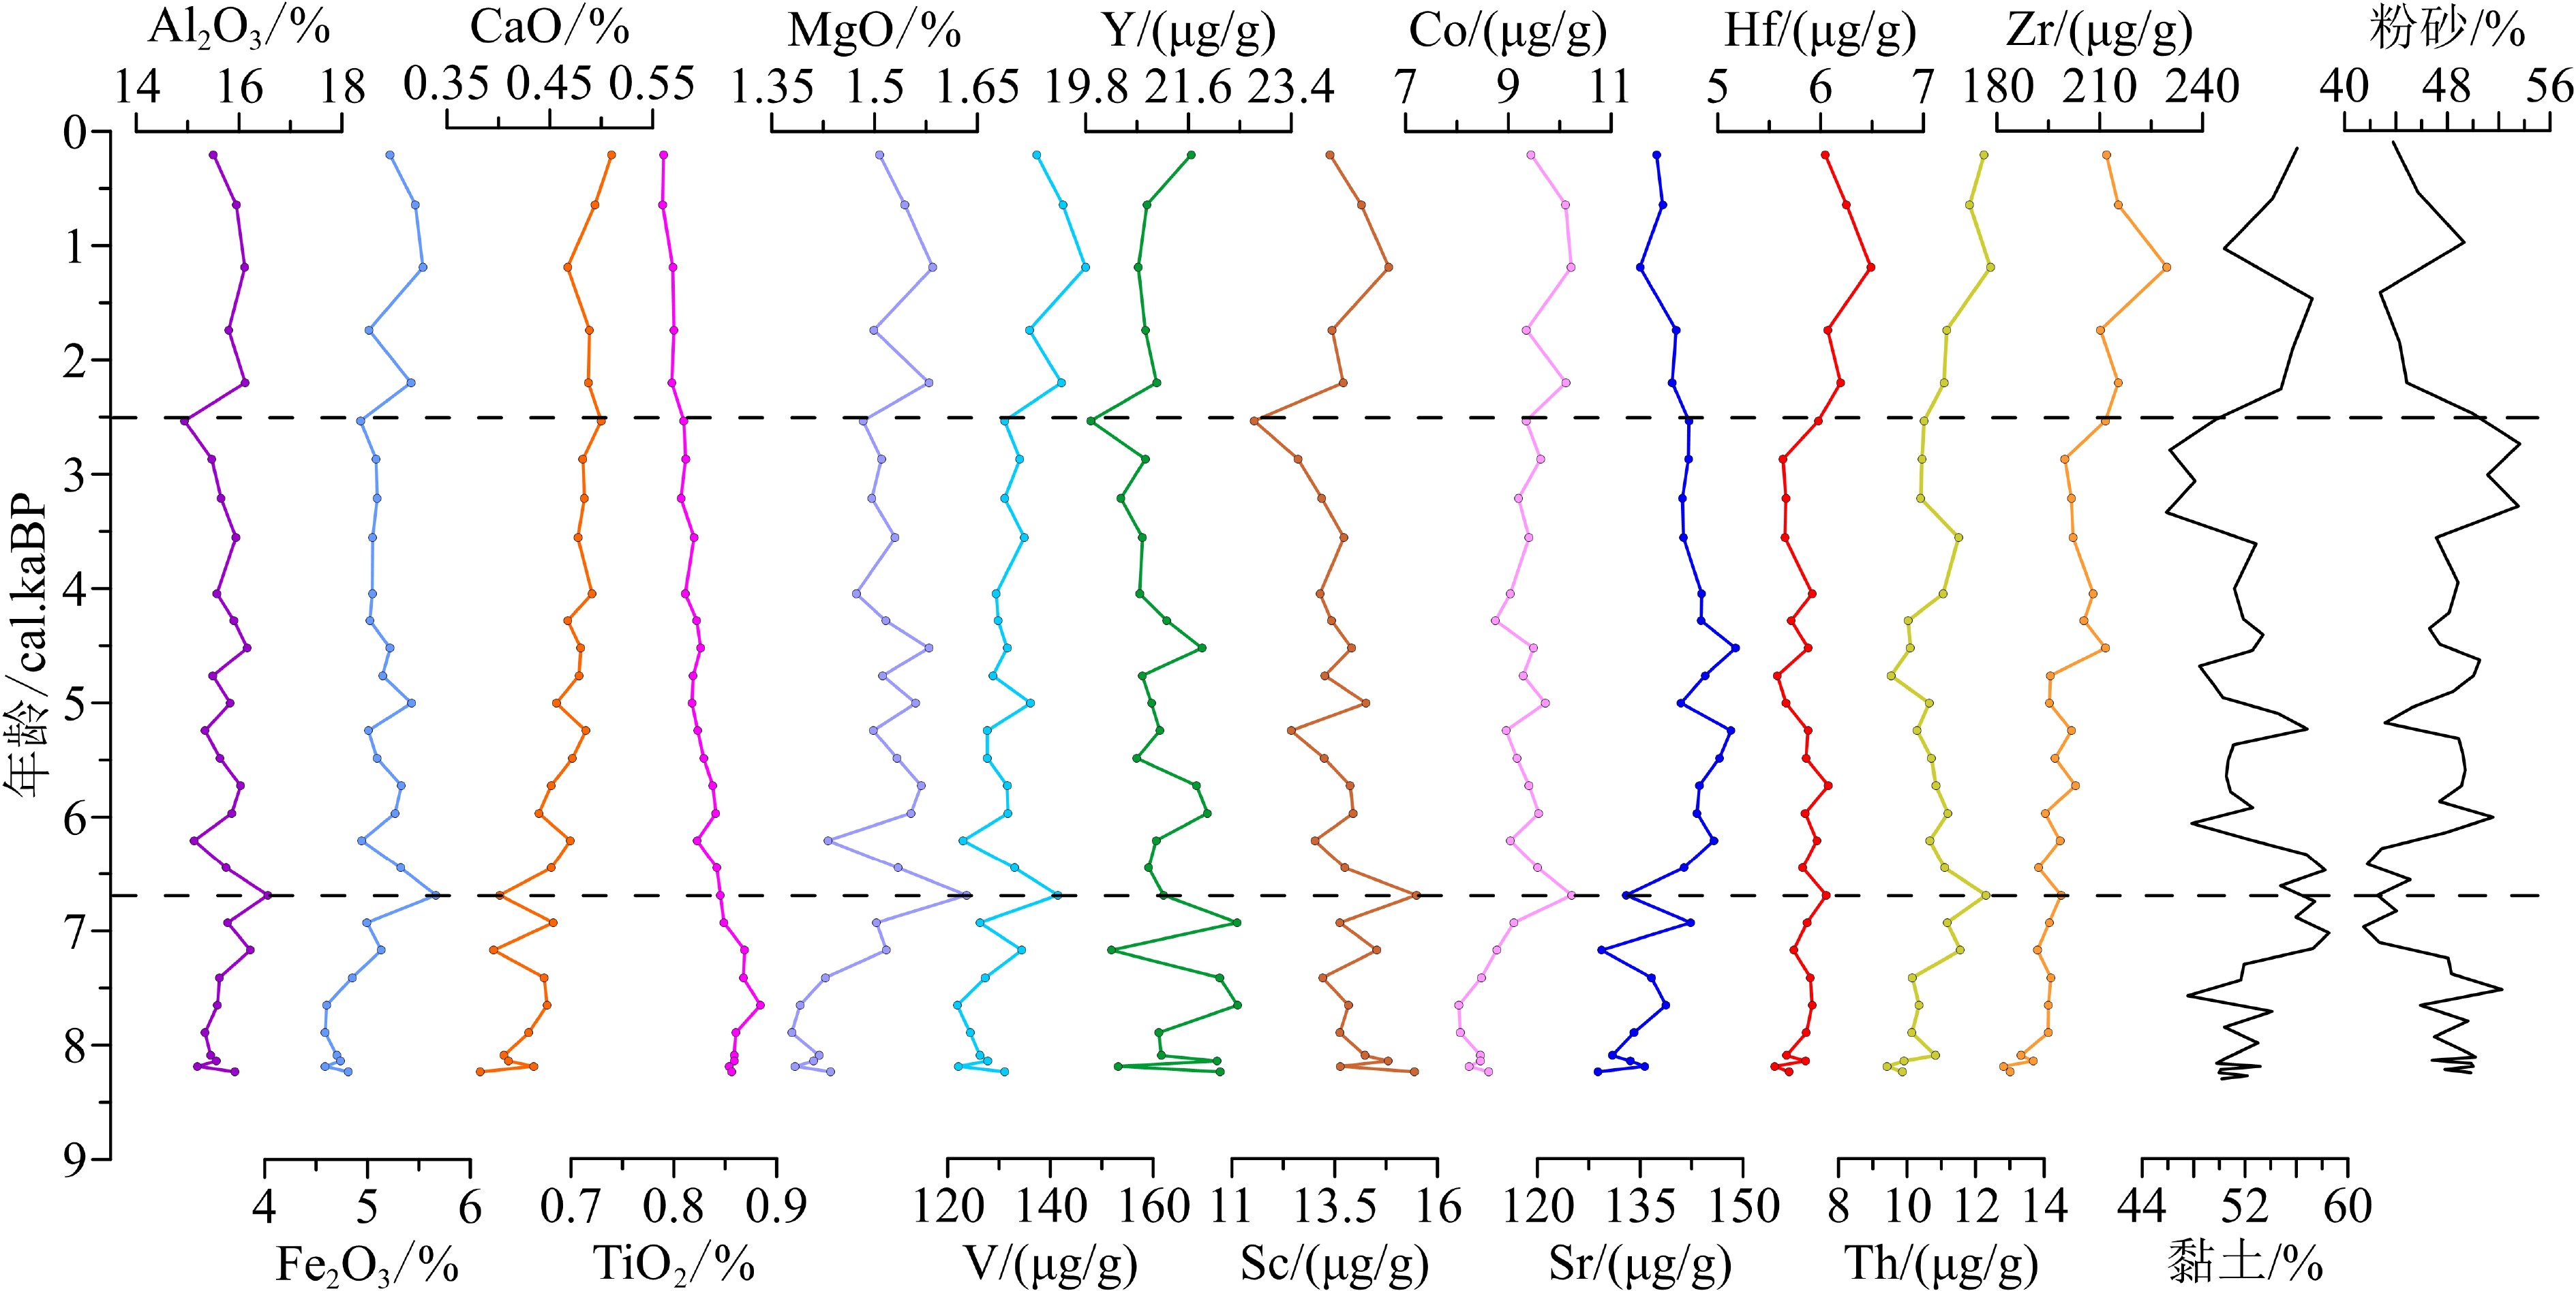
LV77-36岩心碎屑组分主微量元素含量统计见表1、表2。沉积物碎屑组分中Al2O3含量为14.94%~16.75%,其他主量元素含量为0.03%~5.67%。微量元素中Ba的平均含量最高,为640 μg/g;其次是Zr、Sr、V和Rb元素,平均含量分别为200、140、131和114 μg/g,其余微量元素含量普遍低于100 μg/g。从时间序列来看(图2),LV77-36岩心碎屑组分中Al2O3和Fe2O3与黏土含量的变化趋势相似,表明这些元素多存在于细颗粒沉积物中。8.3 cal.kaBP以来,主微量元素含量的变化较小,大致在6.7和2.5 cal.kaBP发生变化。除CaO、TiO2、Sr和Zr之外,其余元素的含量在8.3~6.7 cal.kaBP逐渐增加,6.7 cal.kaBP之后开始减少,直到2.5 cal.kaBP再次出现增加的趋势。
表 1 LV77-36岩心沉积物碎屑组分主量元素含量Table 1. Major element contents of detrital components in core LV77-36Al2O3 Fe2O3 CaO MgO K2O Na2O MnO P2O5 TiO2 最小值 14.94 4.59 0.38 1.38 2.93 2.14 0.03 0.05 0.79 最大值 16.73 5.67 0.51 1.63 3.18 2.50 0.03 0.08 0.90 平均值 15.75 5.07 0.46 1.50 3.03 2.34 0.03 0.06 0.83 标准差 0.39 0.28 0.03 0.06 0.07 0.08 0.00 0.01 0.03 注:主量元素含量单位为%。 表 2 LV77-36岩心沉积物碎屑组分微量元素含量Table 2. Trace element contents of detrital components in core LV77-36Sc Cr Co Ni Sr Ba Hf Pb Th Zr 最小值 11.54 73.35 8.04 23.64 128.82 617.16 5.55 7.18 9.42 181.90 最大值 15.48 90.35 10.24 32.15 148.91 680.29 6.49 8.15 12.43 229.60 平均值 13.73 80.61 9.17 26.88 139.93 640.42 5.87 7.64 10.80 200.43 标准差 0.82 3.77 0.60 2.11 5.39 13.21 0.21 0.25 0.77 10.22 注:微量元素含量单位为μg/g。 ![]()
3.2 碎屑组分的稀土元素特征
由表3可以看出,LV77-36岩心碎屑组分的稀土元素总量(ΣREE)为142~154 μg/g,平均值为147 μg/g,与东西伯利亚海表层沉积物的ΣREE(120~175 μg/g)相近[22]。轻稀土总量(ΣLREE)为127~139 μg/g,平均值为132 μg/g;重稀土总量(ΣHREE)为14~16 μg/g,平均值为15 μg/g。LREE/HREE比值为8.4~9.6。在随时间序列的变化上(图3),ΣREE、ΣLREE和ΣHREE在8.3~4.5 cal.kaBP变化较为频繁,且稀土元素总量呈现逐渐增加;4.5 cal.kaBP之后稀土元素总量开始减少,其余参数的变化较小。
表 3 LV77-36岩心碎屑组分稀土元素含量及主要参数Table 3. Contents and parameters of rare earth elements from detrital components of core LV77-36最小值 最大值 平均值 标准差 La 31.25 34.17 32.38 0.74 Ce 58.53 65.01 61.47 1.63 Pr 6.99 7.63 7.23 0.17 Nd 25.00 27.19 25.77 0.60 Sm 4.20 4.55 4.35 0.09 Eu 0.90 0.99 0.94 0.02 Gd 3.59 3.99 3.75 0.09 Tb 0.57 0.64 0.60 0.02 Dy 3.63 4.08 3.82 0.12 Ho 0.72 0.82 0.77 0.02 Er 2.22 2.52 2.37 0.08 Tm 0.36 0.42 0.39 0.01 Yb 2.33 2.74 2.55 0.10 Lu 0.36 0.44 0.39 0.02 ΣREE 141.56 154.43 146.77 3.23 ΣLREE 127.28 139.43 132.13 3.06 ΣHREE 13.86 15.56 14.64 0.43 LREE/HREE 8.38 9.57 9.03 0.28 (La/Sm) NASC 1.29 1.38 1.33 0.02 (La/Yb) NASC 1.10 1.35 1.23 0.05 δCe 0.86 0.90 0.87 0.01 δEu 0.99 1.05 1.02 0.01 注:稀土元素含量单位为μg/g;
δCe$= \dfrac{ { {\rm{Ce} } } }{ { {\rm{Ce*} } } } = \dfrac{ { {\rm{Ce_{NASC} } } }}{ {\sqrt { {\rm{La_{NASC} \times Pr_{NASC} } } } } }$,δEu$= \dfrac{ { {\rm{Eu} } } }{ { {\rm{Eu*} } } } = \dfrac{ { {\rm{Eu_{NASC} } } }}{ {\sqrt { {\rm{Sm_{NASC} \times Gd_{NASC} } } } } }$;
其中NASC为北美页岩标准化的结果。![]() 图 3 LV77-36岩心稀土元素含量及分异参数垂向变化Figure 3. Profiles of rare earth elements and parameters for core LV77-36
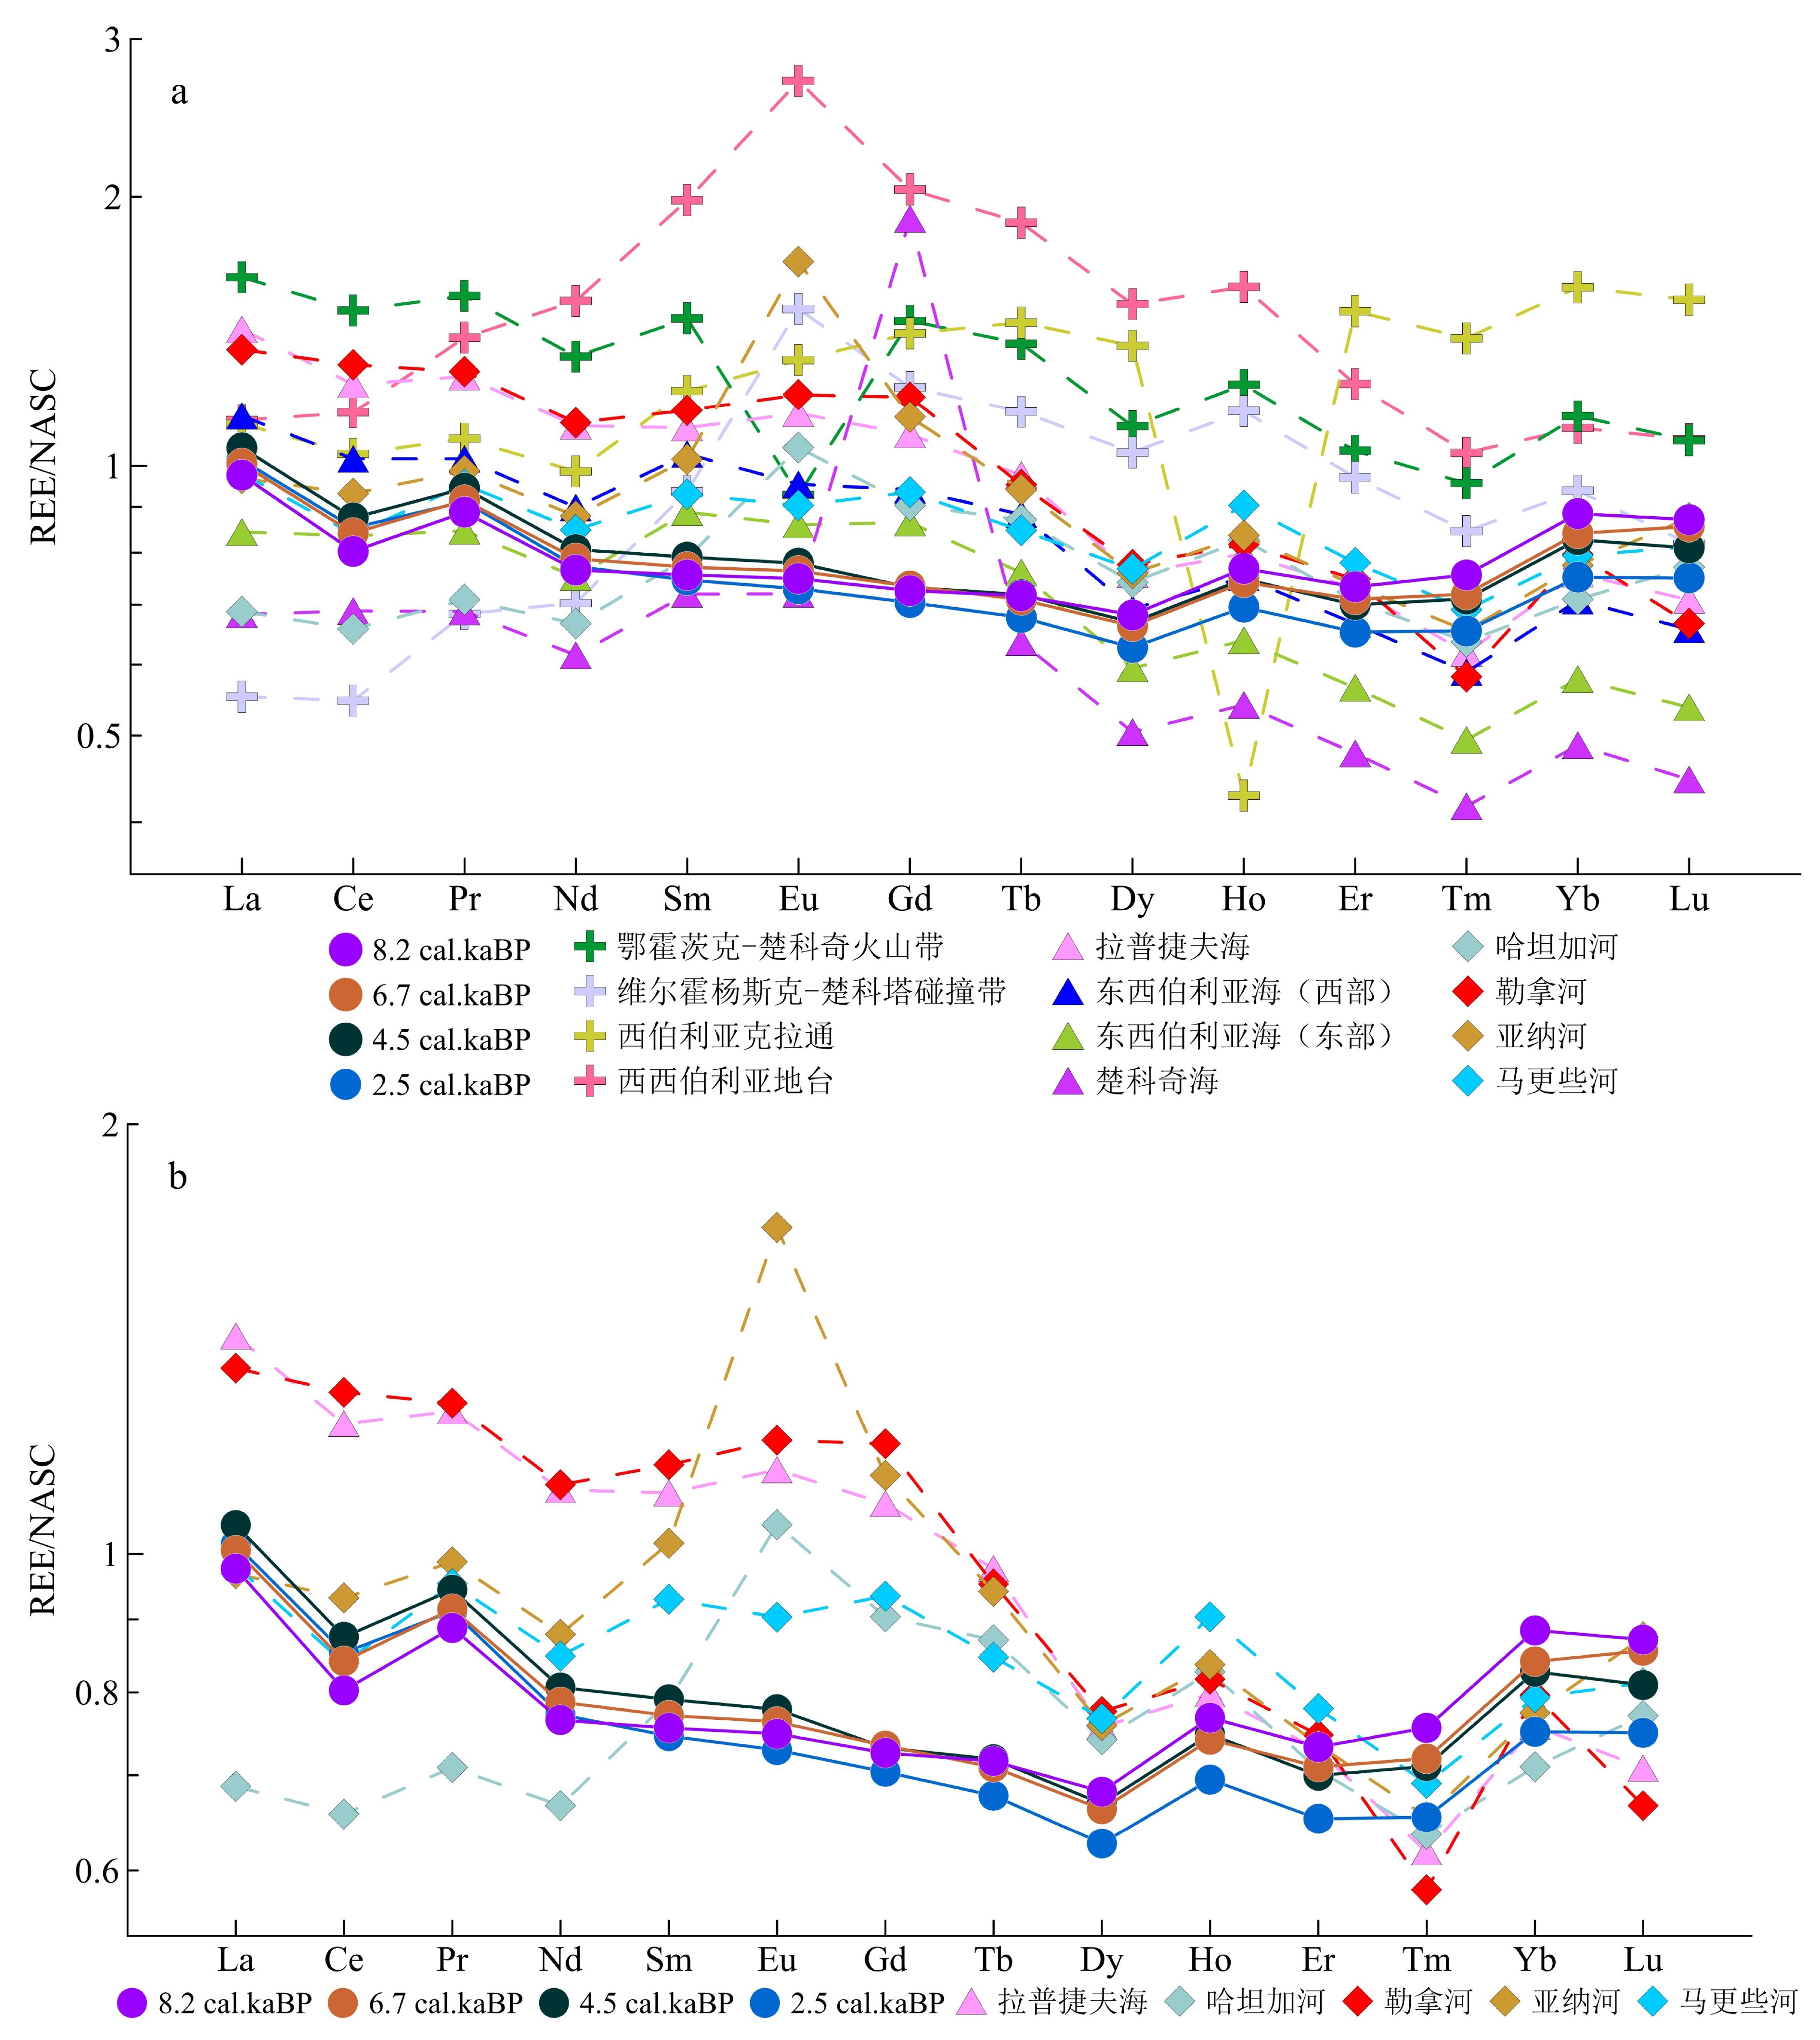
图 3 LV77-36岩心稀土元素含量及分异参数垂向变化Figure 3. Profiles of rare earth elements and parameters for core LV77-36北美页岩(NASC)标准化后的计算结果显示,δCe的值为0.86~0.90,平均值为0.87,整体表现为Ce弱负异常;δEu的值为0.99~1.05,平均值为1.02,基本无异常[47]。由图4可以发现,8.3 cal.kaBP 以来LV77-36岩心的NASC标准化稀土配分曲线很相似,差别较小。该岩心沉积物的稀土配分曲线整体显示为平坦的稀土元素分布模式,稍微右倾,中稀土和重稀土较轻稀土出现亏损。
![]() 图 4 LV77-36岩心碎屑组分稀土元素北美页岩标准化配分图a. 样品与所有潜在端元, b. 样品与相似潜在端元。数据来源:鄂霍茨克-楚科奇火山带、维尔霍杨斯克褶皱带、西伯利亚克拉通和西西伯利亚地台:GEOROC数据库;拉普捷夫海[22];东西伯利亚海(西部和东部)、楚科奇海[23];哈坦加河、勒拿河、亚纳河[48];马更些河[49-50]。Figure 4. The NASC-normalized patterns of detrital components of rare earth elements in core LV77-36a. Sample with all potential end-members, b. samples with similar potential end-members. Data sources: Okhotsk-Chukotka volcanic belt, Verhoyansk fold belt, Siberian Craton and West Siberian platform: GEOROC Database; Laptev Sea[22]; East Siberian Sea(West and East)and Chukchi Sea [23]; Khatanga River, Lena River and Yana River[48]; Mackenzie River[49-50].
图 4 LV77-36岩心碎屑组分稀土元素北美页岩标准化配分图a. 样品与所有潜在端元, b. 样品与相似潜在端元。数据来源:鄂霍茨克-楚科奇火山带、维尔霍杨斯克褶皱带、西伯利亚克拉通和西西伯利亚地台:GEOROC数据库;拉普捷夫海[22];东西伯利亚海(西部和东部)、楚科奇海[23];哈坦加河、勒拿河、亚纳河[48];马更些河[49-50]。Figure 4. The NASC-normalized patterns of detrital components of rare earth elements in core LV77-36a. Sample with all potential end-members, b. samples with similar potential end-members. Data sources: Okhotsk-Chukotka volcanic belt, Verhoyansk fold belt, Siberian Craton and West Siberian platform: GEOROC Database; Laptev Sea[22]; East Siberian Sea(West and East)and Chukchi Sea [23]; Khatanga River, Lena River and Yana River[48]; Mackenzie River[49-50].3.3 主成分分析
为提取出LV77-36岩心沉积物中各元素之间的内在关系,本文利用SPSS 24软件对沉积物碎屑组分中的主微量元素和稀土元素共17个变量进行主成分分析,采用最大方差法,经过正交旋转后提取出4个公因子,累积方差大于80%,能较好地代表样品整体的变化。因子载荷矩阵如表4所示,因子1和因子2的方差贡献分别为33.15%和20.90%,是影响沉积物元素地球化学分布的主要因素。因子1主要由MgO、Fe2O3、Al2O3和Rb、Co、Th以及V等元素组成,其中主量元素如Fe2O3、Al2O3属造岩矿物,海洋沉积物中可以表征陆源组分[51],而微量元素Co、Th、V分别与Al2O3(R=0.512、0.507、0.653)和Fe2O3(R=0.936、0.663、0.839)具有很好的正相关关系,也可以代表陆源物质的输入。因子2是Y、REE、Ta、TiO2、Ba的组合,稀土元素具有较强的抗迁移性,能较好地反映母岩的化学性质,因而可以作为示踪物源的重要指标[24, 52],其中TiO2元素主要在陆源黏土矿物中富集,性质稳定,基本随矿物一起搬运、沉积[53],因此,因子2也可以作为指示陆源沉积物的指标。因子3的方差贡献率为15.48%,主要是Hf和Zr两种元素。Hf和Zr等高场强元素倾向富集在锆石等粗颗粒重矿物中,表明该岩心沉积物受到富含重矿物的物质影响。根据Astakhov等人对东西伯利亚陆架沉积物的研究,这类重矿物元素与西伯利亚地台的古老结晶岩有关[23]。因此,因子3主要反映了西伯利亚地台物质的输入。因子4的方差贡献率为14.66%,主要由Sr和CaO组成,这两种元素常富集在碳酸盐岩中,在海洋沉积物中的富集往往与生物作用有关。有研究发现,马更些河沉积物以富碎屑碳酸钙为特征[54-55]。Viscosi-Shirley指出北极西伯利亚陆架表层沉积物中Sr的富集主要是新西伯利亚群岛地区未成熟砂岩的影响[32]。本研究样品前处理已去除生物碳酸钙,因子4可能代表马更些河/新西伯利亚群岛沉积物的输入。
表 4 LV77-36岩心沉积物主微量元素因子载荷矩阵Table 4. Factor loading matrix of major and trace elements in core LV77-36变量 因子1 因子2 因子3 因子4 方差 33.15 20.90 15.48 14.66 MgO 0.942 0.024 0.049 0.282 Fe2O3 0.883 −0.219 0.214 0.105 Rb 0.884 −0.102 0.237 0.278 Co 0.842 −0.254 0.287 0.196 V 0.803 −0.333 0.415 −0.172 Al2O3 0.776 0.508 −0.075 −0.120 Th 0.654 0.090 0.499 −0.249 Sr 0.036 0.077 −0.043 0.942 CaO 0.025 −0.393 0.491 0.711 Y −0.171 0.764 0.136 -0.102 REE 0.182 0.749 0.218 0.425 Ta −0.237 0.787 −0.248 −0.209 TiO2 −0.304 0.690 −0.480 −0.337 Ba 0.395 0.645 −0.477 −0.073 Hf 0.388 0.101 0.801 0.000 Zr 0.438 −0.190 0.738 0.367 黏土 −0.303 0.434 −0.054 −0.547 注:方差单位为%;元素粒度数据引自Astakhov[23]。 4. 讨论
4.1 潜在源区的地球化学特征
LV77-36岩心位于东西伯利亚陆架,前人研究发现东西伯利亚海的陆源沉积物主要来自河流搬运、海岸侵蚀和风尘输入[26-27, 56]。由于鲜见该区域风尘物质的地球化学组成报道,本文将不做讨论。因此,东西伯利亚海沉积物的潜在来源主要包括:① 北极主要河流(勒拿河、因迪吉尔卡河、亚纳河、科雷马河和马更些河)携带的悬浮物质; ② 洋流和海冰搬运的周边海域沉积物;③ 西伯利亚大陆、北美大陆和岛屿的海岸侵蚀产物。表5中列出潜在源区的相关元素平均含量,各源区典型的稀土元素地球化学特征如图4所示。
表 5 东西伯利亚海潜在源区及其元素平均含量Table 5. Potential source areas of the ESS and their mean element contents元素 鄂霍茨克-楚科奇火山带① 维尔霍杨斯克褶皱带① 西伯利亚克拉通① 西西伯利亚地台① 拉普捷夫海[22]
(SS)东西伯利亚海[23]
(SS)楚科奇海[23]
(SS)哈坦加河[48]
(SPM)勒拿河[48]
(SPM)亚纳河[48]
(SPM)马更些河[49-50]
(SPM)西部 东部 Rb 176.34 16.33 98.81 39.90 − 120.61 107.45 86.27 − − − − Zr 214.17 142.21 335.27 224.90 − 119.92 87.66 67.30 − − − − Th 21.99 2.03 10.57 3.32 − 10.63 8.77 7.29 − − − − La 52.03 17.68 35.65 36.00 45.50 36.40 27.00 21.85 22.00 43.20 31.00 31.40 Ce 108.99 39.93 75.27 83.80 90.10 74.33 61.00 50.28 48.00 94.80 68.00 61.20 Pr 12.25 5.40 8.47 11.00 9.95 8.04 6.69 5.44 5.60 10.08 7.80 7.53 Nd 43.77 23.2 32.54 50.50 36.60 29.67 24.80 20.28 22.00 36.90 29.00 28.00 Sm 8.34 5.34 6.92 11.30 6.29 5.88 5.06 4.10 4.50 6.58 5.80 5.30 Eu 1.15 1.50 1.63 3.34 1.42 1.18 1.07 0.89 1.30 1.49 2.10 1.12 Gd 7.56 6.37 7.32 10.60 5.64 4.89 4.50 9.83 4.70 6.21 5.90 4.86 Tb 1.17 0.98 1.23 1.59 0.83 0.75 0.65 0.54 0.74 0.81 0.80 0.72 Dy 6.43 6.01 7.91 8.80 4.39 4.02 3.45 2.93 4.30 4.50 4.40 4.45 Ho 1.28 1.20 1.71 1.65 0.83 0.78 0.66 0.56 0.86 0.85 0.87 0.94 Er 3.53 3.30 5.07 4.20 2.48 2.27 1.92 1.62 2.40 2.54 2.50 2.65 Tm 0.53 0.47 0.76 0.57 0.34 0.32 0.27 0.23 0.35 0.32 0.36 0.38 Yb 3.53 2.91 4.91 3.42 2.35 2.19 1.79 1.51 2.20 2.47 2.40 2.46 Lu 0.51 0.39 0.74 0.51 0.34 0.32 0.26 0.21 0.37 0.32 0.42 0.39 注:稀土元素含量单位为μg/g;SS为表层沉积物;SPM为悬浮颗粒物;−为无数据。 4.2 东西伯利亚陆架沉积物的来源
通过元素的主成分分析可知,因子1和因子2主要由陆源碎屑元素控制,其中MgO、Al2O3和REE的富集指示沉积物中有页岩的加入[32],而因迪吉尔卡河和亚纳河的页岩含量较高[29]。黏土矿物的证据也表明,东西伯利亚海表层沉积物中的伊利石主要来自因迪吉尔卡河[9, 57-58]。最近的研究也指出因迪吉尔卡河在很大程度上控制了东西伯利亚海黏土矿物(<2 μm)的组成[59],而LV77-36岩心沉积物的粒度组分以黏土(<4 μm)为主(46.2%~57.8%)[23]。因此,因子1和因子2所指示的陆源碎屑物的大部分黏土组分可能来自亚纳河、因迪吉尔卡河。
因子3代表的西伯利亚地台古代结晶岩可通过勒拿河以及海岸侵蚀搬运至拉普捷夫海,后随着西伯利亚沿岸流向东进入研究区。除此之外,卫星数据显示,现代条件下,北极夏季时研究区未被永久性海冰覆盖(图1a)。西伯利亚陆架形成的冰间湖有利于大量细粒沉积物保存在季节性海冰中[14],在夏季,破碎的海冰可以作为沉积物的搬运载体。此外,在+AO时,穿极流将含有勒拿河、亚纳河和西伯利亚地台物质的海冰携带至东西伯利亚海(图1b)。
因子4主要代表马更些河和新西伯利亚群岛的物质输入。前人研究认为,波弗特海陆架主要接收马更些河物质的供给[60]。根据波弗特环流的运移路径(图1b),在-AO时,波弗特环流可以将马更些河沉积物通过海冰搬运至东西伯利亚海边缘。目前在东西伯利亚海深水区发现有来自波弗特海的高岭石[19],并进入穿极流中继续向北搬运[33]。我们认为马更些河物质虽不能直接到达东西伯利亚陆架,但可能通过穿极流的循环对研究区产生影响。新西伯利亚群岛冰群主要通过海岸侵蚀为研究区提供沉积物[23]。
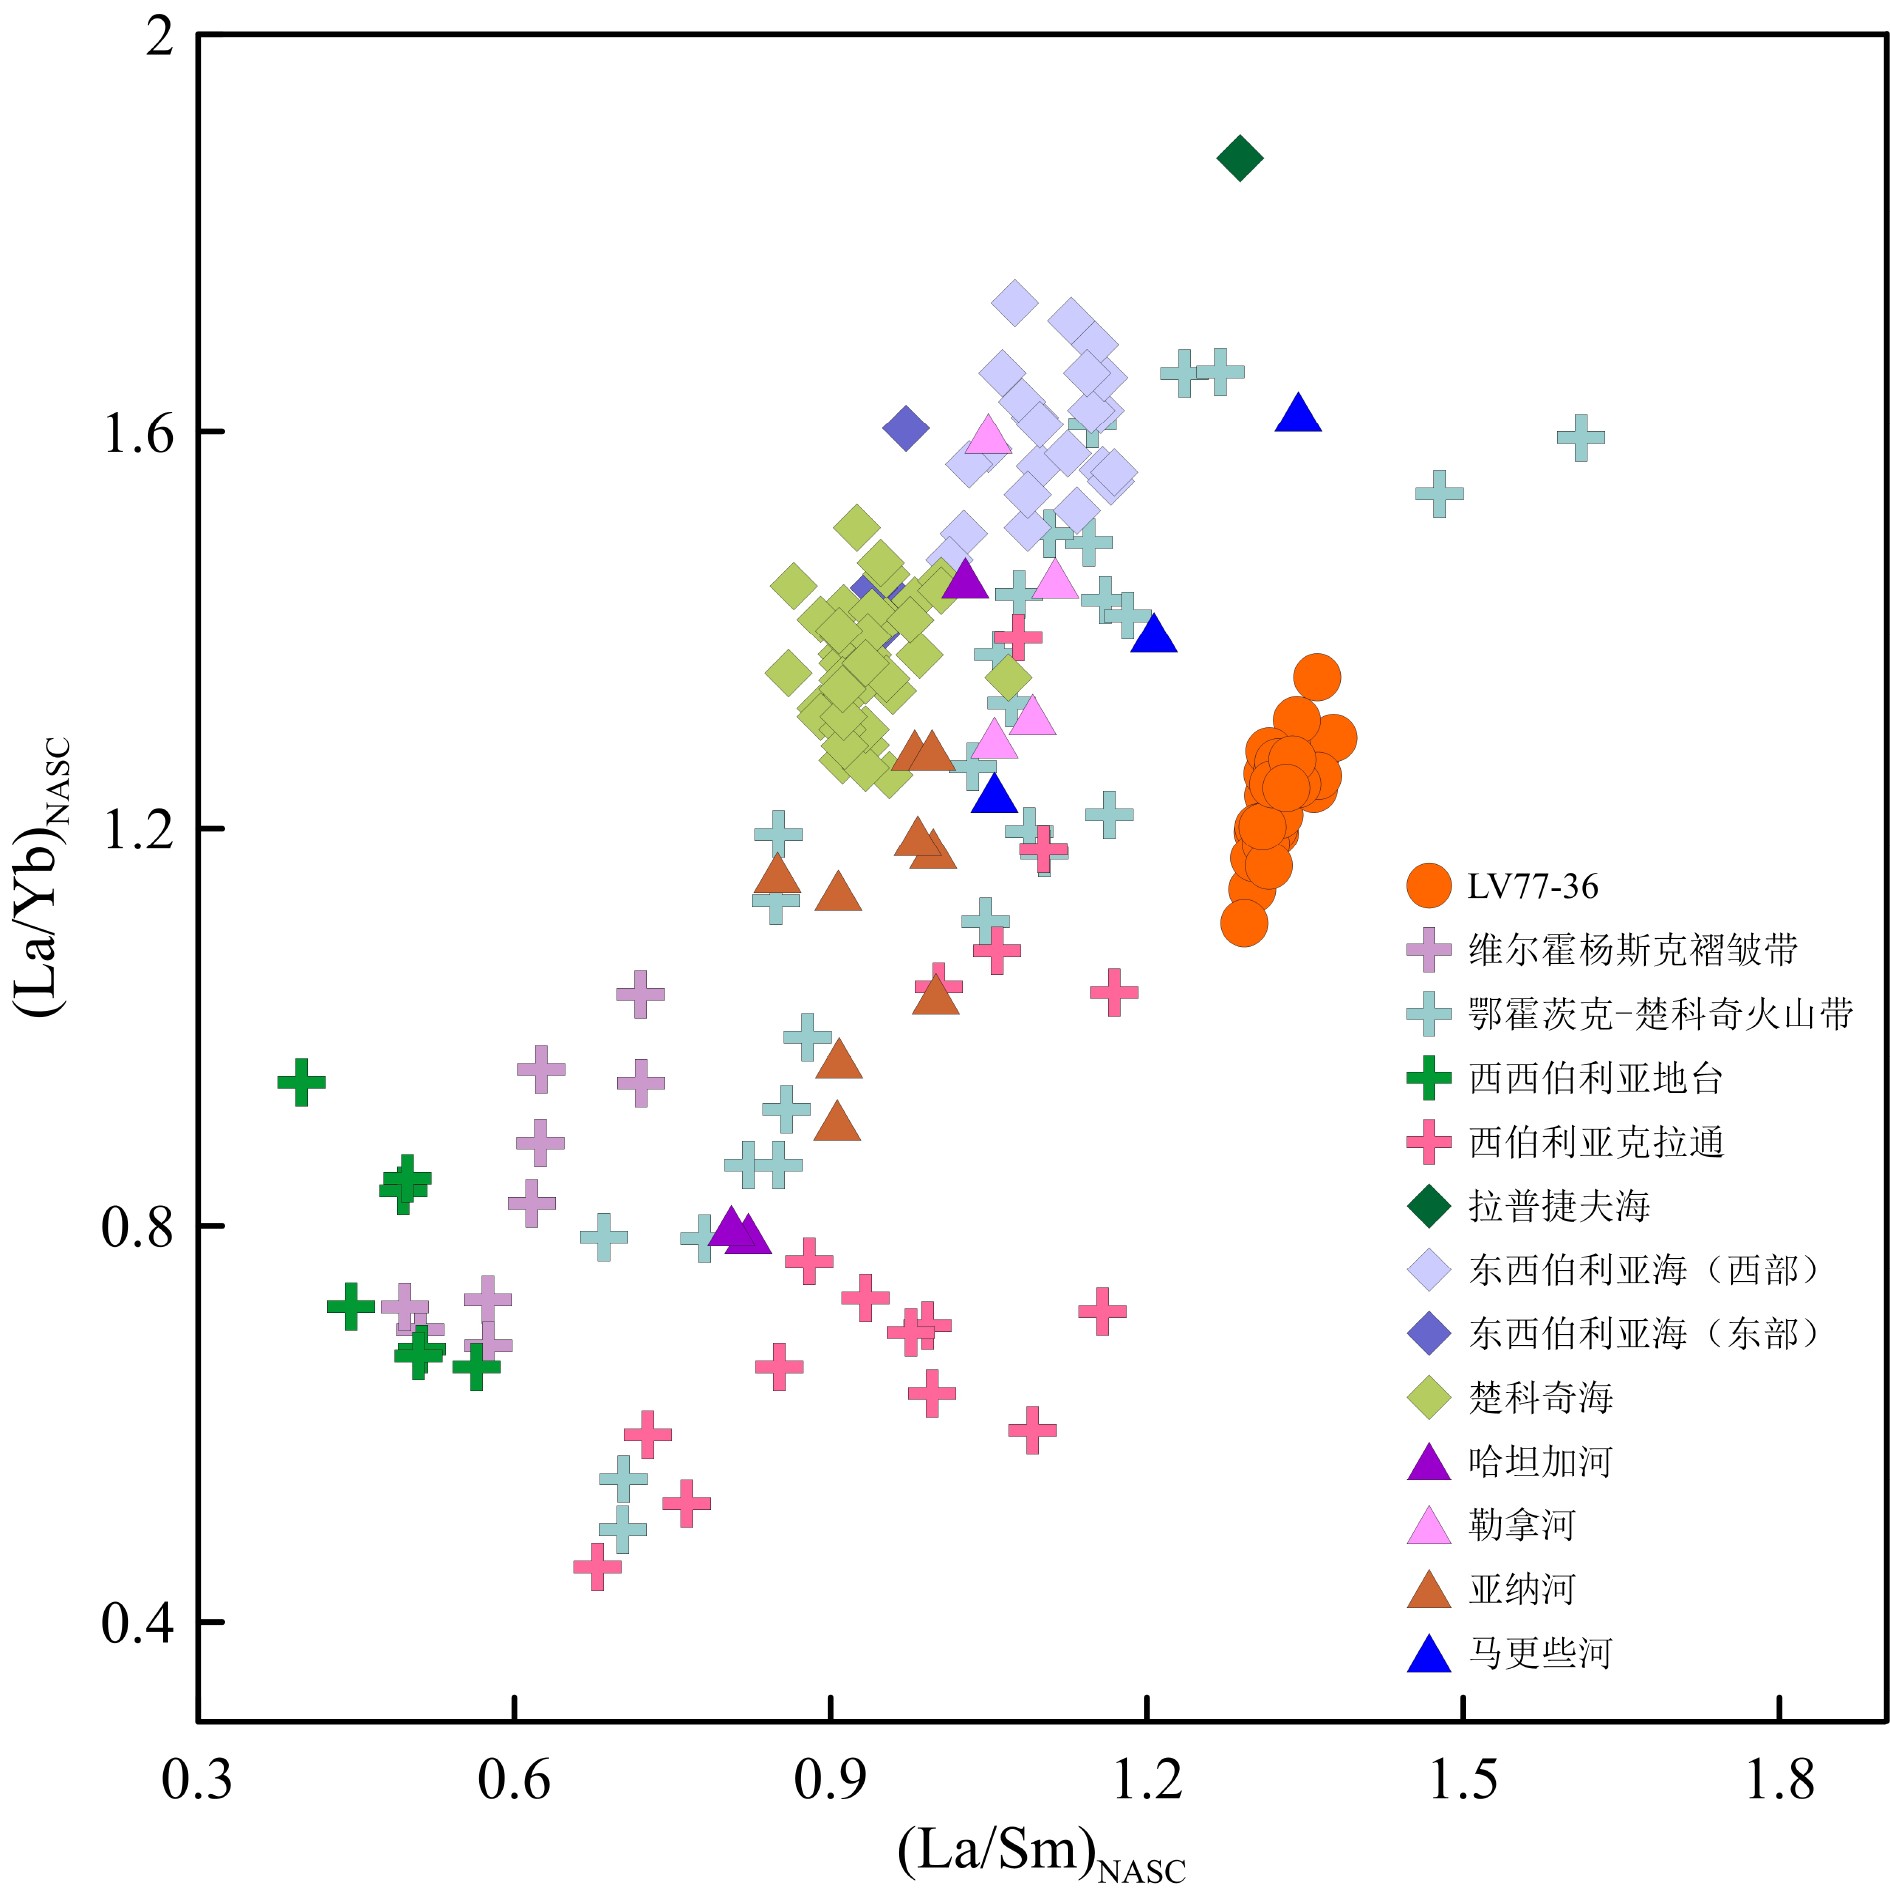
稀土元素配分图(图4b)显示,LV77-36岩心沉积物与勒拿河悬浮物质和拉普捷夫海表层沉积物的稀土元素配分模式最为相似,与马更些河和亚纳河较接近,但马更些河较研究区而言更为富集重稀土,亚纳河则呈现明显的Eu正异常。(La/Sm)NASC和(La/Yb)NASC关系图(图5)显示,拉普捷夫海沉积物对LV77-36岩心的影响小于勒拿河,可能说明LV77-36岩心沉积物中来自拉普捷夫海的颗粒物质主要沉积的是勒拿河物质。勒拿河口沉积物再悬浮后,在西伯利亚沿岸流的作用下向东搬运到研究区(图1)。因此,LV77-36岩心沉积物稀土元素受到多种来源的影响,主要是勒拿河和拉普捷夫海,其次是马更些河和亚纳河。
4.3 中全新世以来物质来源的演化
由图4可以发现,LV77-36岩心沉积物不同层位的稀土元素配分模式非常相似,稀土元素丰度的差异较小,说明中全新世以来沉积物的来源稳定。为定量表示8.3 cal.kaBP以来东西伯利亚陆架沉积物碎屑物质来源的变化,本文采用Pisias等人总结的利用元素进行多元统计示踪的方法[61]。该方法基于Matlab平台,主要步骤是:① Q型因子分析:将选定的各元素输入程序后,判断沉积物可能的组成端元,以及各端元的元素含量; ② 约束最小二乘法多元线性回归:将各端元选定元素和研究站位对应元素输入程序后进行拟合,模型残差绝对值之和最小的端元组合为最优解。该方法目前已用于日本海[62]、中国东海[63]和南太平洋[64]等地的沉积物物源演化的重建工作。
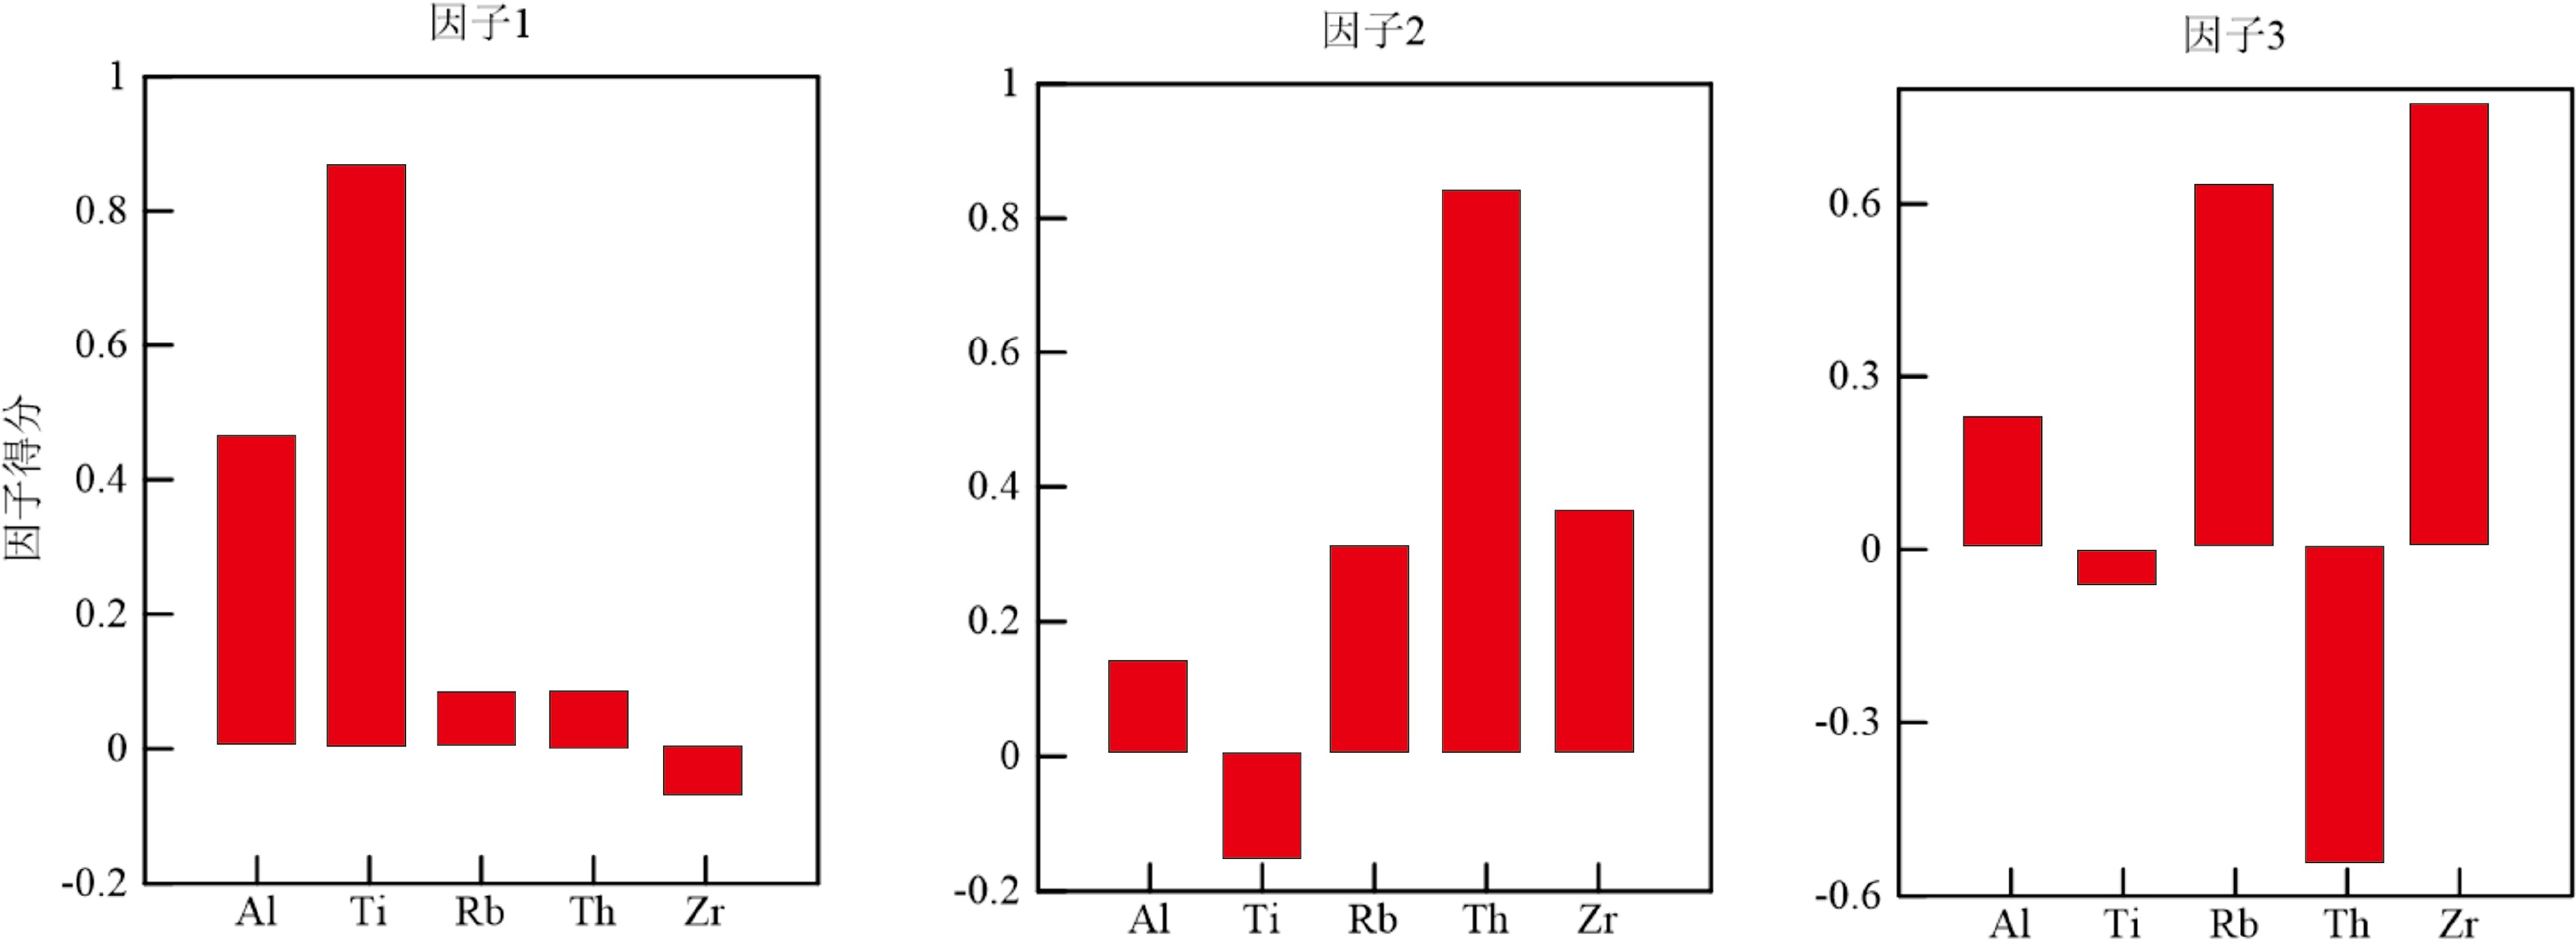
由于东西伯利亚海及其周边区域的研究数据有限,Sc、Cr元素未有数据记录,故而将Sc、Cr等物源判别元素剔除,选取物源指示意义较强的Al、Ti、Rb、Th和Zr元素进行多元统计。对LV77-36岩心沉积物中的Al、Ti、Rb、Th和Zr元素进行Q型因子分析,结果显示为3个端元,可以解释99.98%的数据变率。如图6所示,端元1可以解释43.7%的数据变率,代表元素为Ti;端元2可以解释43%的数据变率,代表元素为Th;端元3可以解释13.3%的变化,代表元素主要为Zr。
Q型因子分析确定的3个端元再进行约束最小二乘法多元线性回归计算。LV77-36岩心沉积物的主成分和稀土元素分析得出,研究区沉积物的来源有勒拿河、亚纳河、因迪吉尔卡河、马更些河和西伯利亚地台与新西伯利亚群岛,但因迪吉尔卡河和新西伯利亚群岛的Al、Ti、Rb、Th和Zr元素数据缺失。因此,本文选取西伯利亚克拉通①、西西伯利亚地台①、维尔霍杨斯克褶皱带①、鄂霍茨克–楚科奇火山带①、哈坦加河[48]、勒拿河[48]、亚纳河[48]和马更些河[49-50] 8个Al、Ti、Rb、Th和Zr元素数据充分的源区,利用约束最小二乘法迭代计算代码进行匹配。结果显示,勒拿河、马更些河和西西伯利亚地台在LV77-36岩心沉积物中陆源碎屑物质的贡献上具有年代上的差异。勒拿河输入在LV77-36岩心沉积物碎屑组分的贡献中占主要部分,马更些河沉积物的相对贡献较小,而西西伯利亚地台的贡献最小。勒拿河与西西伯利亚地台代表西伯利亚端元,马更些河代表北美端元,相对中全新世而言,晚全新世时期西伯利亚端元的物质相对贡献有所下降,北美端元相对增加(图7)。
4.4 沉积物来源变化对古环境演变的响应
主成分分析结果显示,因子1和因子2代表的元素组合可以指示陆源碎屑。将LV77-36岩心的因子1、因子2以及沉积速率与65°N夏季日射量[65]、全球海平面变化曲线[66]、格陵兰NGRIP冰心的δ18O[67]和拉普捷夫海PS51/80-13岩心的孢粉通量[68]进行对比(图8)②。
前人研究结果认为,11.4 cal.kaBP以来,东西伯利亚海边缘的海平面快速上升[15],导致海岸线持续向南后退,东西伯利亚陆架也从陆相过渡为浅海相[69],导致海岸侵蚀加剧[19],为研究区提供了大量由河流排泄和海岸侵蚀输送的陆源物质。Klemann等认为全新世以来拉普捷夫海和东西伯利亚海的海平面变化范围大致相同,约8 cal.kaBP上升至–20~–10 m[70],前文提到德米特里–拉普捷夫海峡水深在−20 m左右,也就是说在8 cal.kaBP左右海峡可能已经打开。海峡的开通为勒拿河、亚纳河以及拉普捷夫海物质向东西伯利亚海的运输提供了通道,这些来源的沉积物随着西伯利亚沿岸流输送至东西伯利亚海。LV77-36岩心沉积物的沉积速率和因子1及因子2载荷也显示8.3 cal.kaBP左右陆源物质输入的增加(图8),表明此阶段输送到东西伯利亚陆架的陆源物质大量增加。
前人通过对岩心沉积物的研究,重建了全新世以来西伯利亚边缘海的海冰变化。Hörner等人用海冰生物标志物(IP25)重建冰期后拉普捷夫海西部的海冰覆盖条件的变化,研究显示在全新世中期—晚期,随着日射量减少,海冰覆盖增加,并且河流径流增强[71],使得汇入到拉普捷夫海的勒拿河和亚纳河的物质,以及海岸侵蚀物质,在西伯利亚沿岸流和穿极流的作用下搬运至东西伯利亚海。因此,研究区可以接收来自西伯利亚端元的物质。Stein等人通过对岩心PS72/350和ARA2B-1A的IP25研究发现,全新世中期东西伯利亚海和楚科奇海的海冰覆盖面积也在逐渐减少[4],加上7~1.8 cal.kaBP以来北美河流的径流量与输沙量的大幅下降[72]和波弗特环流的减弱[73],从而导致马更些河的物质输入较少。因此西伯利亚端元和北美端元的贡献比例差异较大(图7)。
Rudenko等通过对拉普捷夫海PS51/80-13岩心沉积物中孢粉通量进行研究,发现在6~5 cal.kaBP和2.5~2 cal.kaBP期间沉积物中记录了孢粉的峰值(图8),格陵兰冰芯的δ18O值也呈现低值的趋势,表明这两个时期气候非常温暖。LV77-36岩心沉积物也显示约6 cal.kaBP以来,陆源物质输入逐渐减少(图8),进一步说明海冰覆盖减少影响研究区沉积物的物质分布与沉积。
记录显示,全新世晚期气候普遍较冷[74],勒拿河流域的植被中也记录了东北西伯利亚地区2 cal.kaBP以来气温降低的信息[75],Stein通过IP25记录也指出楚科奇海自2 cal.kaBP以来由于日射量减少,海冰覆盖增加[4]。根据北极涛动的变化周期,1.5 cal.kaBP之后,−AO占据主要位置,波弗特环流的作用增强,向东西伯利亚海一侧延伸,而穿极流被限制在北极西伯利亚一侧[42-43]。另外,2 cal.kaBP以来西伯利亚沿岸流的影响在不断减弱[23],使得勒拿河、西西伯利亚地台和亚纳河等物质输入减少,因而全新世晚期较中期而言,马更些河的贡献比例(并不代表绝对输入量)有所增加(图7),具体机制有待进一步深入研究。
5. 结论
(1)对LV77-36岩心沉积物的元素进行主成分分析。因子1和因子2代表陆源物质的输入;因子3反映沉积物受含有重矿物的物质影响;因子4指示沉积物受到陆源碎屑碳酸盐岩和未成熟砂岩的影响。
(2)通过主成分分析和稀土元素分析,LV77-36岩心沉积物源不仅有勒拿河、亚纳河、因迪吉尔卡河和马更些河的河流输入,而且包含西伯利亚地台与新西伯利亚群岛的海岸侵蚀物质。
(3)中全新世以来,LV77-36岩心沉积物来源较稳定,只是物源间的相对贡献有一定程度的波动。东西伯利亚陆架沉积物的来源以西伯利亚端元的物质供应为主,北美端元的贡献较小。相较全新世中期,晚期时西伯利亚端元的相对贡献减小,北美端元增加。
(4)中全新世以来古环境和古气候的变化影响着LV77-36岩心沉积物中陆源物质贡献的差异。在中全新世,拉普捷夫海海冰增加、楚科奇海海冰减少,使研究区中西伯利亚端元的物质贡献较大;在全新世晚期,随着楚科奇海冰的增加、西伯利亚沿岸流的减弱和波弗特环流的增强,北美端元的物质贡献比例有所增加。
致谢:感谢第一次中俄北极联合科学考察的全体工作人员为本文提供的样品支持。
-
![]()
图 1 东西伯利亚海陆架概况及LV77-36岩心位置
环流模式根据文献[41, 44]绘制;地形根据文献[33]绘制。 a. 东西伯利亚海陆架概况(ACC:阿拉斯加沿岸流, BSSW:白令海陆架水, AC:阿纳德尔流, SCC:西伯利亚沿岸流, TPD:穿极流, BG:波弗特环流。红色圆点为LV77-36岩心位置;紫色圆点为鄂霍茨克–楚科奇火山带,蓝色圆点为维尔霍杨斯克褶皱带,绿色圆点为西西伯利亚地台取样位置,数据来源:GEOROC 数据库;白色区域为现代夏季北冰洋海冰覆盖范围,数据来源:www.meereisportal.de);b. LV77-36岩心位置(AO:北极涛动;黑色箭头:负北极涛动时期的TPD和BG, 白色箭头:正北极涛动时期的TPD和BG)。
Figure 1. Schematic map of Arctic East Siberian Shelf and site of LV77-36
Circumfluence modified from references[41, 44]; the different terraines modified from references[33]. a. Overview of the Arctic East Siberian Shelf(ACC: Alaskan Coastal Current, BSSW: Bering Sea Shelf Water, AC: Anadel Current,SCC: Siberian Coastal Current, TPD: Transpolar Drift, BG: Beaufort Gyre. The red dot represents site core LV77-36; purple dots represent sites in the Okhotsk-Chukochi volcanic belt, blue dots represent sites in the Verkhoyansk fold belt and green dots represent sites in the West Siberian platform, data source; GEOROC Database; The white area is the extent of Arctic sea ice in the modern summer, data source: www.meereisportal.de); b. The location of core LV77-36(Black arrow: TPD and BG during the negative Arctic Oscillation, White arrow: TPD and BG during the Positive Arctic Oscillation).
![]()
![]()
图 3 LV77-36岩心稀土元素含量及分异参数垂向变化
Figure 3. Profiles of rare earth elements and parameters for core LV77-36
![]()
图 4 LV77-36岩心碎屑组分稀土元素北美页岩标准化配分图
a. 样品与所有潜在端元, b. 样品与相似潜在端元。数据来源:鄂霍茨克-楚科奇火山带、维尔霍杨斯克褶皱带、西伯利亚克拉通和西西伯利亚地台:GEOROC数据库;拉普捷夫海[22];东西伯利亚海(西部和东部)、楚科奇海[23];哈坦加河、勒拿河、亚纳河[48];马更些河[49-50]。
Figure 4. The NASC-normalized patterns of detrital components of rare earth elements in core LV77-36
a. Sample with all potential end-members, b. samples with similar potential end-members. Data sources: Okhotsk-Chukotka volcanic belt, Verhoyansk fold belt, Siberian Craton and West Siberian platform: GEOROC Database; Laptev Sea[22]; East Siberian Sea(West and East)and Chukchi Sea [23]; Khatanga River, Lena River and Yana River[48]; Mackenzie River[49-50].
![]()
图 5 LV77-36岩心沉积物和潜在物源的(La/Sm) NASC与 (La/Yb) NASC关系图
数据来源:鄂霍茨克–楚科奇火山带、维尔霍杨斯克褶皱带、西伯利亚克拉通和西西伯利亚地台:GEOROC数据库;拉普捷夫海[22];东西伯利亚海(西部和东部)[23]、楚科奇海[23];哈坦加河[48]、勒拿河[48]、亚纳河[48];马更些河[49-50]。
Figure 5. Plot of(La/Sm)NASC versus(La/Yb)NASC in core LV77-36 and potential sediment source end-members
Data sources: Okhotsk-Chukotka volcanic belt, Verhoyansk fold belt, Siberian Craton and West Siberian platform: GEOROC Database; Laptev Sea[22]; East Siberian Sea(West and East)and Chukchi Sea[23]; Khatanga River, Lena River and Yana River [48]; Mackenzie River[49-50].
![]()
图 8 早全新世以来的环境记录对比图
a. 全球海平面曲线[67],b. 65°N夏季日射量[66],c. 格陵兰NGRIP冰心的δ18O[68],d. 拉普捷夫海PS51/80-13岩心的孢粉通量[69],e. LV77-36岩心沉积速率,f. LV77-36岩心主成分分析因子2,g. LV77-36岩心主成分分析因子1。
Figure 8. Comparison of different records since Early Holocene
a. Global sea level curve[67], b. Amount of solar radiation in summer at 65°N[66], c. δ18O in ice core NGRIP of Greenland[68], d. Palynological flux in core PS51/80-13[69], e. Deposition rate in core LV77-36, f. Factor 2 in core LV77-36, g. Factor 1 in core LV77-36.
表 1 LV77-36岩心沉积物碎屑组分主量元素含量
Table 1 Major element contents of detrital components in core LV77-36
Al2O3 Fe2O3 CaO MgO K2O Na2O MnO P2O5 TiO2 最小值 14.94 4.59 0.38 1.38 2.93 2.14 0.03 0.05 0.79 最大值 16.73 5.67 0.51 1.63 3.18 2.50 0.03 0.08 0.90 平均值 15.75 5.07 0.46 1.50 3.03 2.34 0.03 0.06 0.83 标准差 0.39 0.28 0.03 0.06 0.07 0.08 0.00 0.01 0.03 注:主量元素含量单位为%。  下载: 导出CSV
表 2 LV77-36岩心沉积物碎屑组分微量元素含量
Table 2 Trace element contents of detrital components in core LV77-36
Sc Cr Co Ni Sr Ba Hf Pb Th Zr 最小值 11.54 73.35 8.04 23.64 128.82 617.16 5.55 7.18 9.42 181.90 最大值 15.48 90.35 10.24 32.15 148.91 680.29 6.49 8.15 12.43 229.60 平均值 13.73 80.61 9.17 26.88 139.93 640.42 5.87 7.64 10.80 200.43 标准差 0.82 3.77 0.60 2.11 5.39 13.21 0.21 0.25 0.77 10.22 注:微量元素含量单位为μg/g。
下载: 导出CSV
表 3 LV77-36岩心碎屑组分稀土元素含量及主要参数
Table 3 Contents and parameters of rare earth elements from detrital components of core LV77-36
最小值 最大值 平均值 标准差 La 31.25 34.17 32.38 0.74 Ce 58.53 65.01 61.47 1.63 Pr 6.99 7.63 7.23 0.17 Nd 25.00 27.19 25.77 0.60 Sm 4.20 4.55 4.35 0.09 Eu 0.90 0.99 0.94 0.02 Gd 3.59 3.99 3.75 0.09 Tb 0.57 0.64 0.60 0.02 Dy 3.63 4.08 3.82 0.12 Ho 0.72 0.82 0.77 0.02 Er 2.22 2.52 2.37 0.08 Tm 0.36 0.42 0.39 0.01 Yb 2.33 2.74 2.55 0.10 Lu 0.36 0.44 0.39 0.02 ΣREE 141.56 154.43 146.77 3.23 ΣLREE 127.28 139.43 132.13 3.06 ΣHREE 13.86 15.56 14.64 0.43 LREE/HREE 8.38 9.57 9.03 0.28 (La/Sm) NASC 1.29 1.38 1.33 0.02 (La/Yb) NASC 1.10 1.35 1.23 0.05 δCe 0.86 0.90 0.87 0.01 δEu 0.99 1.05 1.02 0.01 注:稀土元素含量单位为μg/g;
δCe$= \dfrac{ { {\rm{Ce} } } }{ { {\rm{Ce*} } } } = \dfrac{ { {\rm{Ce_{NASC} } } }}{ {\sqrt { {\rm{La_{NASC} \times Pr_{NASC} } } } } }$,δEu$= \dfrac{ { {\rm{Eu} } } }{ { {\rm{Eu*} } } } = \dfrac{ { {\rm{Eu_{NASC} } } }}{ {\sqrt { {\rm{Sm_{NASC} \times Gd_{NASC} } } } } }$;
其中NASC为北美页岩标准化的结果。
下载: 导出CSV
表 4 LV77-36岩心沉积物主微量元素因子载荷矩阵
Table 4 Factor loading matrix of major and trace elements in core LV77-36
变量 因子1 因子2 因子3 因子4 方差 33.15 20.90 15.48 14.66 MgO 0.942 0.024 0.049 0.282 Fe2O3 0.883 −0.219 0.214 0.105 Rb 0.884 −0.102 0.237 0.278 Co 0.842 −0.254 0.287 0.196 V 0.803 −0.333 0.415 −0.172 Al2O3 0.776 0.508 −0.075 −0.120 Th 0.654 0.090 0.499 −0.249 Sr 0.036 0.077 −0.043 0.942 CaO 0.025 −0.393 0.491 0.711 Y −0.171 0.764 0.136 -0.102 REE 0.182 0.749 0.218 0.425 Ta −0.237 0.787 −0.248 −0.209 TiO2 −0.304 0.690 −0.480 −0.337 Ba 0.395 0.645 −0.477 −0.073 Hf 0.388 0.101 0.801 0.000 Zr 0.438 −0.190 0.738 0.367 黏土 −0.303 0.434 −0.054 −0.547 注:方差单位为%;元素粒度数据引自Astakhov[23]。
下载: 导出CSV
表 5 东西伯利亚海潜在源区及其元素平均含量
Table 5 Potential source areas of the ESS and their mean element contents
元素 鄂霍茨克-楚科奇火山带① 维尔霍杨斯克褶皱带① 西伯利亚克拉通① 西西伯利亚地台① 拉普捷夫海[22]
(SS)东西伯利亚海[23]
(SS)楚科奇海[23]
(SS)哈坦加河[48]
(SPM)勒拿河[48]
(SPM)亚纳河[48]
(SPM)马更些河[49-50]
(SPM)西部 东部 Rb 176.34 16.33 98.81 39.90 − 120.61 107.45 86.27 − − − − Zr 214.17 142.21 335.27 224.90 − 119.92 87.66 67.30 − − − − Th 21.99 2.03 10.57 3.32 − 10.63 8.77 7.29 − − − − La 52.03 17.68 35.65 36.00 45.50 36.40 27.00 21.85 22.00 43.20 31.00 31.40 Ce 108.99 39.93 75.27 83.80 90.10 74.33 61.00 50.28 48.00 94.80 68.00 61.20 Pr 12.25 5.40 8.47 11.00 9.95 8.04 6.69 5.44 5.60 10.08 7.80 7.53 Nd 43.77 23.2 32.54 50.50 36.60 29.67 24.80 20.28 22.00 36.90 29.00 28.00 Sm 8.34 5.34 6.92 11.30 6.29 5.88 5.06 4.10 4.50 6.58 5.80 5.30 Eu 1.15 1.50 1.63 3.34 1.42 1.18 1.07 0.89 1.30 1.49 2.10 1.12 Gd 7.56 6.37 7.32 10.60 5.64 4.89 4.50 9.83 4.70 6.21 5.90 4.86 Tb 1.17 0.98 1.23 1.59 0.83 0.75 0.65 0.54 0.74 0.81 0.80 0.72 Dy 6.43 6.01 7.91 8.80 4.39 4.02 3.45 2.93 4.30 4.50 4.40 4.45 Ho 1.28 1.20 1.71 1.65 0.83 0.78 0.66 0.56 0.86 0.85 0.87 0.94 Er 3.53 3.30 5.07 4.20 2.48 2.27 1.92 1.62 2.40 2.54 2.50 2.65 Tm 0.53 0.47 0.76 0.57 0.34 0.32 0.27 0.23 0.35 0.32 0.36 0.38 Yb 3.53 2.91 4.91 3.42 2.35 2.19 1.79 1.51 2.20 2.47 2.40 2.46 Lu 0.51 0.39 0.74 0.51 0.34 0.32 0.26 0.21 0.37 0.32 0.42 0.39 注:稀土元素含量单位为μg/g;SS为表层沉积物;SPM为悬浮颗粒物;−为无数据。
下载: 导出CSV
-
[1] 柯长青, 金鑫, 沈校熠, 等. 南北极海冰变化及其影响因素的对比分析[J]. 极地研究, 2020, 32(1):1-12 KE Changqing, JIN Xin, SHEN Xiaoyi, et al. Comparison of antarctic and arctic seaice variations and their impact factors [J]. Chinese Journal of Polar Research, 2020, 32(1): 1-12.
[2] Serreze M C, Barry R G. Processes and impacts of Arctic amplification: A research synthesis [J]. Global and Planetary Change, 2011, 77(1-2): 85-96. doi: 10.1016/j.gloplacha.2011.03.004
[3] Chapman W L, Walsh J E. Recent variations of sea ice and air temperature in high latitudes [J]. Bulletin of the American Meteorological Society, 1993, 74(1): 33-48. doi: 10.1175/1520-0477(1993)074<0033:RVOSIA>2.0.CO;2
[4] Stein R, Fahl K, Schade I, et al. Holocene variability in sea ice cover, primary production, and Pacific-Water inflow and climate change in the Chukchi and East Siberian Seas (Arctic Ocean) [J]. Journal of Quaternary Science, 2017, 32(3): 362-379. doi: 10.1002/jqs.2929
[5] Frey K E, Moore G W K, Cooper L W, et al. Divergent patterns of recent sea ice cover across the Bering, Chukchi, and Beaufort seas of the Pacific Arctic Region [J]. Progress in Oceanography, 2015, 136: 32-49. doi: 10.1016/j.pocean.2015.05.009
[6] Shakhova N, Semiletov I, Sergienko V, et al. The East Siberian Arctic Shelf: towards further assessment of permafrost-related methane fluxes and role of sea ice [J]. Philosophical Transactions of the Royal Society A: Mathematical, Physical and Engineering Sciences, 2015, 373(2052): 20140451. doi: 10.1098/rsta.2014.0451
[7] Vonk J E, Sánchez-García L, Van Dongen B E, et al. Activation of old carbon by erosion of coastal and subsea permafrost in Arctic Siberia [J]. Nature, 2012, 489(7414): 137-140. doi: 10.1038/nature11392
[8] Bröder L, Andersson A, Tesi T, et al. Quantifying Degradative loss of terrigenous organic carbon in surface sediments across the Laptev and east Siberian sea [J]. Global Biogeochemical Cycles, 2019, 33(1): 85-99. doi: 10.1029/2018GB005967
[9] Nikolaeva N A, Derkachev A N, Dudarev O V. Mineral composition of sediments from the Eastern Laptev Sea shelf and East Siberian Sea [J]. Oceanology, 2013, 53(4): 472-480. doi: 10.1134/S0001437013040073
[10] Chen M L, Kim J H, Lee Y K, et al. Subsea permafrost as a potential major source of dissolved organic matter to the East Siberian Arctic Shelf [J]. Science of the Total Environment, 2021, 777: 146100. doi: 10.1016/j.scitotenv.2021.146100
[11] Guo L D, Semiletov I, Gustafsson Ö, et al. Characterization of Siberian Arctic coastal sediments: Implications for terrestrial organic carbon export [J]. Global Biogeochemical Cycles, 2004, 18(1): GB1036.
[12] Keskitalo K, Tesi T, Bröder L, et al. Sources and characteristics of terrestrial carbon in Holocene-scale sediments of the East Siberian Sea [J]. Climate of the Past, 2017, 13(9): 1213-1226. doi: 10.5194/cp-13-1213-2017
[13] Tesi T, Geibel M C, Pearce C, et al. Carbon geochemistry of plankton-dominated samples in the Laptev and East Siberian shelves: contrasts in suspended particle composition [J]. Ocean Science, 2017, 13(5): 735-748. doi: 10.5194/os-13-735-2017
[14] Bauch H A, Kassens H. Arctic Siberian shelf environments—an introduction [J]. Global and Planetary Change, 2005, 48(1-3): 1-8. doi: 10.1016/j.gloplacha.2004.12.003
[15] Cronin T M, O'Regan M, Pearce C, et al. Deglacial sea level history of the East Siberian Sea and Chukchi Sea margins [J]. Climate of the Past, 2017, 13(9): 1097-1110. doi: 10.5194/cp-13-1097-2017
[16] Dudarev O V, Semiletov I P, Charkin A N, et al. Deposition settings on the continental shelf of the East Siberian Sea [J]. Doklady Earth Sciences, 2006, 409(6): 1000-1005.
[17] Joe Y J, Polyak L, Schreck M, et al. Late Quaternary depositional and glacial history of the Arliss Plateau off the East Siberian margin in the western Arctic Ocean [J]. Quaternary Science Reviews, 2020, 228: 106099. doi: 10.1016/j.quascirev.2019.106099
[18] Niessen F, Hong J K, Hegewald A, et al. Repeated Pleistocene glaciation of the East Siberian continental margin [J]. Nature Geoscience, 2013, 6(10): 842-846. doi: 10.1038/ngeo1904
[19] Wegner C, Bennett K E, De Vernal A, et al. Variability in transport of terrigenous material on the shelves and the deep Arctic Ocean during the Holocene [J]. Polar Research, 2015, 34(1): 24964. doi: 10.3402/polar.v34.24964
[20] Maccali J, Hillaire-Marcel C, Not C. Radiogenic isotope (Nd, Pb, Sr) signatures of surface and sea ice-transported sediments from the Arctic Ocean under the present interglacial conditions [J]. Polar Research, 2018, 37(1): 1442982. doi: 10.1080/17518369.2018.1442982
[21] Rachold V, Grigoriev M N, Are F E, et al. Coastal erosion vs riverine sediment discharge in the Arctic Shelf seas [J]. International Journal of Earth Sciences, 2000, 89(3): 450-460. doi: 10.1007/s005310000113
[22] Astakhov A S, Semiletov I P, Sattarova V V, et al. Rare earth elements in the bottom sediments of the east arctic seas of Russia as indicators of Terrigenous input [J]. Doklady Earth Sciences, 2018, 482(2): 1324-1327. doi: 10.1134/S1028334X18100021
[23] Astakhov A S, Sattarova V V, Shi X F, et al. Distribution and sources of rare earth elements in sediments of the Chukchi and East Siberian Seas [J]. Polar Science, 2019, 20: 148-159. doi: 10.1016/j.polar.2019.05.005
[24] 杨守业, 李从先. REE示踪沉积物物源研究进展[J]. 地球科学进展, 1999, 14(2):164-167 doi: 10.3321/j.issn:1001-8166.1999.02.010 YANG Shouye, LI Congxian. Research progress in REE tracer for sediment source [J]. Acta Electronica Sinica, 1999, 14(2): 164-167. doi: 10.3321/j.issn:1001-8166.1999.02.010
[25] Dou Y G, Yang S Y, Liu Z X, et al. Provenance discrimination of siliciclastic sediments in the middle Okinawa Trough since 30 ka: Constraints from rare earth element compositions [J]. Marine Geology, 2010, 275(1-4): 212-220. doi: 10.1016/j.margeo.2010.06.002
[26] Gordeev V V, Martin J M, Sidorov I S, et al. A reassessment of the Eurasian river input of water, sediment, major elements, and nutrients to the Arctic Ocean [J]. American Journal of Science, 1996, 296(6): 664-691. doi: 10.2475/ajs.296.6.664
[27] Gordeev V V. Fluvial sediment flux to the Arctic Ocean [J]. Geomorphology, 2006, 80(1-2): 94-104. doi: 10.1016/j.geomorph.2005.09.008
[28] HOlmes R M, McClelland J M, Peterson B J, et al. A circumpolar perspective on fluvial sediment flux to the Arctic ocean [J]. Global Biogeochemical Cycles, 2002, 16(4): 45-1-45-14.
[29] Suchet P A, Probst J L, Ludwig W. Worldwide distribution of continental rock lithology: Implications for the atmospheric/soil CO2 uptake by continental weathering and alkalinity river transport to the oceans [J]. Global Biogeochemical Cycles, 2003, 17(2): 1038.
[30] Sharma M, Basu A R, Nesterenko G V. Temporal Sr-, Nd- and Pb-isotopic variations in the Siberian flood basalts: Implications for the plume-source characteristics [J]. Earth and Planetary Science Letters, 1992, 113(3): 365-381. doi: 10.1016/0012-821X(92)90139-M
[31] Huh Y, Panteleyev G, Babich D, et al. The fluvial geochemistry of the rivers of Eastern Siberia: II. Tributaries of the Lena, Omoloy, Yana, Indigirka, Kolyma, and Anadyr draining the collisional/accretionary zone of the Verkhoyansk and Cherskiy ranges [J]. Geochimica et Cosmochimica Acta, 1998, 62(12): 2053-2075. doi: 10.1016/S0016-7037(98)00127-6
[32] Viscosi-Shirley C, Mammone K, Pisias N, et al. Clay mineralogy and multi-element chemistry of surface sediments on the Siberian-Arctic shelf: implications for sediment provenance and grain size sorting [J]. Continental Shelf Research, 2003, 23(11-13): 1175-1200. doi: 10.1016/S0278-4343(03)00091-8
[33] Fagel N, Not C, Gueibe J, et al. Late Quaternary evolution of sediment provenances in the Central Arctic Ocean: mineral assemblage, trace element composition and Nd and Pb isotope fingerprints of detrital fraction from the Northern Mendeleev Ridge [J]. Quaternary Science Reviews, 2014, 92: 140-154. doi: 10.1016/j.quascirev.2013.12.011
[34] Fujita K, Stone D B, Layer P W, et al. Cooperative program helps decipher tectonics of northeastern Russia [J]. Eos, Transactions American Geophysical Union, 1997, 78(24): 245-253.
[35] Harbert W, Frei L, Jarrard R, et al. Palaeomagnetic and plate-tectonic constrains on the evolution of the Alaskan–eastern Siberian Arctic[M]//Grantz A, Johnson G L, Sweeney J F. The Arctic Ocean Region. The Geology of North America, L. Colorado: Geological Society of America, 1990: 567-592.
[36] Nghiem S V, Rigor I G, Perovich D K, et al. Rapid reduction of Arctic perennial sea ice [J]. Geophysical Research Letters, 2007, 34(19): L19504. doi: 10.1029/2007GL031138
[37] Johannessen O M, Bengtsson L, Miles M W, et al. Arctic climate change: observed and modelled temperature and sea-ice variability [J]. Tellus A: Dynamic Meteorology and Oceanography, 2004, 56(4): 328-341. doi: 10.3402/tellusa.v56i4.14418
[38] Kolatschek J, Eicken H, Alexandrov V Y, et al. The sea-ice cover of the Arctic Ocean and the Eurasian marginal seas: A brief overview of present day patterns and variability[C]//Berichte zur Polarforschung 212, Alfred-Wegener Institut für Polar und Meeresforschung. Bremerhaven, Germany: A-W-I, Columbusstrasse, 1996: 1-324.
[39] Razumov S O. Permafrost as a factor of the dynamics of the coastal zone of the Russian East Arctic Seas [J]. Oceanology, 2010, 50(2): 262-267. doi: 10.1134/S0001437010020116
[40] Spielhagen R F, Bonani G, Eisenhauer A, et al. Arctic Ocean evidence for late Quaternary initiation of northern Eurasian ice sheets [J]. Geology, 1997, 25(9): 783-786. doi: 10.1130/0091-7613(1997)025<0783:AOEFLQ>2.3.CO;2
[41] Jones E P, Anderson L G, Swift J H. Distribution of Atlantic and Pacific waters in the upper Arctic Ocean: implications for circulation [J]. Geophysical Research Letters, 1998, 25(6): 765-768. doi: 10.1029/98GL00464
[42] Darby D A, Bischof J F. A Holocene record of changing arctic ocean ice drift analogous to the effects of the arctic oscillation [J]. Paleoceanography, 2004, 19(1): 1-9.
[43] Darby D A, Ortiz J D, Grosch C E, et al. 1, 500-year cycle in the Arctic Oscillation identified in Holocene Arctic sea-ice drift [J]. Nature Geoscience, 2012, 5(12): 897-900. doi: 10.1038/ngeo1629
[44] Romanovskii N N, Hubberten H W, Gavrilov A V, et al. Permafrost of the east Siberian Arctic shelf and coastal lowlands [J]. Quaternary Science Reviews, 2004, 23(11-13): 1359-1369. doi: 10.1016/j.quascirev.2003.12.014
[45] Bayon G, German C R, Boella R M, et al. An improved method for extracting marine sediment fractions and its application to Sr and Nd isotopic analysis [J]. Chemical Geology, 2002, 187(3-4): 179-199. doi: 10.1016/S0009-2541(01)00416-8
[46] Gutjahr M, Frank M, Stirling C H, et al. Reliable extraction of a deepwater trace metal isotope signal from Fe-Mn oxyhydroxide coatings of marine sediments [J]. Chemical Geology, 2007, 242(3-4): 351-370. doi: 10.1016/j.chemgeo.2007.03.021
[47] Byrne R H, Sholkovitz E R. Marine chemistry and geochemistry of the lanthanides [J]. Handbook on the Physics and Chemistry of Rare Earths, 1996, 23: 497-593.
[48] Kassens H, Bauch H A, Dmitrenko I A, et al. Land-Ocean Systems in the Siberian Arctic: Dynamics and History[M]. Berlin Heidelberg: Springer, 1999: 199-222.
[49] Gaillardet J, Dupré B, Allègre C J. Geochemistry of large river suspended sediments: Silicate weathering or recycling tracer? [J]. Geochimica et Cosmochimica Acta, 1999, 63(23-24): 4037-4051. doi: 10.1016/S0016-7037(99)00307-5
[50] Bayon G, Toucanne S, Skonieczny C, et al. Rare earth elements and neodymium isotopes in world river sediments revisited [J]. Geochimica et Cosmochimica Acta, 2015, 170: 17-38. doi: 10.1016/j.gca.2015.08.001
[51] Sun X Q, Liu S F, Li J R, et al. Major and trace element compositions of surface sediments from the lower Bengal Fan: Implications for provenance discrimination and sedimentary environment [J]. Journal of Asian Earth Sciences, 2019, 184: 104000. doi: 10.1016/j.jseaes.2019.104000
[52] Taylor S R, McLennan S M. The composition and evolution of the continental crust: rare earth element evidence from sedimentary rocks [J]. Philosophical Transactions of the Royal Society A: Mathematical, Physical and Engineering Sciences, 1981, 301(1461): 381-399.
[53] 霍文冕, 曾宪章, 田伟之, 等. 北极楚科奇海近代沉积物稀土元素地球化学特征初探[J]. 极地研究, 2003, 15(1):21-27 HUO Wenmian, ZENG Xianzhang, TIAN Weizhi, et al. The Rees geochemistry of Chukchi sea sediment core [J]. Advances in Polar Science, 2003, 15(1): 21-27.
[54] Dong L S, Polyak L, Liu Y G, et al. Isotopic fingerprints of ice‐rafted debris offer new constraints on middle to late quaternary arctic circulation and glacial history [J]. Geochemistry, Geophysics, Geosystems, 2020, 21(8): e2020GC009019.
[55] 董林森, 石学法, 刘焱光, 等. 北冰洋西部表层沉积物矿物学特征及其物质来源[J]. 极地研究, 2014, 26(1):58-70 DONG Linsen, SHI Xuefa, LIU Yanguang, et al. Minerals in surface sediments in the western arctic ocean and their sources [J]. Chinese Journal of Polar Research, 2014, 26(1): 58-70.
[56] Stein R, Macdonald R W. The organic carbon cycle in the Arctic Ocean[M]. Berlin Heidelberg: Springer, 2004: 315-322.
[57] Silverberg N. Sedimentology of the surface sediments of the east siberian and laptev seas[D]. Doctoral Dissertation of University of Washington, 1972.
[58] Kalinenko V V. Clay minerals in sediments of the arctic seas [J]. Lithology and Mineral Resources, 2001, 36(4): 362-372. doi: 10.1023/A:1010414305264
[59] 李秋玲, 乔淑卿, 石学法, 等. 北极东西伯利亚陆架沉积物源: 来自黏土矿物和化学元素的证据[J]. 海洋学报, 2021, 43(3):76-89 LI Qiuling, QIAO Shuqing, SHI Xuefa, et al. Sediment provenance of the East Siberian Arctic Shelf: evidence from clay minerals and chemical elements [J]. Acta Oceanologica Sinica, 2021, 43(3): 76-89.
[60] Macdonald R W, Kuzyk Z Z A, Johannessen S C. The vulnerability of Arctic shelf sediments to climate change [J]. Environmental Reviews, 2015, 23(4): 461-479. doi: 10.1139/er-2015-0040
[61] Pisias N G, Murray R W, Scudder R P. Multivariate statistical analysis and partitioning of sedimentary geochemical data sets: General principles and specific MATLAB scripts [J]. Geochemistry, Geophysics, Geosystems, 2013, 14(10): 4015-4020. doi: 10.1002/ggge.20247
[62] Anderson C H, Murray R W, Dunlea A G, et al. Aeolian delivery to Ulleung basin, Korea (Japan Sea), during development of the East Asian Monsoon through the last 12 Ma [J]. Geological Magazine, 2019, 157(5): 806-817.
[63] Anderson C H, Murray R W, Dunlea A G, et al. Climatically driven changes in the supply of Terrigenous sediment to the East China Sea [J]. Geochemistry, Geophysics, Geosystems, 2018, 19(8): 2463-2477. doi: 10.1029/2017GC007339
[64] Dunlea A G, Murray R W, Ramos D P S, et al. Cenozoic global cooling and increased seawater Mg/Ca via reduced reverse weathering [J]. Nature Communications, 2017, 8(1): 844. doi: 10.1038/s41467-017-00853-5
[65] Laskar J P, Robutel F, Joutel M, et al. A long-term numerical solution for the insolation quantities of the Earth [J]. Astronomy & Astrophysics, 2004, 428(1): 261-285.
[66] Spratt R M, Lisiecki L E. A Late Pleistocene sea level stack [J]. Climate of the Past, 2016, 12(4): 1079-1092. doi: 10.5194/cp-12-1079-2016
[67] North Greenland Ice Core Project members. High-resolution record of Northern Hemisphere climate extending into the last interglacial period [J]. Nature, 2004, 431(7005): 147-151. doi: 10.1038/nature02805
[68] Rudenko О, Taldenkova Е, Ovsepyan Y, et al. A multiproxy-based reconstruction of the mid- to late Holocene paleoenvironment in the Laptev Sea off the Lena River Delta (Siberian Arctic) [J]. Palaeogeography, Palaeoclimatology, Palaeoecology, 2020, 540: 109502. doi: 10.1016/j.palaeo.2019.109502
[69] Bauch H A, Mueller-Lupp T, Taldenkova E, et al. Chronology of the Holocene transgression at the North Siberian margin [J]. Global and Planetary Change, 2001, 31(1-4): 125-139. doi: 10.1016/S0921-8181(01)00116-3
[70] Klemann V, Heim B, Bauch H A, et al. Sea-level evolution of the Laptev Sea and the East Siberian Sea since the last glacial maximum [J]. Arktos, 2015, 1(1): 1. doi: 10.1007/s41063-015-0004-x
[71] Hörner T, Stein R, Fahl K, et al. Post-glacial variability of sea ice cover, river run-off and biological production in the western Laptev Sea (Arctic Ocean)-A high-resolution biomarker study [J]. Quaternary Science Reviews, 2016, 143: 133-149. doi: 10.1016/j.quascirev.2016.04.011
[72] Wagner A, Lohmann G, Prange M. Arctic river discharge trends since 7ka BP [J]. Global and Planetary Change, 2011, 79(1-2): 48-60. doi: 10.1016/j.gloplacha.2011.07.006
[73] Yamamoto M, Nam S I, Polyak L, et al. Holocene dynamics in the Bering Strait inflow to the Arctic and the Beaufort Gyre circulation based on sedimentary records from the Chukchi Sea [J]. Climate of the Past, 2017, 13(9): 1111-1127. doi: 10.5194/cp-13-1111-2017
[74] Wanner H, Beer J, Bütikofer J, et al. Mid- to Late Holocene climate change: an overview [J]. Quaternary Science Reviews, 2008, 27(19-20): 1791-1828. doi: 10.1016/j.quascirev.2008.06.013
[75] Biskaborn B K, Subetto D A, Savelieva L A, et al. Late Quaternary vegetation and lake system dynamics in north-eastern Siberia: Implications for seasonal climate variability [J]. Quaternary Science Reviews, 2016, 147: 406-421. doi: 10.1016/j.quascirev.2015.08.014


计量
- 文章访问数: 21445
- HTML全文浏览量: 1060
- PDF下载量: 158