Magnetostratigraphy of core XT06 and Quaternary sedimentary dynamics of the deep-sea deposits in the West Philippian Basin
-
摘要: 菲律宾海是西太平洋典型的风尘汇集区,也是南极底层水影响的远端地区。由于水深较大等原因,这一热点地区沉积物的古环境研究尚未全面展开。本文对菲律宾海中部XT06孔沉积物开展了磁性地层和粒度测试工作,分析了XT06孔沉积记录的年代学特征和沉积过程,初步探讨了区域沉积演化的控制因素与古环境意义。结果表明:(1)通过系统交变退磁实验,XT06孔沉积物可以辨识出6个磁极性区间,分别对应于布容正极性时、加拉米洛亚极性时、奥杜维尔正极性时和松山负极性时。通过与国际标准磁极性序列对比,发现XT06孔的沉积速率由快转慢,指示了在1.0~1.5 Ma曾发生过一次明显的沉积转折,可能代表了区域深海沉积中心的迁移,与东亚-西太平洋构造活动等密切相关。(2)XT06沉积物属于典型的远洋悬浮体,反映了较弱的沉积动力环境。通过多种粒度分析方法的交叉对比和验证,发现XT06孔沉积物包含粗、细两个互为消长的动力学组分,指示了较为稳定的深海沉积环境。通过对比其他古环境指标,我们推测在构造时间尺度上,亚洲内陆干旱化导致的粉尘输入增加可能是控制XT06孔沉积物粒度逐步变细的主要因素;而在更高时间分辨率上XT06孔沉积物粒度粗细变化可能主要受深海环流强度的控制作用,体现了冰期南极深/底层水团影响减弱、而间冰期增强的区域特征。本文结果展现了菲律宾海中部沉积过程的一些关键特征,揭示了菲律宾海沉积记录在深入研究地球系统多圈层耦合过程中的巨大潜力。Abstract: The Philippine Sea, as a key area in the Western Pacific Warm Pool, is a characterized by wind-dust deposition. Sedimentary and paleo-environmental researches are relatively rare in the region due to large water depth and other reasons. In this paper, magnetic stratigraphy and sediment grain size data from the gravity core XT06, which is located in the central Philippine Sea, are used as the raw materials to establish the chronological sequence and to reveal the sedimentary processes. Upon the basis, the controlling factors on regional sediment distribution pattern and paleoenvironmental processes are discussed. The results suggest that: (1) After alternative demagnetization, the core XT06 can be subdivided into 6 magnetic polarity intervals, corresponding to the Brunhes (C1n) chron, the Jaramillo (C1r.1n) subchron, the Olduvia (C2n) chron, and the successive polarity-reversed intervals of the Matuyama chron respectively. After calibrated with the geomagnetic polarity timescale (GPTS), it is found that the sedimentation rate of core XT06 had an obvious change from fast to slow at 1.0~1.5 Ma, indicating a regional deep-water environment transition event, probably controlled by the tectonic activities related to the interaction between the Asian continent and the Pacific plate. (2) The core sediments are dominated by pelagic suspended matters, reflecting a weak sedimentary dynamic environment. Grain-size data further suggest that there occur two, coarse and fine, dynamic components in a compensated relationship, indicating a relatively stable dynamic environment. By comparisons with the proxies of global ice volume, deep-sea ventilation, and Inner Asian aridification, we proposed that regional tectonic activities with enhanced aridification and increased flux of aeolian input are the major factors to control the regional sedimentation on tectonic timescales, and the bottom-water circulation is the dominating factor on glacial-interglacial timescales. This paper presented some key sedimentary features for the central part of the Philippine Sea which may contribute much to the in-depth study of the coupling process of some key Earth systems.
-
Keywords:
- magnetostratigraphy /
- sediment grain size /
- abyssal environment /
- Quaternary /
- the Philippian Sea
-
东亚大陆边缘河流沉积物源汇过程是地球科学领域的重大科学问题[1],中国东部海域浅海陆架沉积地层记录了该大型源汇体系的演化过程,是重建新生代亚洲大陆构造隆升、季风演化以及气候变化等过程的重要信息载体[2-3],同时,浅海陆架沉积记录对全球海平面变化也具有重要指示[4-6]。
黄海是一个典型的半封闭型陆架海,周边河流主要包括中国大陆的长江、淮河、黄河以及朝鲜半岛汉江、锦江等河流,接受上述河流的大量陆源碎屑物质[7]。受黄海暖流、沿岸流等海流以及冷水团的控制,在北黄海西部、南黄海中部、济州岛西南和南黄海东南部形成了多个泥质区[8]。其中,南黄海中部泥质区的研究成果最为丰富。在物源研究方面,利用矿物学和地球化学方面的证据,多数学者认为南黄海中部泥质区沉积物主要由黄河和长江供应[7,9-12]。其他潜在来源是局部小河流,如淮河等,其年入海沉积物通量(约76 Mt/a)相对较低,对中部泥质区的贡献可能很小[13]。发源于朝鲜半岛的主要河流,如汉江、锦江等,向黄海东部输送沉积物通量仅为18 Mt/a[13],对中部泥质区沉积物贡献微不足道[7]。此外,由于黄河和长江巨量泥沙的稀释,风尘对南黄海沉积的影响几乎可忽略不计[14]。利用钻孔沉积物资料,Yao等人研究表明,南黄海0.88 Ma 以来物质来源主要受黄河控制[15]。CSDP-1孔的碎屑锆石U-Pb年龄分析显示0.78 Ma中部泥质区才开始有黄河源的物质,并且自此黄河成为钻孔区主要物质来源[16]。
多数物源研究成果以细粒沉积物为研究对象,主要分析了末次间冰期以来短时间尺度的物源变化。虽然已经形成南黄海中部泥质区为黄河源和长江源物质混合区的认识,但二者占主导的区域分界还不够清晰,地质历史时期不同河流对南黄海海底沉积物影响程度的认识还存在较多分歧。
锆石具有很强的抗风化能力,广泛分布于河流、湖泊和三角洲各种沉积环境的陆源碎屑沉积物中。通过多个样品的年龄图谱相互比较,并分析整个流域的构造运动历史及沉积环境特征,可以很好地追踪沉积物的输运轨迹[17-18]。在过去20年里,单颗粒矿物原位分析技术的发展使得碎屑锆石U-Pb年代学方法成为沉积物物源研究的标准方法之一[19-21]。本文以南黄海中部泥质区南部及泥质区外缘4个表层沉积物样品和5个钻孔沉积物样品的碎屑锆石U-Pb年龄进行分析,为南黄海中部泥质区物源分界、地质历史时期物源及沉积环境演化研究提供新证据。
1. 地质背景
南黄海位于中国大陆和朝鲜半岛之间(图1),平均水深46 m,最深处位于济州岛北侧,深达140 m[22]。南黄海海底包括鲁南岸坡及海州湾阶地平原、苏北岸外舌状台地、中部平原、黄海槽洼地、朝鲜半岛岸外台地和济州岛西部砂脊六大地形单元。黄海槽洼地位于南黄海中部,靠近朝鲜半岛一侧,北浅南深,海槽地形东陡西缓[22],最深处在100 m以上。前人研究认为,黄海槽由末次冰期水流运动形成,为全新世海水入侵的主要通道[23]。
南黄海现代海洋流系主要包括黄海暖流、沿岸流等。南黄海中部的黄海冷水团是一个低能环境,为泥质沉积分布区;在南黄海的东部、西南部海区则发育强潮流,形成了潮流沙脊[9]。通过对南黄海打穿第四系的CSDP-2孔研究,发现南黄海在1.66 Ma左右出现第一次海侵,l.66~0.83 Ma南黄海地区以河流相沉积为主,有3次较弱的海侵,直到0.83 Ma以来海侵强度才与现今接近[9,26]。浙闽隆起的进一步沉降使得南黄海中部隆起区在间冰期高海平面时期的海洋环境基本接近现今环境。南黄海西部陆架在MIS5发育范围比现今更广[9]。
南黄海周边河流主要有中国大陆一侧的黄河、长江和朝鲜半岛一侧的汉江、锦江、蟾津江等河流。长江是我国第一长河,流域纬向跨度大,自西向东流经昌都地块、松潘-甘孜褶皱带、秦岭-大别构造带、扬子地块和华夏地块[27],地层出露复杂,元古界至第四系均有分布,包括大面积的碳酸盐岩、陆源碎屑岩和中酸性侵入岩、片岩和片麻岩等[28]。通过大量碎屑锆石U-Pb年龄分析,发现长江碎屑沉积物主要有6组峰:<65、200~300、400~550、700~1000、1800~2000和2400~2600 Ma,其中200~300和700~1000 Ma为主要的两组峰[29]。黄河是我国第二长河,以年输沙量巨大著称,流经松潘-甘孜造山带、秦岭造山带、祁连造山带和华北陆块等多个构造单元[30],碎屑锆石U-Pb年龄结果显示,黄河碎屑沉积物主要有6组峰:200~350、350~500、700~1000、1000~1800、1800~2000和2000~2600 Ma,其中200~350、350~500、1800~2000和2000~2600 Ma为主要的四组峰[31-32]。朝鲜半岛一侧的河流主要为汉江、锦江、蟾津江等中小河流。锆石U-Pb年龄谱显示半岛东西两侧差异明显,年龄范围从早新生代到晚太古代,西部以古生代至新元古代锆石为主,东部以古元古代锆石为主[33]。
2. 材料及方法
2.1 样品
2018年4—5月,青岛海洋地质研究所在南黄海泥质区附近获取表层样300个站位,每个站位用箱式取样器取海底表层20 cm以内样品2袋。SYS90-1A孔由青岛海洋地质研究所在2017年6月利用“明源1001”轮实施,地理坐标为33°48′49″N、123°43′58″E,水深约69.3 m,钻孔深90.1 m,有效样品86管,岩芯总长83.8 m,平均取芯率93.0%。
对SYS90-1A孔全孔进行了连续低场磁化率测量和古地磁交变场退磁测定,结合钻孔上部AMS14C和光释光测年结果,建立了钻孔的年代框架①(图2)。SYS90-1A孔底界年龄约为1.0 Ma,布容正极性时和松山负极性时倒转边界(0.78 Ma)大约位于73.78 m。上部年龄数据较多(图2),根据沉积速率推测晚更新世底界埋深为21.50 m。上部15 m沉积物记录了MIS4、MIS3早期和MIS1的沉积,缺失MIS3晚期至MIS2早期的沉积。
![]()
2.2 测试方法
根据岩芯描述及沉积学分析,结合年代学结果,对SYS90-1A孔进行碎屑锆石U-Pb定年分析,共选取5个样品。钻孔岩芯在69.48~69.74 m层位见风化严重的贝壳碎屑,岩性变化明显(图2),推测彼时沉积环境可能发生改变。在层位上下各取1个样品,根据泥质区分布,共选取4个表层沉积物样品进行碎屑锆石U-Pb定年分析。9个沉积物样品位置见图1,埋深和岩性等信息见表1,锆石挑选、制靶、反射光、透射光和阴极荧光(CL)拍摄和测试均在南京宏创地质勘查技术服务有限公司完成。
表 1 沉积物样品位置及岩性信息Table 1. Samples location and lithology information序号 样品编号 位置 埋深/m 岩性 备注 1 SYB80 33°27′15″N、 123°17′46″E 0.20 粉砂 表层样 2 SYB86 33°05′40″N、124°24′17″E 0.20 粉砂 表层样 3 SYB198 33°05′40″N、124°44′02″E 0.20 粉砂 表层样 4 SYB256 33°05′40″N、124°03′48″E 0.20 粉砂 表层样 5 SYS90-1A-B709 33°48′49″N、 123°43′58″E 34.88 粉砂 钻孔样 6 SYS90-1A-C717 33°48′49″N、 123°43′58″E 56.20 细砂 钻孔样 7 SYS90-1A-D235 33°48′49″N、 123°43′58″E 68.88 粉砂 钻孔样 8 SYS90-1A-D275 33°48′49″N、123°43′58″E 69.68 粉砂 钻孔样 9 SYS90-1A-D945 33°48′49″N、123°43′58″E 85.66 粉砂 钻孔样 首先利用常规的浮选和电磁法分离出锆石,随机选出250粒进行环氧树脂制靶,并拍摄显微镜照相(透射光与反射光),然后在场发射扫描电镜实验室进行阴极荧光拍摄,发射扫描电镜型号为TESCAN MIRA3,探头由TESCAN公司提供。
锆石U-Pb定年使用激光剥蚀-电感耦合等离子体质谱仪(LA-ICPMS)完成。激光剥蚀平台采用Resolution SE型193 nm深紫外激光剥蚀进样系统(Applied Spectra,美国),配备S155型双体积样品池。质谱仪采用Agilent7900型电感耦合等离子体质谱仪(Agilent,美国)。详细的调谐参数见Thompson等的文献[35],采用束斑直径50 μm、剥蚀频率10 Hz、能量密度3.5 J/cm2、扫描速度3 μm/s的激光参数剥蚀玻璃标样NIST 612,调节气流以获得高的信号强度。选用100 μm束斑线扫玻璃标样NIST 610对待测元素进行P/A调谐。测量质量数29Si、31P、45Sc、49Ti、56Fe、89Y、91Zr、93Nb、139La、140Ce、141Pr、146Nd、147Sm、151Eu、157Gd、159Tb、163Dy、165Ho、166Er、169Tm、173Yb、175Lu、178Hf、181Ta、202Hg、204Pb、206Pb、207Pb、208Pb、232Th、235U、238U,总的扫描时间约为0.23 s。锆石样品固定在环氧树脂靶上,抛光后在超纯水中超声清洗,分析前用分析级甲醇擦拭样品表面。采用5个激光脉冲对每个剥蚀区域进行预剥蚀(剥蚀深度约0.3 μm),以去除样品表面可能的污染。在束斑直径30 μm、剥蚀频率5 Hz、能量密度2 J/cm2的激光条件下分析样品。数据处理采用Iolite程序[36],锆石91500作为校正标样,GJ-1作为监测标样,每隔10~12个样品点分析2个91500标样及1个GJ-1标样。通常采集20 s的气体空白,35~40 s的信号区间进行数据处理,按指数方程进行深度分馏校正[36]。以玻璃标样NIST 610作为外标,91Zr作为内标计算微量元素含量。本次实验过程中测定的91500(1061.5±3.2 Ma, 2σ)、GJ-1 (604±6 Ma, 2σ)年龄在不确定范围内与推荐值一致。锆石年龄选择按照如下原则:对于<1000 Ma的年龄选取206Pb/238U计算值,对于>1000 Ma的年龄选取207Pb/206Pb计算值[37]。
3. 结果与讨论
3.1 碎屑锆石形态及U-Pb年龄
3.1.1 锆石形态
从研究样品锆石CL图像可以看出,碎屑锆石粒径变化较大,范围为20~200 μm。磨圆度从圆形到棱角均有分布,以次圆形和次棱角居多。研究样品中部分锆石具有清晰的岩浆岩振荡环带,如图3中C717-70、S256-112、S256-62、D275-111和S80-91,其中后两者可能为低温条件下微量元素的扩散速度慢而形成。样品中也有部分变质锆石,如无分带的D235-94和具有变质增生边的C717-52和D945-68两个样品(图3)。
3.1.2 碎屑锆石U-Pb年龄特征
锆石Th、U含量及Th/U值能够大致反映锆石的成因[38]。通常认为,岩浆锆石中Th、U含量较高且Th/U值较大,一般>0.3,而变质锆石的Th、U含量相对较低,一般<0.1。用于本文研究的85%以上的沉积物锆石Th/U>0.3,仅少数的Th/U<0.1(图4),说明大多数锆石为岩浆成因,能够反映其结晶年龄。
![]() 图 4 SYS90-1A孔沉积物和表层沉积物碎屑锆石Th/U值Figure 4. Plot of Th/U ratios versus U-Pb ages of detrital zircons from SYS90-1A borehole and surface sediments of South Yellow Sea
图 4 SYS90-1A孔沉积物和表层沉积物碎屑锆石Th/U值Figure 4. Plot of Th/U ratios versus U-Pb ages of detrital zircons from SYS90-1A borehole and surface sediments of South Yellow Sea南黄海中部泥质区南部表层沉积物和SYS90-1A孔沉积物碎屑锆石U-Pb年龄谐和图如图5所示,各样品中年龄谐和锆石数量均超过90%,文中所用沉积物锆石年龄谐和度均>90%。9个沉积物样品锆石U-Pb年龄测试结果显示,根据年龄分布大致可分为两组:第一组表现出<100 Ma、100~300、300~500、600~1100、1800~2000和2300~2700 Ma等6个年龄区间,样品包括表层沉积物SYB86、SYB198、SYB256和钻孔沉积物SYS90-1A-C717、SYS90-1A-D235;第二组表现出<200、200~300、350~500、600~1100、1800~2000和2000~2600 Ma等6个主要年龄区间,样品包括表层沉积物SYB80和钻孔沉积物SYS90-1A-B709、SYS90-1A-D275、SYS90-1A-D945。各样品不同年龄区间锆石比例见表2和表3。
![]() 图 5 沉积物碎屑锆石U-Pb年龄谐和图Figure 5. Concordia ages of single zircon grains from the samples表 2 第一组样品不同年龄区间锆石比例Table 2. The proportion of zircons in different ages of the first group of samples
图 5 沉积物碎屑锆石U-Pb年龄谐和图Figure 5. Concordia ages of single zircon grains from the samples表 2 第一组样品不同年龄区间锆石比例Table 2. The proportion of zircons in different ages of the first group of samples% 样品编号 <100 Ma 100~300 Ma 300~500 Ma 600~1100 Ma 1300~1500 Ma 1800~2000 Ma 2300~2700 Ma SYS90-1A-C717 1 27 13 27 4 16 12 SYS90-1A-D235 4 26 11 35 2 6 17 SYB86 0 44 11 18 4 18 5 SYB198 3 54 13 21 2 5 2 SYB256 3 33 13 18 3 19 11 表 3 第二组样品不同年龄区间锆石比例Table 3. The proportion of zircons in different ages of the second group of samples% 样品编号 <200 Ma 200~300 Ma 350~500 Ma 600~1100 Ma 1300~1500 Ma 1800~2000 Ma 2000~2600 Ma SYS90-1A-B709 4 21 11 23 6 23 13 SYS90-1A-D275 3 13 12 41 3 16 13 SYS90-1A-D945 2 22 13 26 2 22 15 SYB80 2 21 9 35 4 15 15 3.2 沉积物碎屑锆石年龄物源判别
3.2.1 物源判别
南黄海周边的黄河、长江和朝鲜半岛的汉江、锦江、蟾津江等河流可能为海底沉积物的主要输送通道,本文以上述河流为端元进行物源判别。
首先,利用IsoplotR软件[39]绘制了研究样品与周边河流样品的KDE图(图6),结合各样品不同年龄区间的锆石比例,初步认为表层沉积物SYB86、SYB198、SYB256和钻孔沉积物SYS90-1A-C717、SYS90-1A-D235与长江输送沉积物的锆石U-Pb年龄谱比较相似,以200~300和700~1000 Ma为两组主要年龄,且多数样品含有<65 Ma年龄的锆石颗粒。其中年龄<65 Ma(新生代)的锆石样品占比不高,但明显说明这一组样品与其他样品的差异。长江上游流经的昌都地块和松潘-甘孜褶皱带及下游流经的下扬子板块均出露新生代岩体[40]。
![]() 图 6 研究样品及周边河流沉积物碎屑锆石U-Pb年龄谱Figure 6. U-Pb age spectra of detrital zircon of the study samples and the surrounding river sediments
图 6 研究样品及周边河流沉积物碎屑锆石U-Pb年龄谱Figure 6. U-Pb age spectra of detrital zircon of the study samples and the surrounding river sediments表层沉积物SYB80和钻孔沉积物SYS90-1A-B709、SYS90-1A-D275、SYS90-1A-D945与黄河输送沉积物的锆石U-Pb年龄谱比较相似,以200~300、350~500、600~1100、1800~2000和2000~2600 Ma为主要的年龄峰,年龄峰的增加可能主要是受源区拓展的影响[43]。600~1100 Ma为长江输送沉积物的主要年龄峰。长江流域700~1000 Ma的锆石含量均较高,主要是有大量扬子克拉通和秦岭-大别造山带[44-45]碎屑沉积物输入所致。
研究样品与朝鲜半岛三条河流输送物质的锆石U-Pb年龄谱区别较大,应该不存在物源关系。朝鲜半岛河流锆石U-Pb年龄谱以100~250和1800~2000 Ma两组年龄峰为特征[33],与长江、黄河输送物质的锆石U-Pb年龄谱区别明显。
Vermeesch研究认为,基于多维定标法(MDS)的碎屑锆石U-Pb年龄相似性量化分析,能够实现年龄分布的有效捕捉,具有很强的实用性[46]。该基于Kolmogorov-Smirnoff(K-S)检验的D值或Kuiper检验的V值,通过特定的算法,将分析结果以点的形式投射在多维空间(二维或三维)中,表示多个样本之间的相对差异,从而显著提升碎屑锆石样品量化分析结果的可视化效果。样品间的差异性(δ)矩阵被函数f转换为一个由直线距离(d)表示的差异矩阵,对于两个样品i和j,其定义如下:
$$ d_{ij} {\text{≈}} f (\sigma_{ij}) $$ (1) 式(1)中:f (δij)是单调递增的转换函数,即i和j样品的差异性越大,多维空间中代表2个样品的点之间的距离也就越大。MDS利用这些差异矩阵将样品点投射在二维或三维空间中绘制成图。
利用IsoplotR软件绘制了研究样品与长江、黄河以及朝鲜半岛汉江、锦江、蟾津江等河流的MDS图(图7)。从图7中可以看出表层沉积物SYB80和钻孔沉积物SYS90-1A-B709、SYS90-1A-D275、SYS90-1A-D945与黄河沉积物的锆石U-Pb年龄比较靠近。表层沉积物SYB86、SYB198、SYB256和钻孔沉积物SYS90-1A-C717、SYS90-1A-D235与长江沉积物的锆石U-Pb年龄比较靠近。所有样品与朝鲜半岛河流相距均较远。韩国学者[33]对黄海表层沉积物锆石U-Pb年龄分析结果显示(图7b),南黄海南部大致以济州岛西缘为界,以西区域沉积物主要来自中国大陆,以东区域沉积物主要来自朝鲜半岛,这一界限大致与南黄海东侧粉砂区与砂质区分界重合。
![]() 图 7 物源分析图a. 研究样品与周边河流样品MDS图,b. 基于K-S检验南黄海南部表层样品物源分析[33],c. 样品位置图。Figure 7. Provenance analysisa:MDS plot of study samples and surrounding river samples; b:Possible provenance discrimination of southeastern Yellow Sea sandy sediments using the Kolmogorov-Smirnoff (K-S) test[33]; c:Sample location.
图 7 物源分析图a. 研究样品与周边河流样品MDS图,b. 基于K-S检验南黄海南部表层样品物源分析[33],c. 样品位置图。Figure 7. Provenance analysisa:MDS plot of study samples and surrounding river samples; b:Possible provenance discrimination of southeastern Yellow Sea sandy sediments using the Kolmogorov-Smirnoff (K-S) test[33]; c:Sample location.3.2.2 沉积动力机制对物源的控制
南黄海中部泥质区的形成受海平面变化、海洋环流、东亚季风、河流改道及河口三角洲形成等多种因素的影响[47-53]。其中,以黄海暖流和两侧沿岸流为主的南黄海环流体系,控制了周边河流输入物质的搬运和沉积[54]。北上的黄海暖流与南下的沿岸流相互作用形成逆时针旋转的气旋型涡旋,称为冷水团或冷涡,对南黄海中部泥质区的形成具有明显的控制作用[55]。诸多学者对黄海暖流的形成时间进行了研究[8,48,56-57],将其进入时间限定在6.9~4.3 kaBP。南黄海柱状沉积物环境磁学参数研究发现,黄海暖流进入以前南黄海沉积物可能主要由黄河供应,之后长江源物质的影响相对增加[58]。黄河入海物质向南搬运的沉积动力主要为冬季风驱动的沿岸流。黄海沿岸流携带的悬浮物质沉积形成南黄海中部泥质区,冬季风增强则加剧沉积物的再悬浮,使得悬浮体浓度增加、粒度变粗。长江入海物质沉积动力主要为夏季风和黄海暖流,二者共同作用于长江冲淡水[59],将其携带的物质向西北输运,沿岸流和黄海暖流共同影响南黄海沉积环境过程[60-61]。苏北-南黄海盆地和现代长江三角洲地层厚度的显著变化反映了河口的迁移,在低海平面时期长江分支河流直接向南黄海中部泥质区输送物质[62]。
通过南黄海中部泥质区表层沉积物碎屑锆石U-Pb年龄分析,发现中部泥质区为一个混合沉积区,在泥质区内部以黄河输送物质占主导,而在泥质区南侧,以长江输送物质居多。黄河和长江输送物质在南黄海中部泥质区的主控分界大致位于33.4°N附近。
3.2.3 晚第四纪沉积环境演化
CSDP-2孔位于南黄海中部隆起区,上部592.00 m 岩芯为松散沉积物,刘健等[9]对其开展了详细的古地磁、沉积相以及第四纪地质研究,可以作为南黄海第四纪地质研究的标准钻孔。钻孔研究结果显示,南黄海在新近纪的剥蚀止于约5.2 Ma,从约5.2 Ma至约1.7 Ma主要发育陆相地层。约1.7 Ma开始浙闽隆起逐渐沉降,至约0.83 Ma南黄海首次接受海侵,发育潮坪-滨岸相与河流相交互地层。约0.83 Ma开始,浙闽隆起沉降加剧,南黄海在间冰期高海平面时期的海洋环境基本接近现今环境。通过与周边QC2 孔[63]、SYS-0702 孔[64]和CSDP-1孔[65-66]等进行对比,发现南黄海西部陆架冷水团沉积在MIS5时期发育范围比现今更为广泛,之后则依次发育河流相、三角洲相、河流相和滨岸-陆架相沉积[9]。
本文利用碎屑锆石U-Pb定年开展物源分析显示,钻孔沉积物可以分为3段:第一段从钻孔底部至69.68 m,沉积物可能来自黄河输送入海物质;第二段从56.20 m到68.88 m,沉积物碎屑锆石U-Pb年龄特征与长江源物质相似度较高,说明该时段长江源物质对研究区贡献较大;第三段从56.20 m至钻孔顶部,沉积物主要为黄河源物质。据古地磁推测,SYS90-1A孔底界年龄约为1.0 Ma。利用天文年代调谐确定56.20 ~68.88 m沉积物具体时代为 0.59~0.71 Ma。
CSDP-1孔的研究结果显示,0.83 Ma开始南黄海发生大规模区域性海侵,南黄海海洋环境与现今接近,在此之前南黄海区域沉积物以长江物质为主[62]。南黄海NHH01孔的研究结果表明[15],0.88 Ma以来才开始出现黄河源物质信号,这与本文的研究结果较为一致,说明黄河源物质大致在0.88~1.0 Ma开始影响南黄海。对照全球海平面变化曲线(图2),0.59~0.71 Ma为低海平面时期,SYS90-1A孔沉积物在该时段主要受长江控制,推测与海平面下降及长江入海口向海推进有关。综合CSDP-1孔、NHH01孔和SYS90-1A孔(钻孔位置见图1)沉积环境对比及物源分析结果,在南黄海地区,受浙闽隆起沉降影响,约1.0~0.83 Ma期间,海水从东南方向以“通道”式进入南黄海,不同区域存在“同期异象”现象。至晚更新世,受全球海平面变化影响,3个钻孔沉积环境变化一致。
4. 结论
南黄海中部泥质区南部锆石U-Pb年龄特征指示沉积物主要由黄河供应,而泥质区以南区域长江源物质占主导。早更新世晚期以来沉积物不同时期物源差异明显,其中,中更新世早期(0.59~0.71 Ma)以长江源物质为主,早更新晚期至中更新世以及中更新世中期以来以黄河源物质为主。上述表层沉积物样品和钻孔沉积物样品碎屑锆石U-Pb年龄分布与朝鲜半岛河流沉积物完全不同。
早期关于南黄海早更新世以来沉积物物源的认识主要以黄河源物质为主,长江源物质对南黄海泥质区沉积物的影响范围不够清晰。本文通过地质浅钻揭示出长江源物质在早更新世晚期和中更新世早期(0.59~0.71 Ma)对南黄海泥质区贡献较大,但难以从区域上识别出这一阶段长江源物质的影响范围。且受取样密度所限,可能对SYS90-1A孔中长江源物质占主导时期的揭示有所遗漏,后期需要开展进一步研究。
致谢:感谢自然资源部国际合作司提供支持。
-
![]()
图 1 研究区概况与站位示意图
绿色线为深层(水深大于4 000 m)环流示意图,据文献[3]绘制。LCDW,南极下层绕极流;AABW,南极底层水。
Figure 1. Location map of the study area and core XT06
Green dash lines in the upper panel represent deep-sea circulation(below 4 000 m); LCDW, lower circumpolar deep water; AABW, Antarctic bottom water.
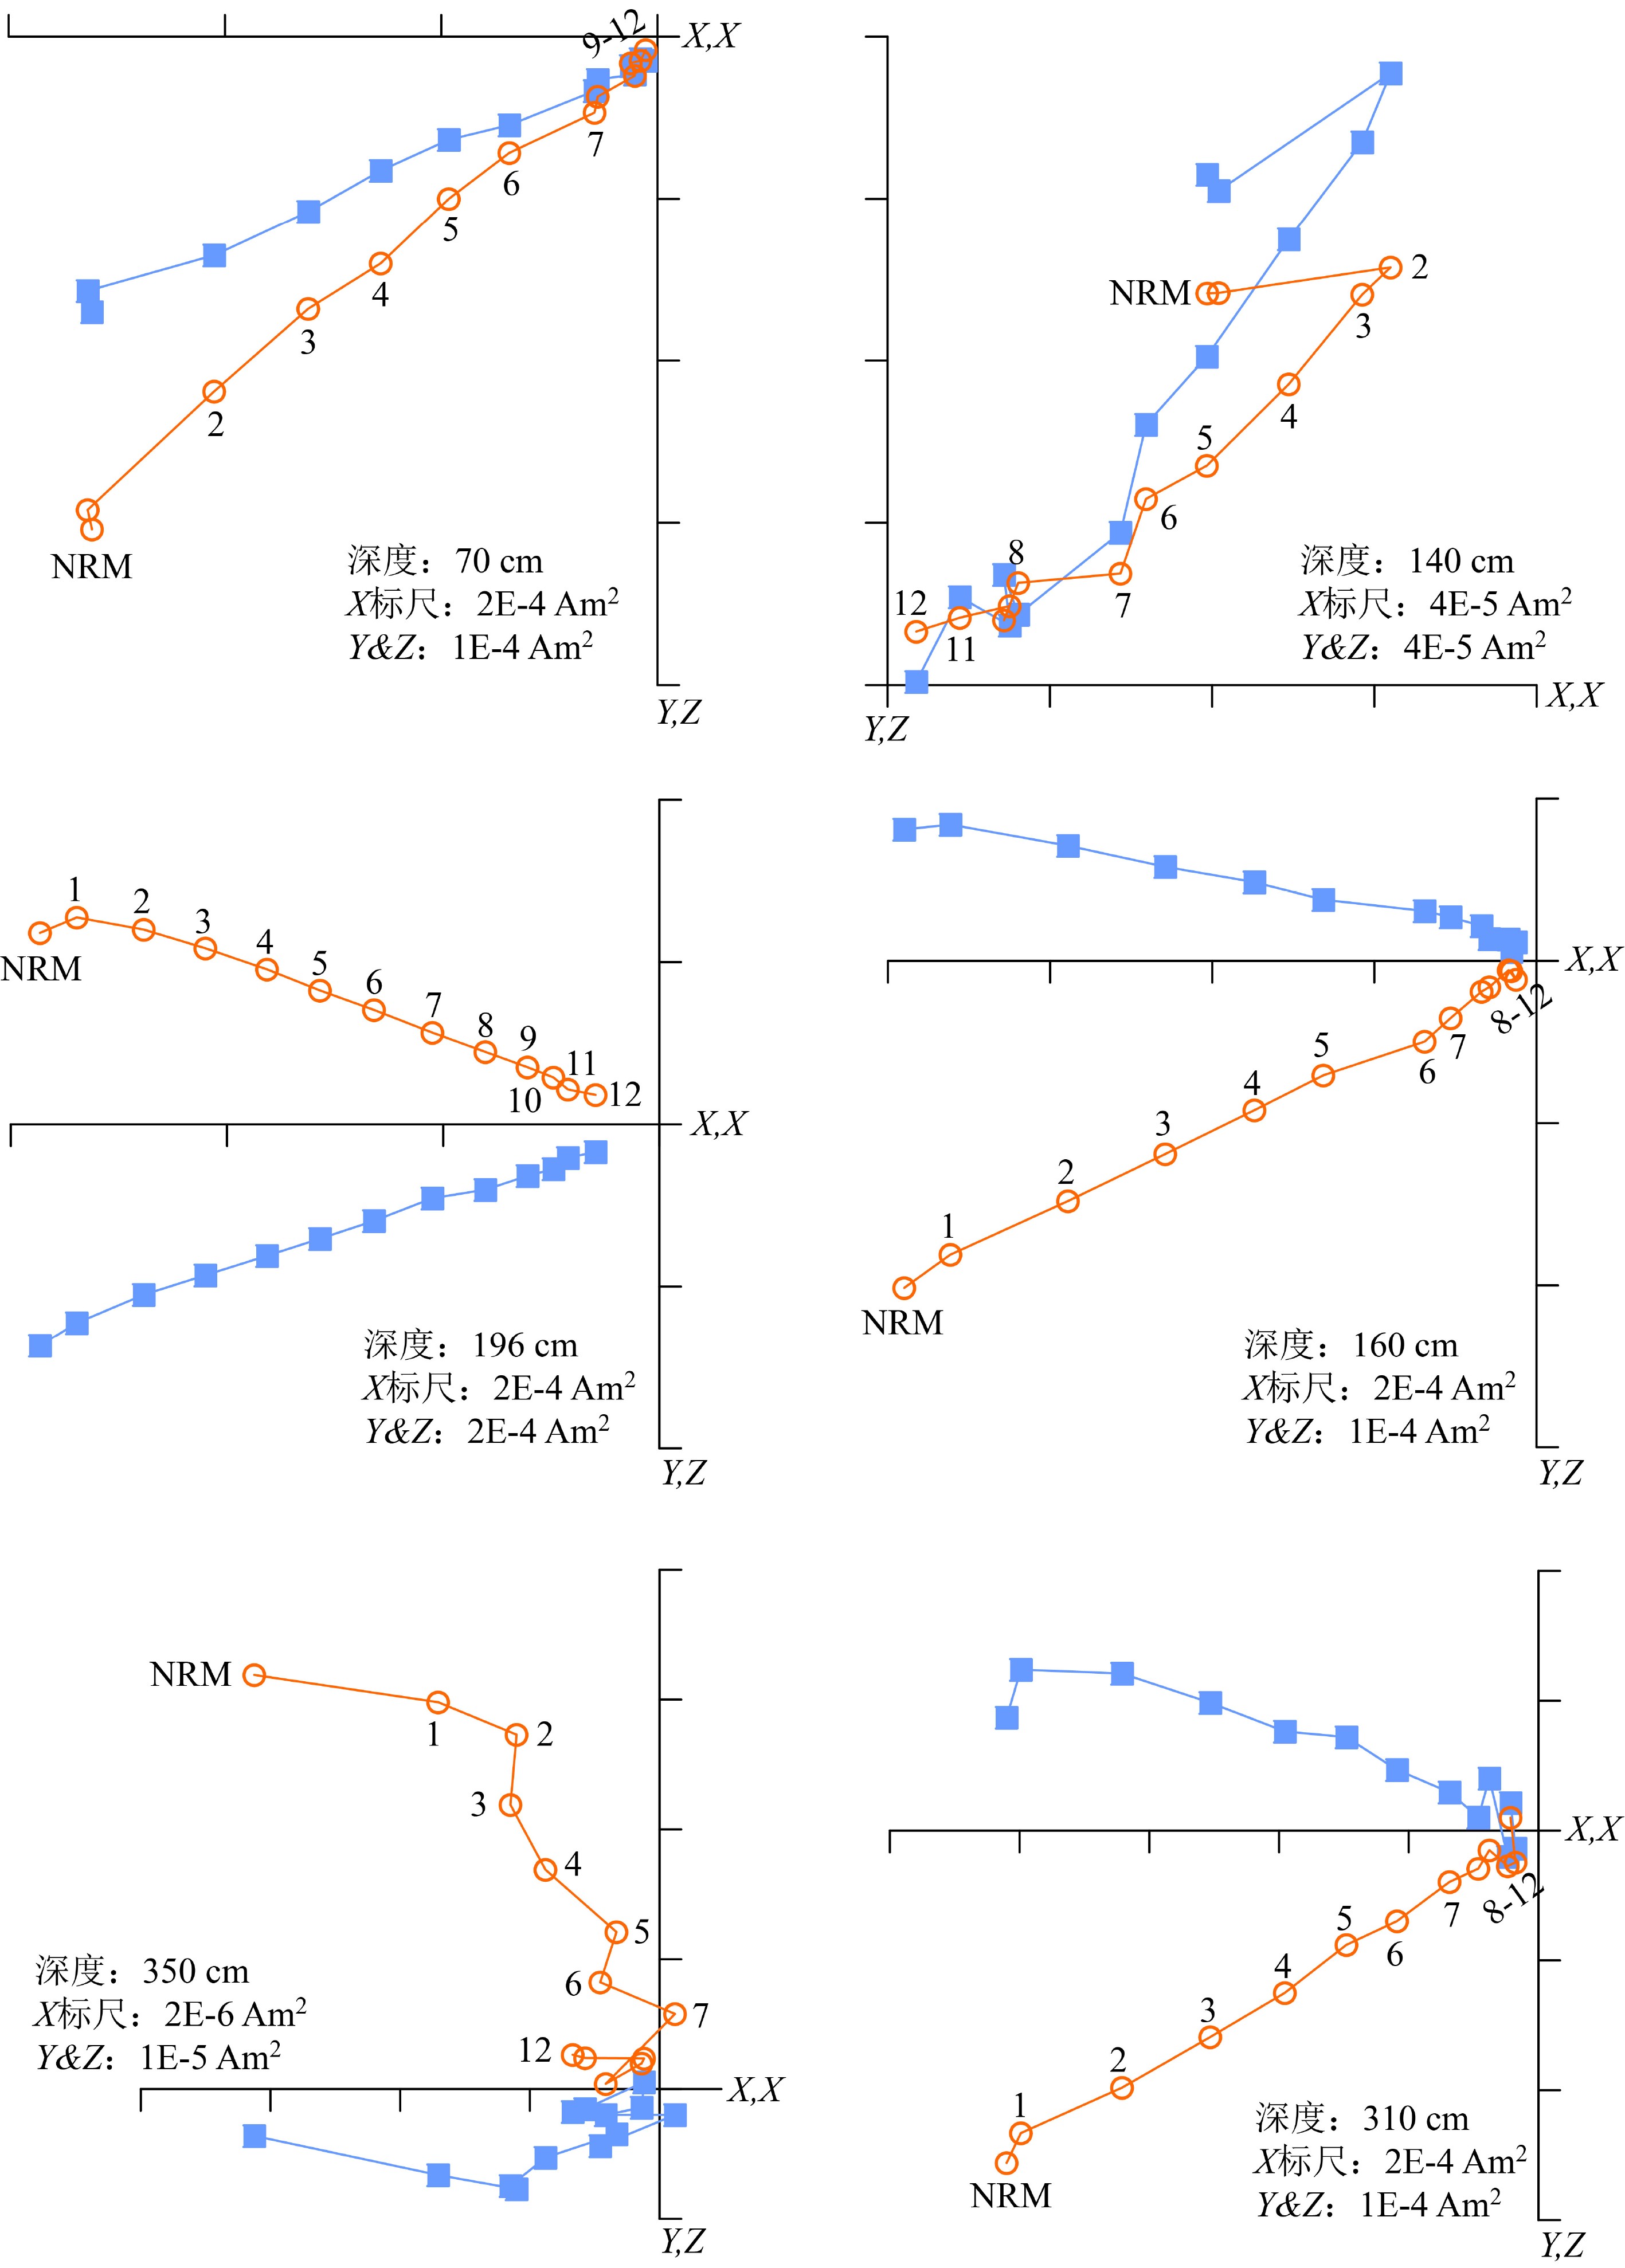
![]()
图 2 XT06站沉积物代表性样品的系统退磁结果正交投影图
空心圆上的数字代表1:5 mT;2:10 mT;3:15 mT;4:20 mT;5:25 mT;6:30 mT;7:40 mT;8:50 mT;9:60 mT;10:70 mT;11:80 mT;12:90 mT。实心方块代表水平投影,空心圆代表垂直投影;NRM为天然剩磁。
Figure 2. Orthogonal diagrams of stepwise alternating-field demagnetization of representative samples
The numbers on open circles are: 1, 5 mT; 2, 10 mT; 3, 15 mT; 4, 20 mT; 5, 25 mT; 6, 30 mT; 7, 40 mT; 8, 50 mT; 9, 60 mT; 10, 70 mT; 11, 80 mT; 12, 90 mT. NRM, natural remanent magnetization; Solid(open)circles(squares)represent the horizontal(vertical)planes.
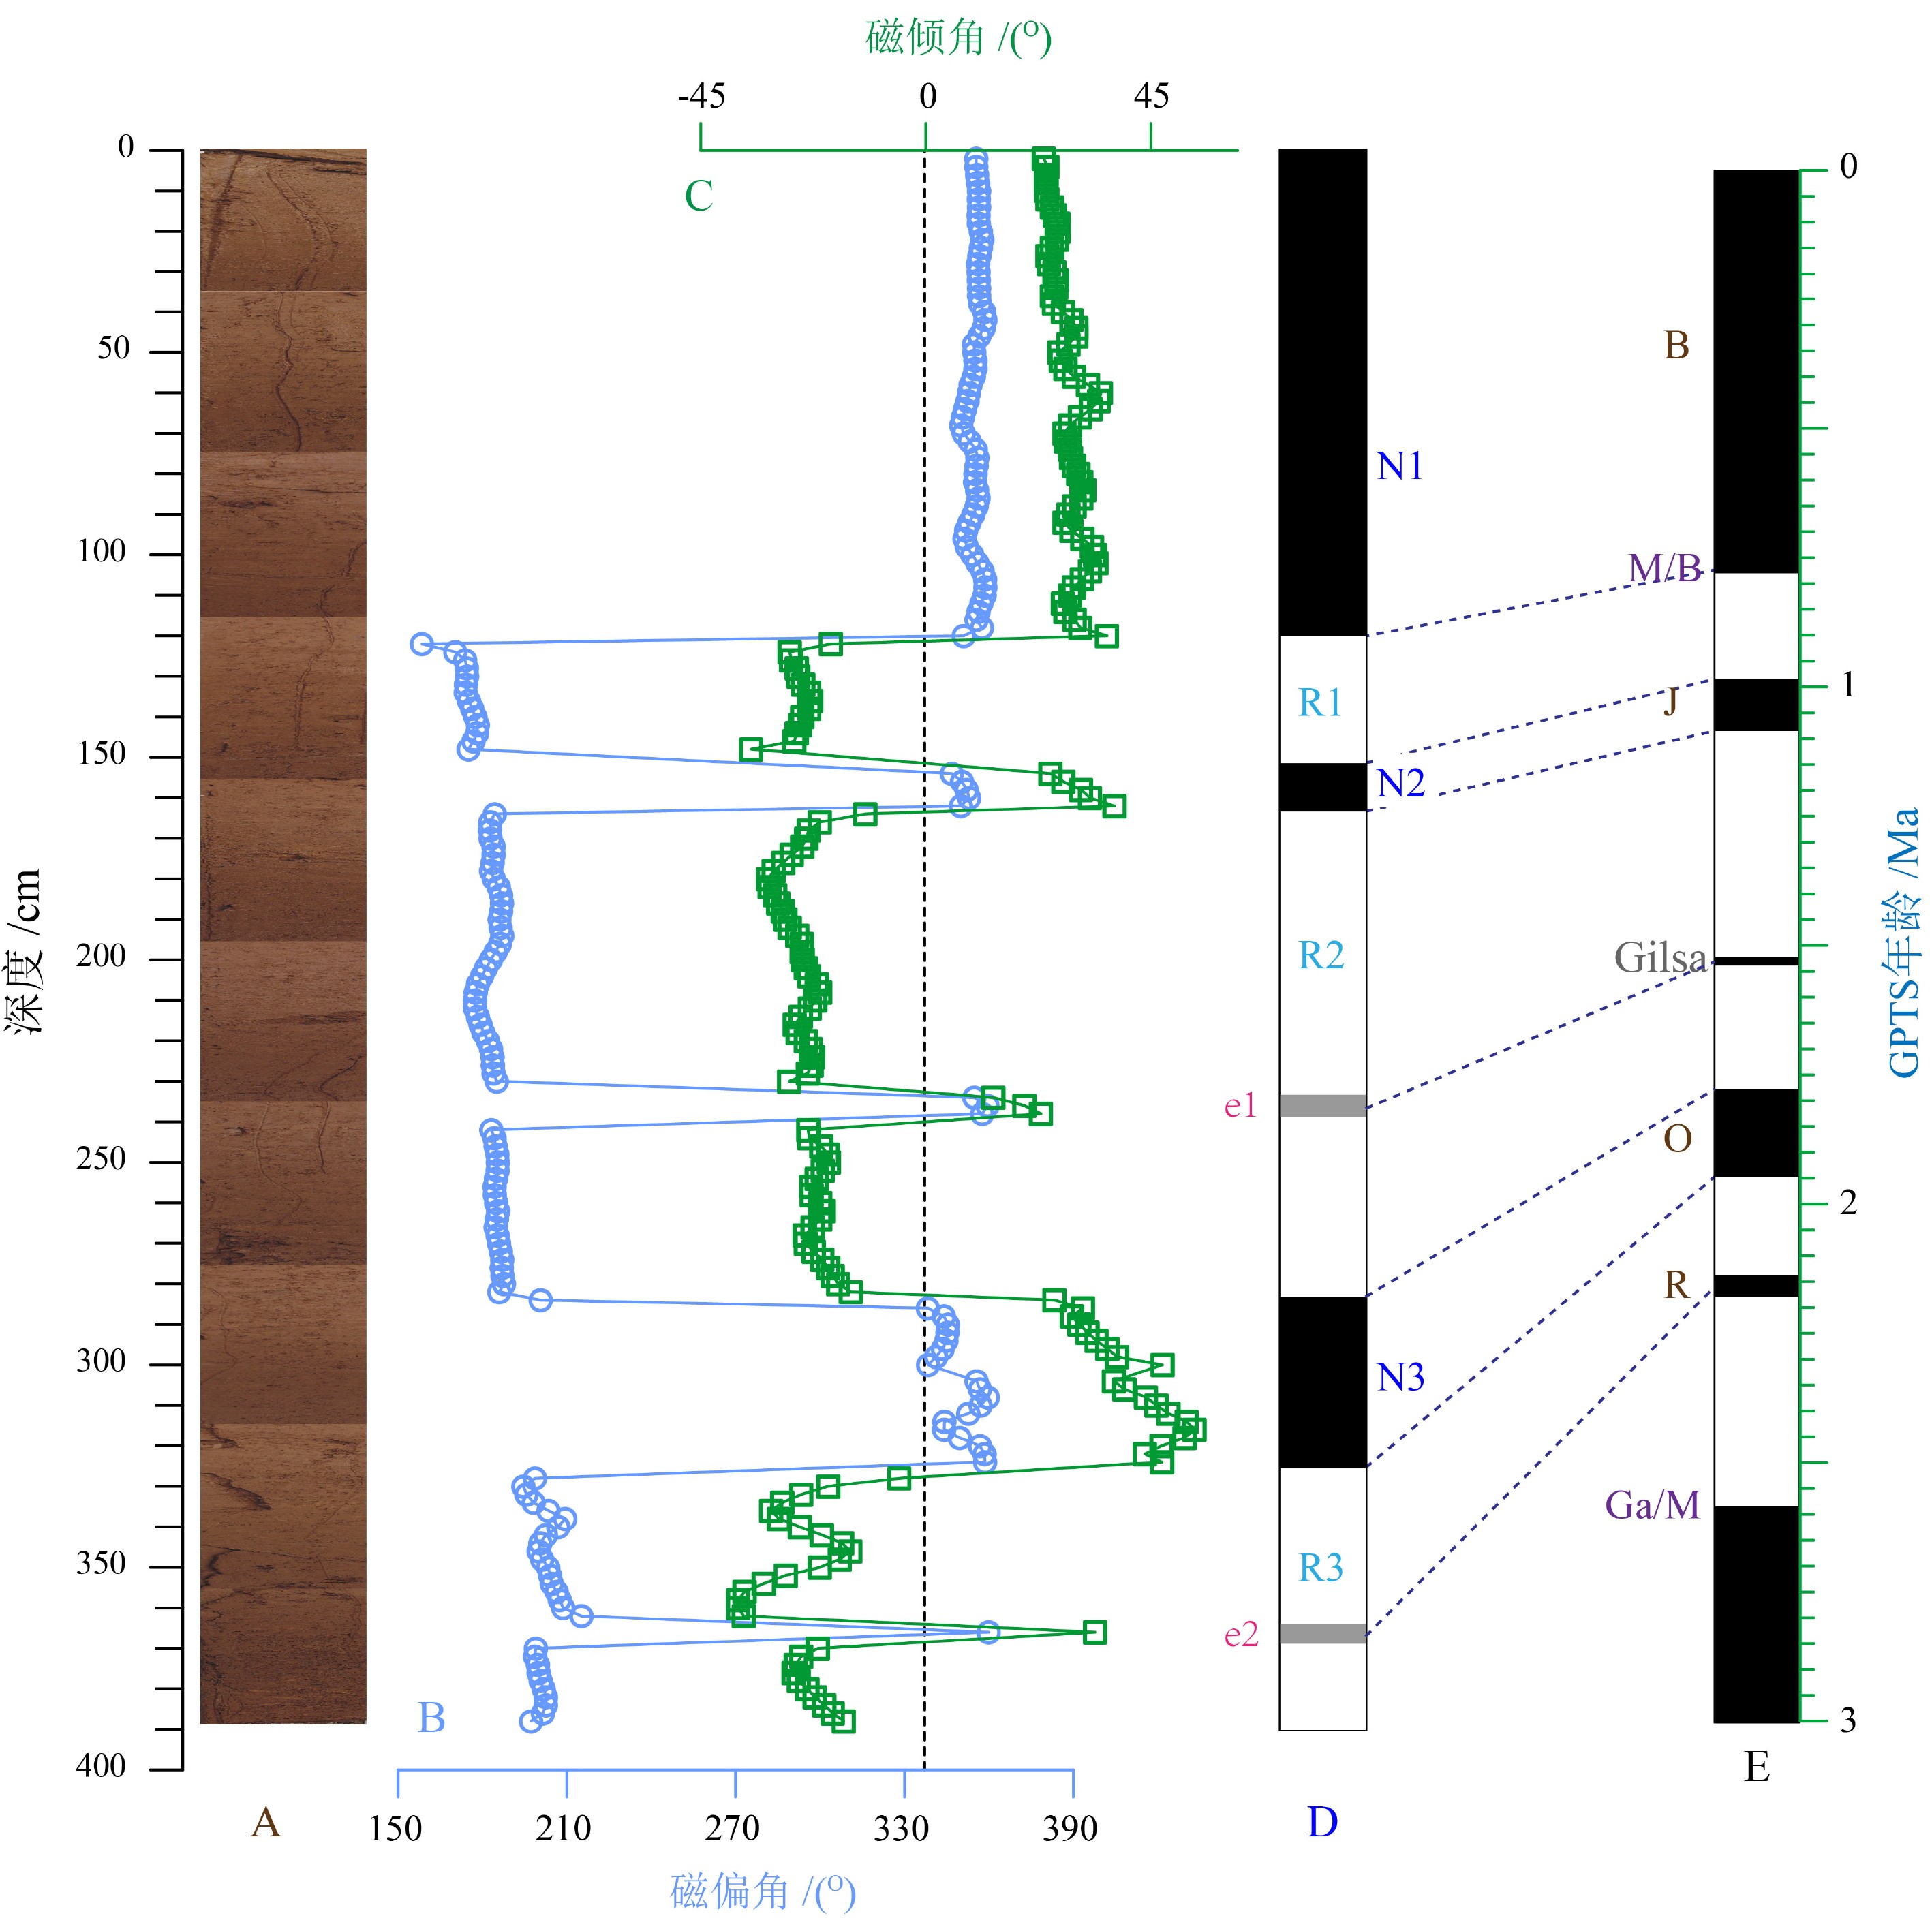
![]()
图 3 菲律宾海中部XT06站沉积的磁性地层结果
A. 岩心照片,B—C. 特征剩磁,D. XT06站磁极性柱,E. 国际标准磁极性柱[41]。B,布容Brunhes;M,松山Matuyama;J,加拉米洛Jaramillo;O,奥杜维尔Olduvai;R,留尼旺Reunion;M/B,松山-布容界限;Ga/M,高斯-松山界限。
Figure 3. Magnetostratigraphy of core XT06
(A)photo of the core;(B-C)ChRM declination and inclination, respectively;(D)the polarity of core XT06 with six identified magnetozones;(E)The geological polarity timescale(GPTS). B, Brunhes chron; M, Matuyama chron; J, Jaramillo subchron; O, Olduvai; R, Reunion; M/B, the Matuyama/Brunhes boundary; Ga/M, the Gauss-Matuyama boundary.
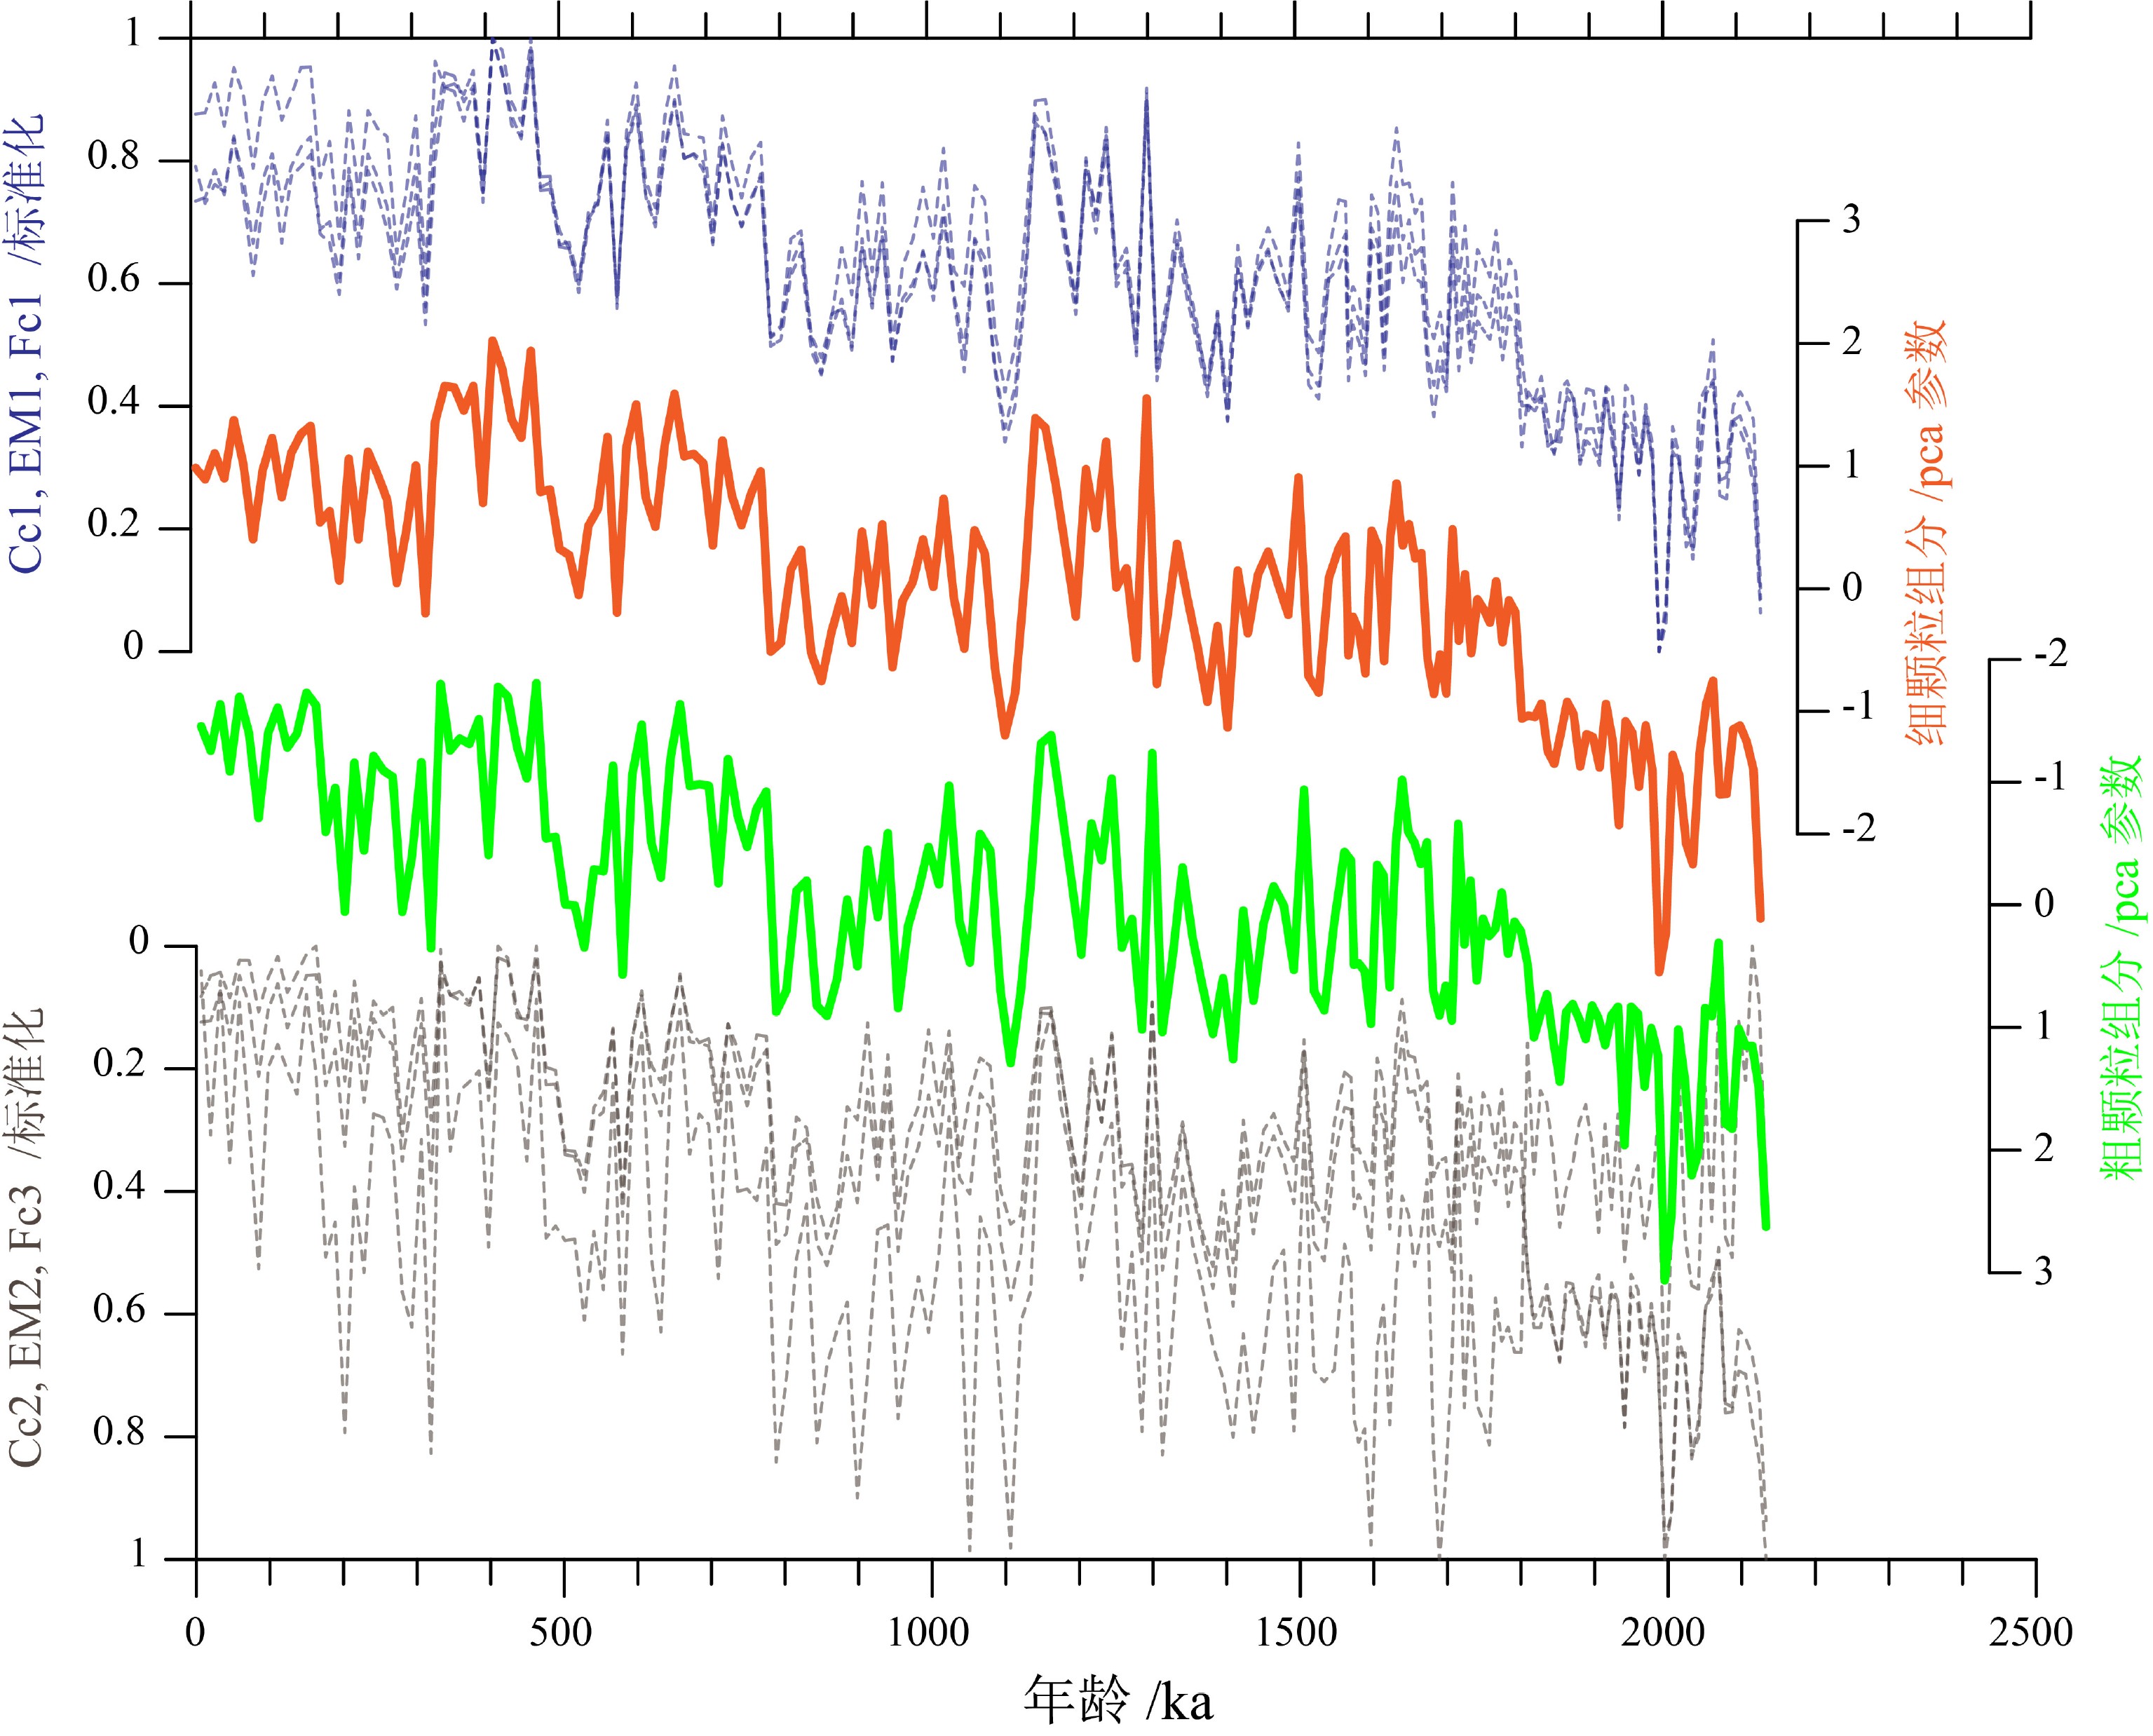
![]()
图 4 XT06站沉积物粒度特征
A. 粒度组分三角图,B. C-M图,C. 粒度频率曲线,D. 累积频率曲线,E. 粒度两组分分解结果,F. 粒度主成分分析结果。其中Mean代表所有样品平均的粒径分布,S.D.为敏感粒级曲线(左侧纵坐标);Cc1和Cc2为敏感粒级组分;EM1和EM2为Weibull函数分解组分(右侧纵坐标)。
Figure 4. Characteristics of sediment grain size of core XT06
(A)ternary diagrams;(B)C-M diagrams;(C)grain-size distributions, PDF: probability density function;(D)grain-size distributions, CDF: cumulative distribution function.(E)Mathematical unmixing, EM1 and EM2 are the two characterized grain-size components; Cc1 and Cc2 are the two components by grain-size sensitive fraction; Mean, the averaged grain-size curve of all samples; S.D., the standard deviation of all samples.(F)Principal component analysis. Fc1, Fc2, and Fc3 are the three components.
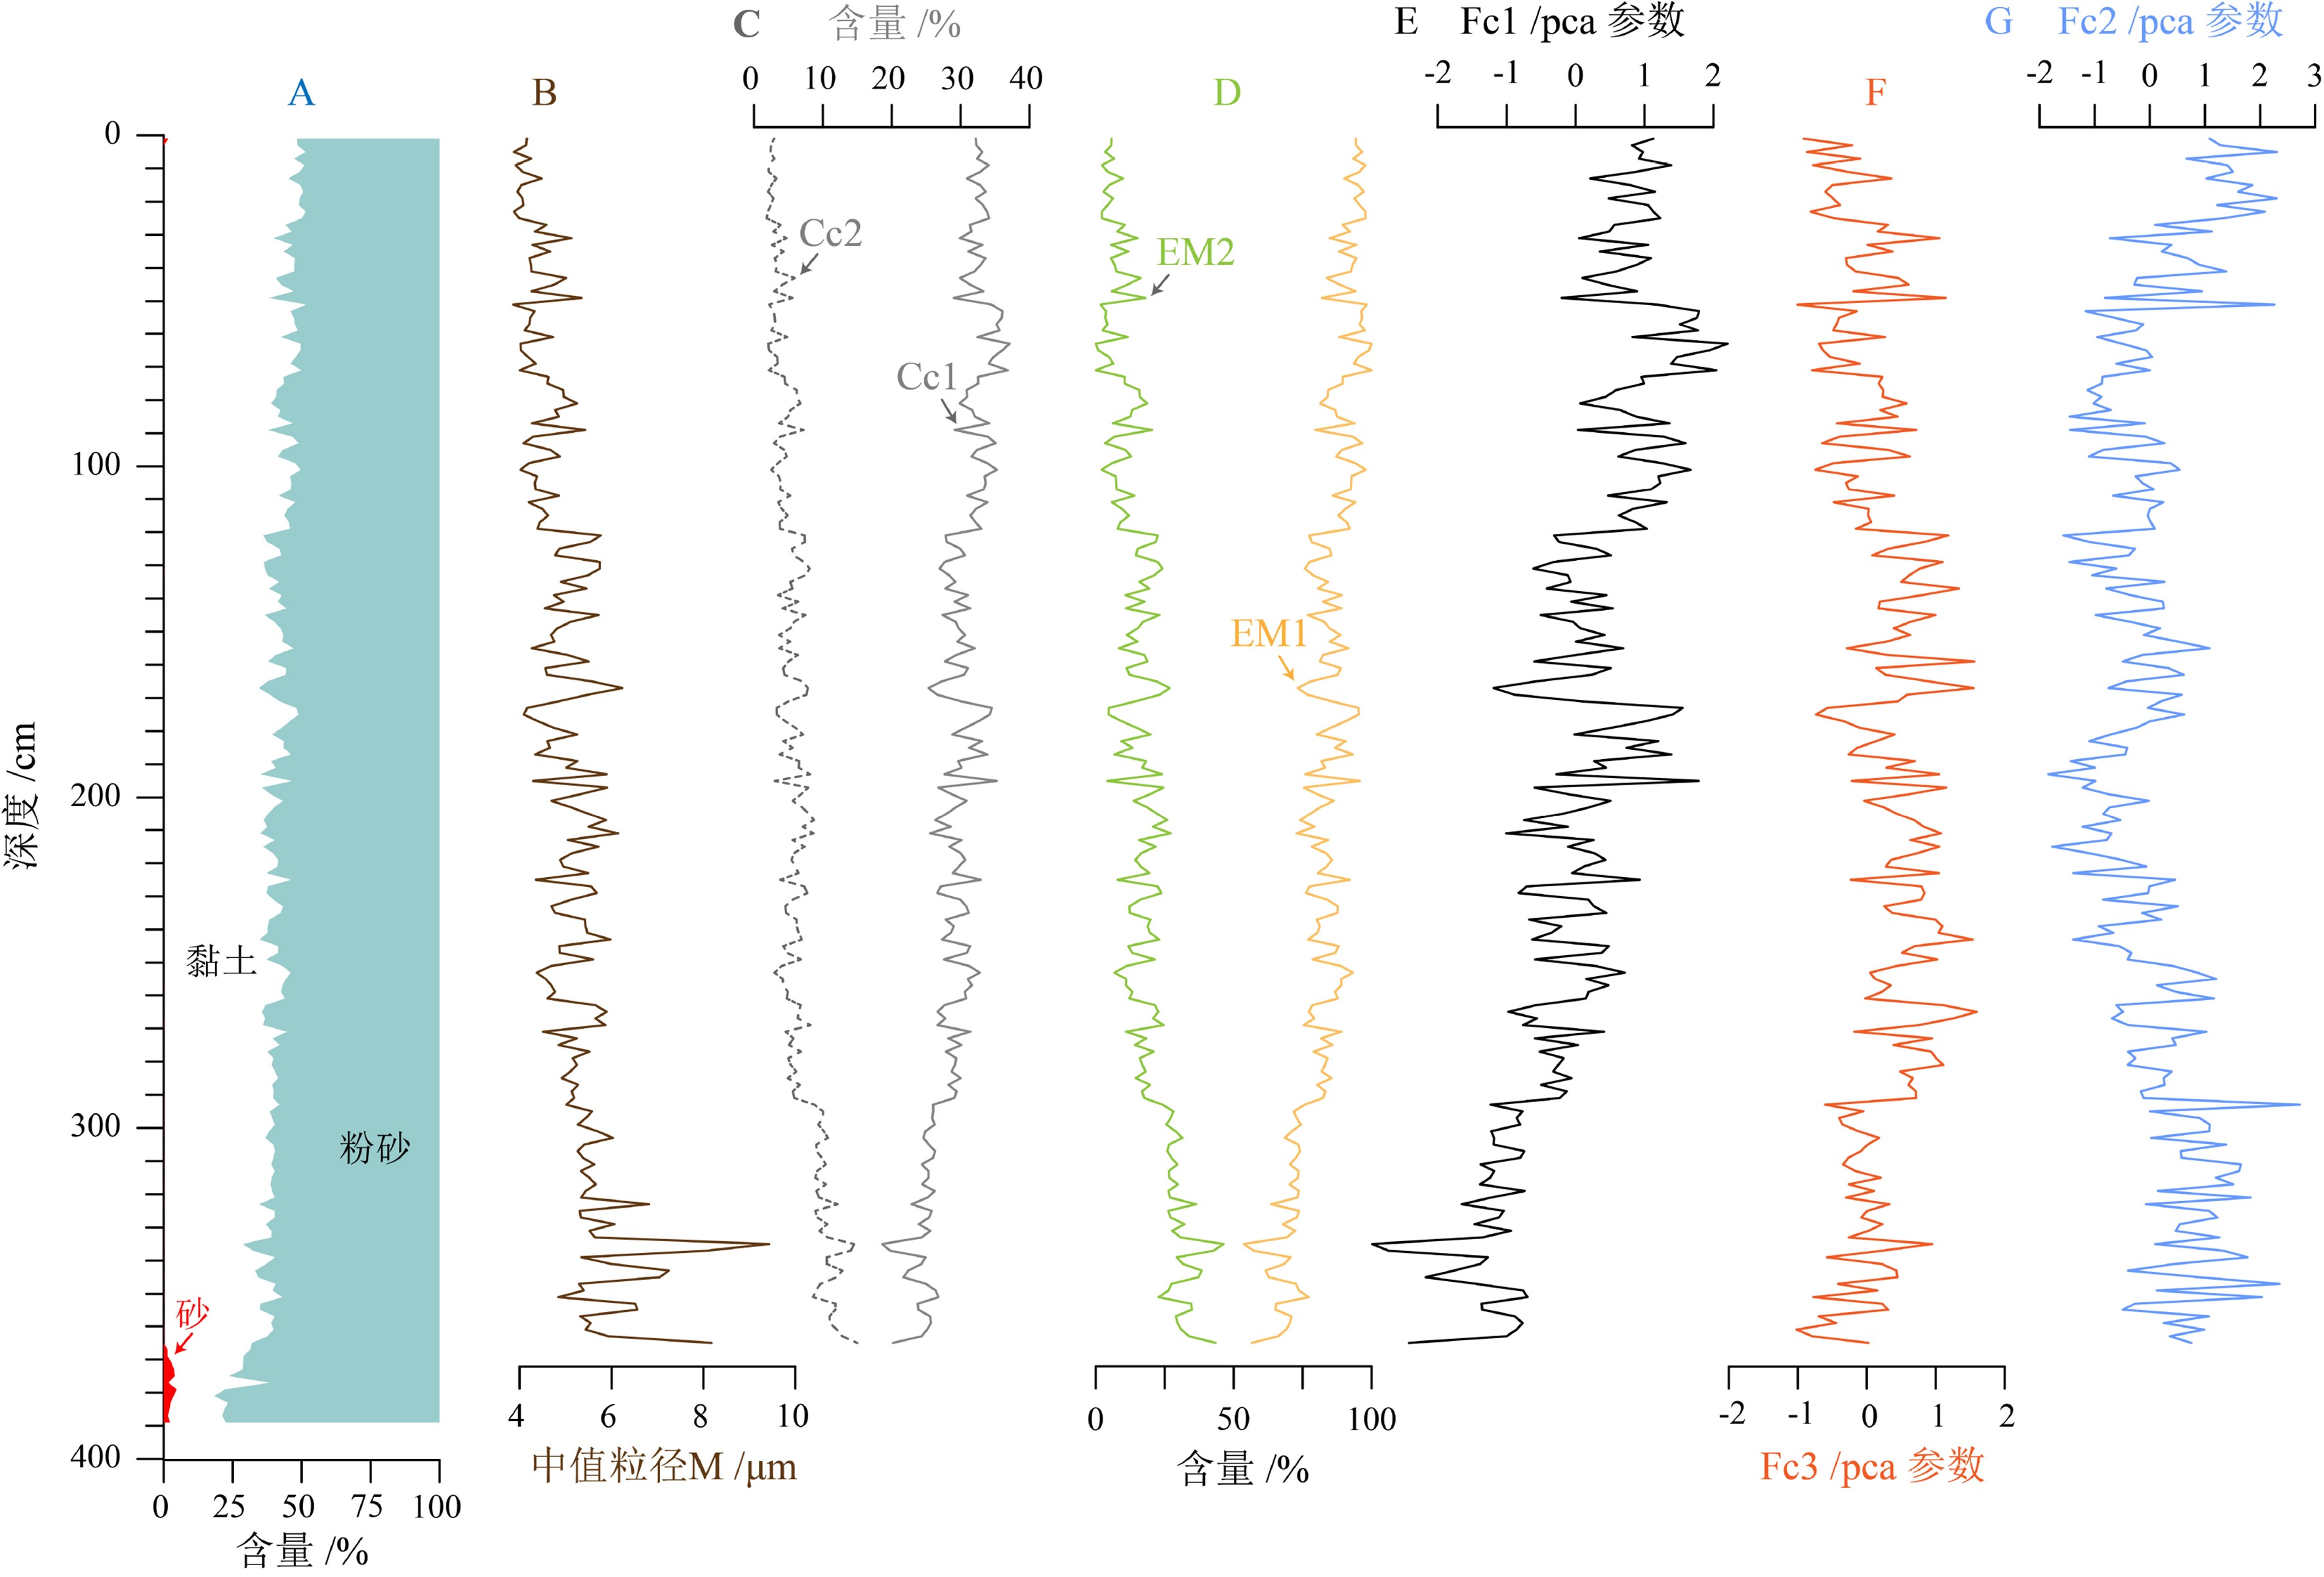
![]()
图 5 XT06站沉积物粒度参数随钻孔深度的变化
Figure 5. Changes in sediment grain-size parameters of core XT06
![]()
![]()
图 7 多种分析方法获得的粒度特征组分对比
Figure 7. Comparisons between changes in various grain-size parameters
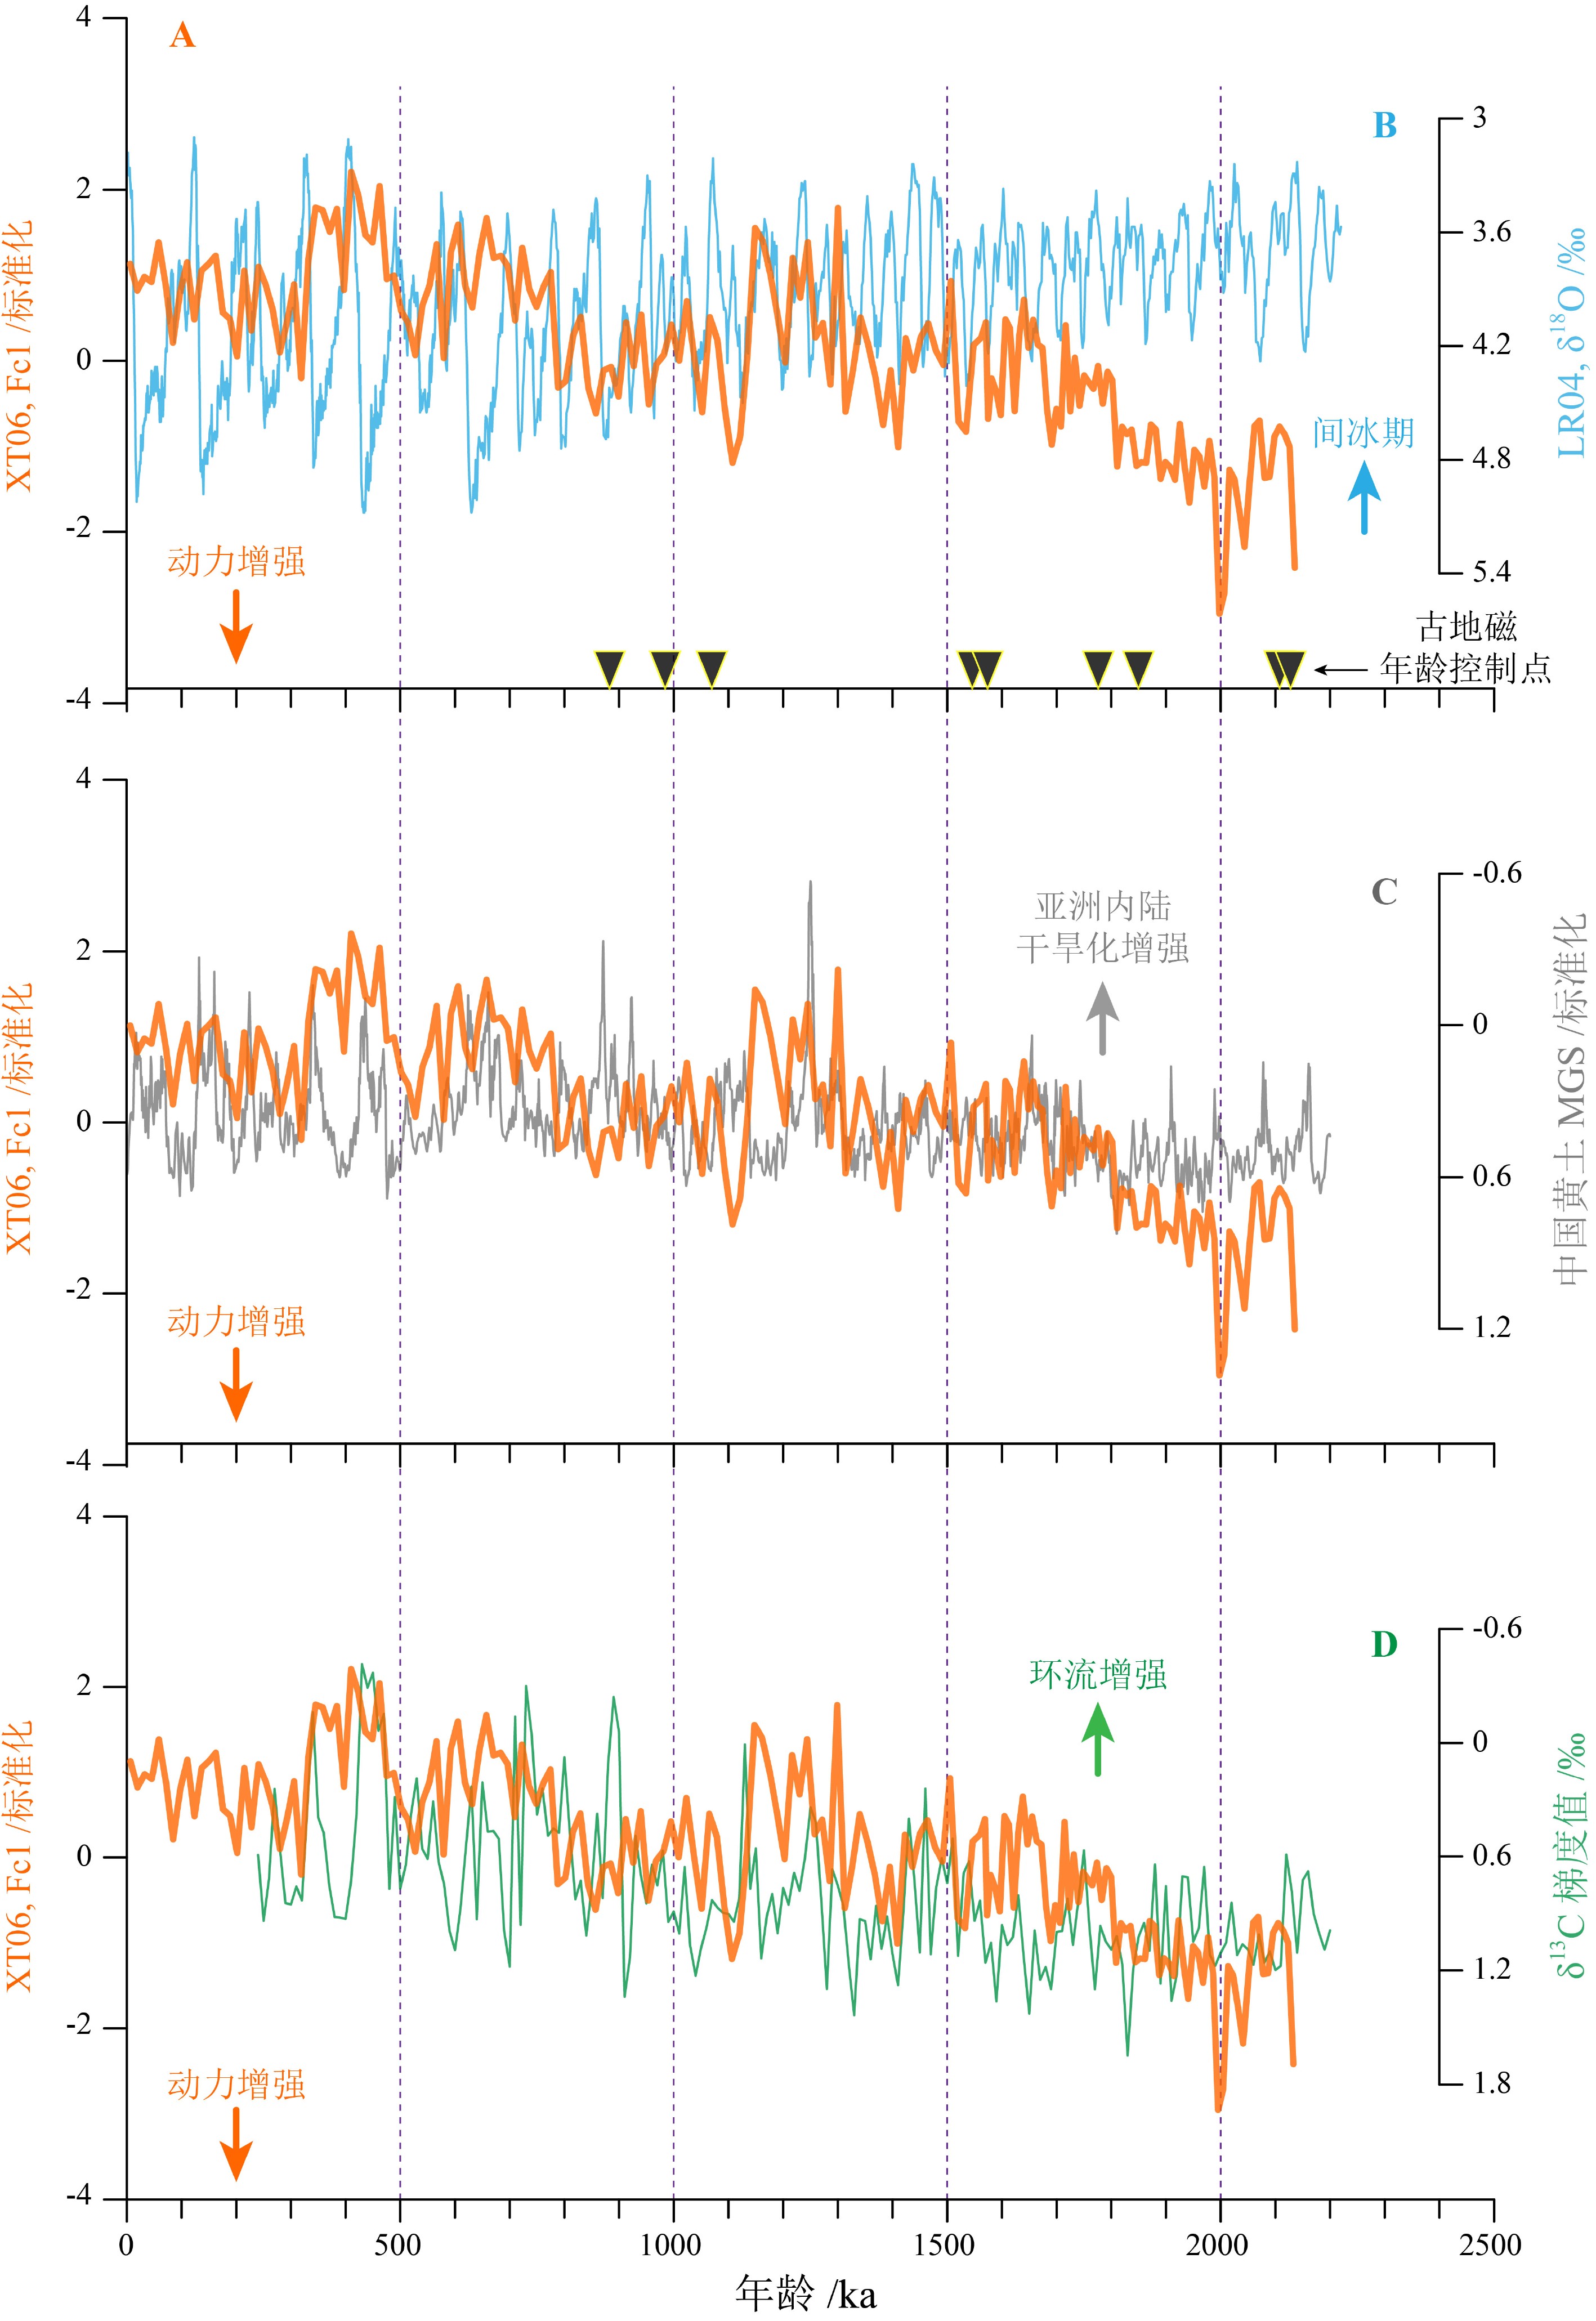
![]()
图 8 XT06站柱状沉积的粒度特征与全球其他环境指标的对比
A. XT06站沉积物粒度Fc1指标,B. 全球海洋有孔虫氧同位素综合曲线[58],C. 中国黄土粒度综合曲线[65],D. 大洋有孔虫碳同位素梯度值(北大西洋ODP607站与赤道太平洋ODP849站δ13C差值),可以代表南极上层绕极流的强度变化[59]。
Figure 8. Comparisons between XT06 grain-size records and global climate changes
(A)Fc1 record of core XT06;(B)LR04 marine foraminiferal oxygen isotope stack [58];(C)stack record of chinese loess plateau, representing Asian monsoon changes [65];(D)benthic δ13C difference between North Atlantic ODP Site 607 and Eqatorial Pacific ODP Site 849 [59], reflecting LCDW intensity.
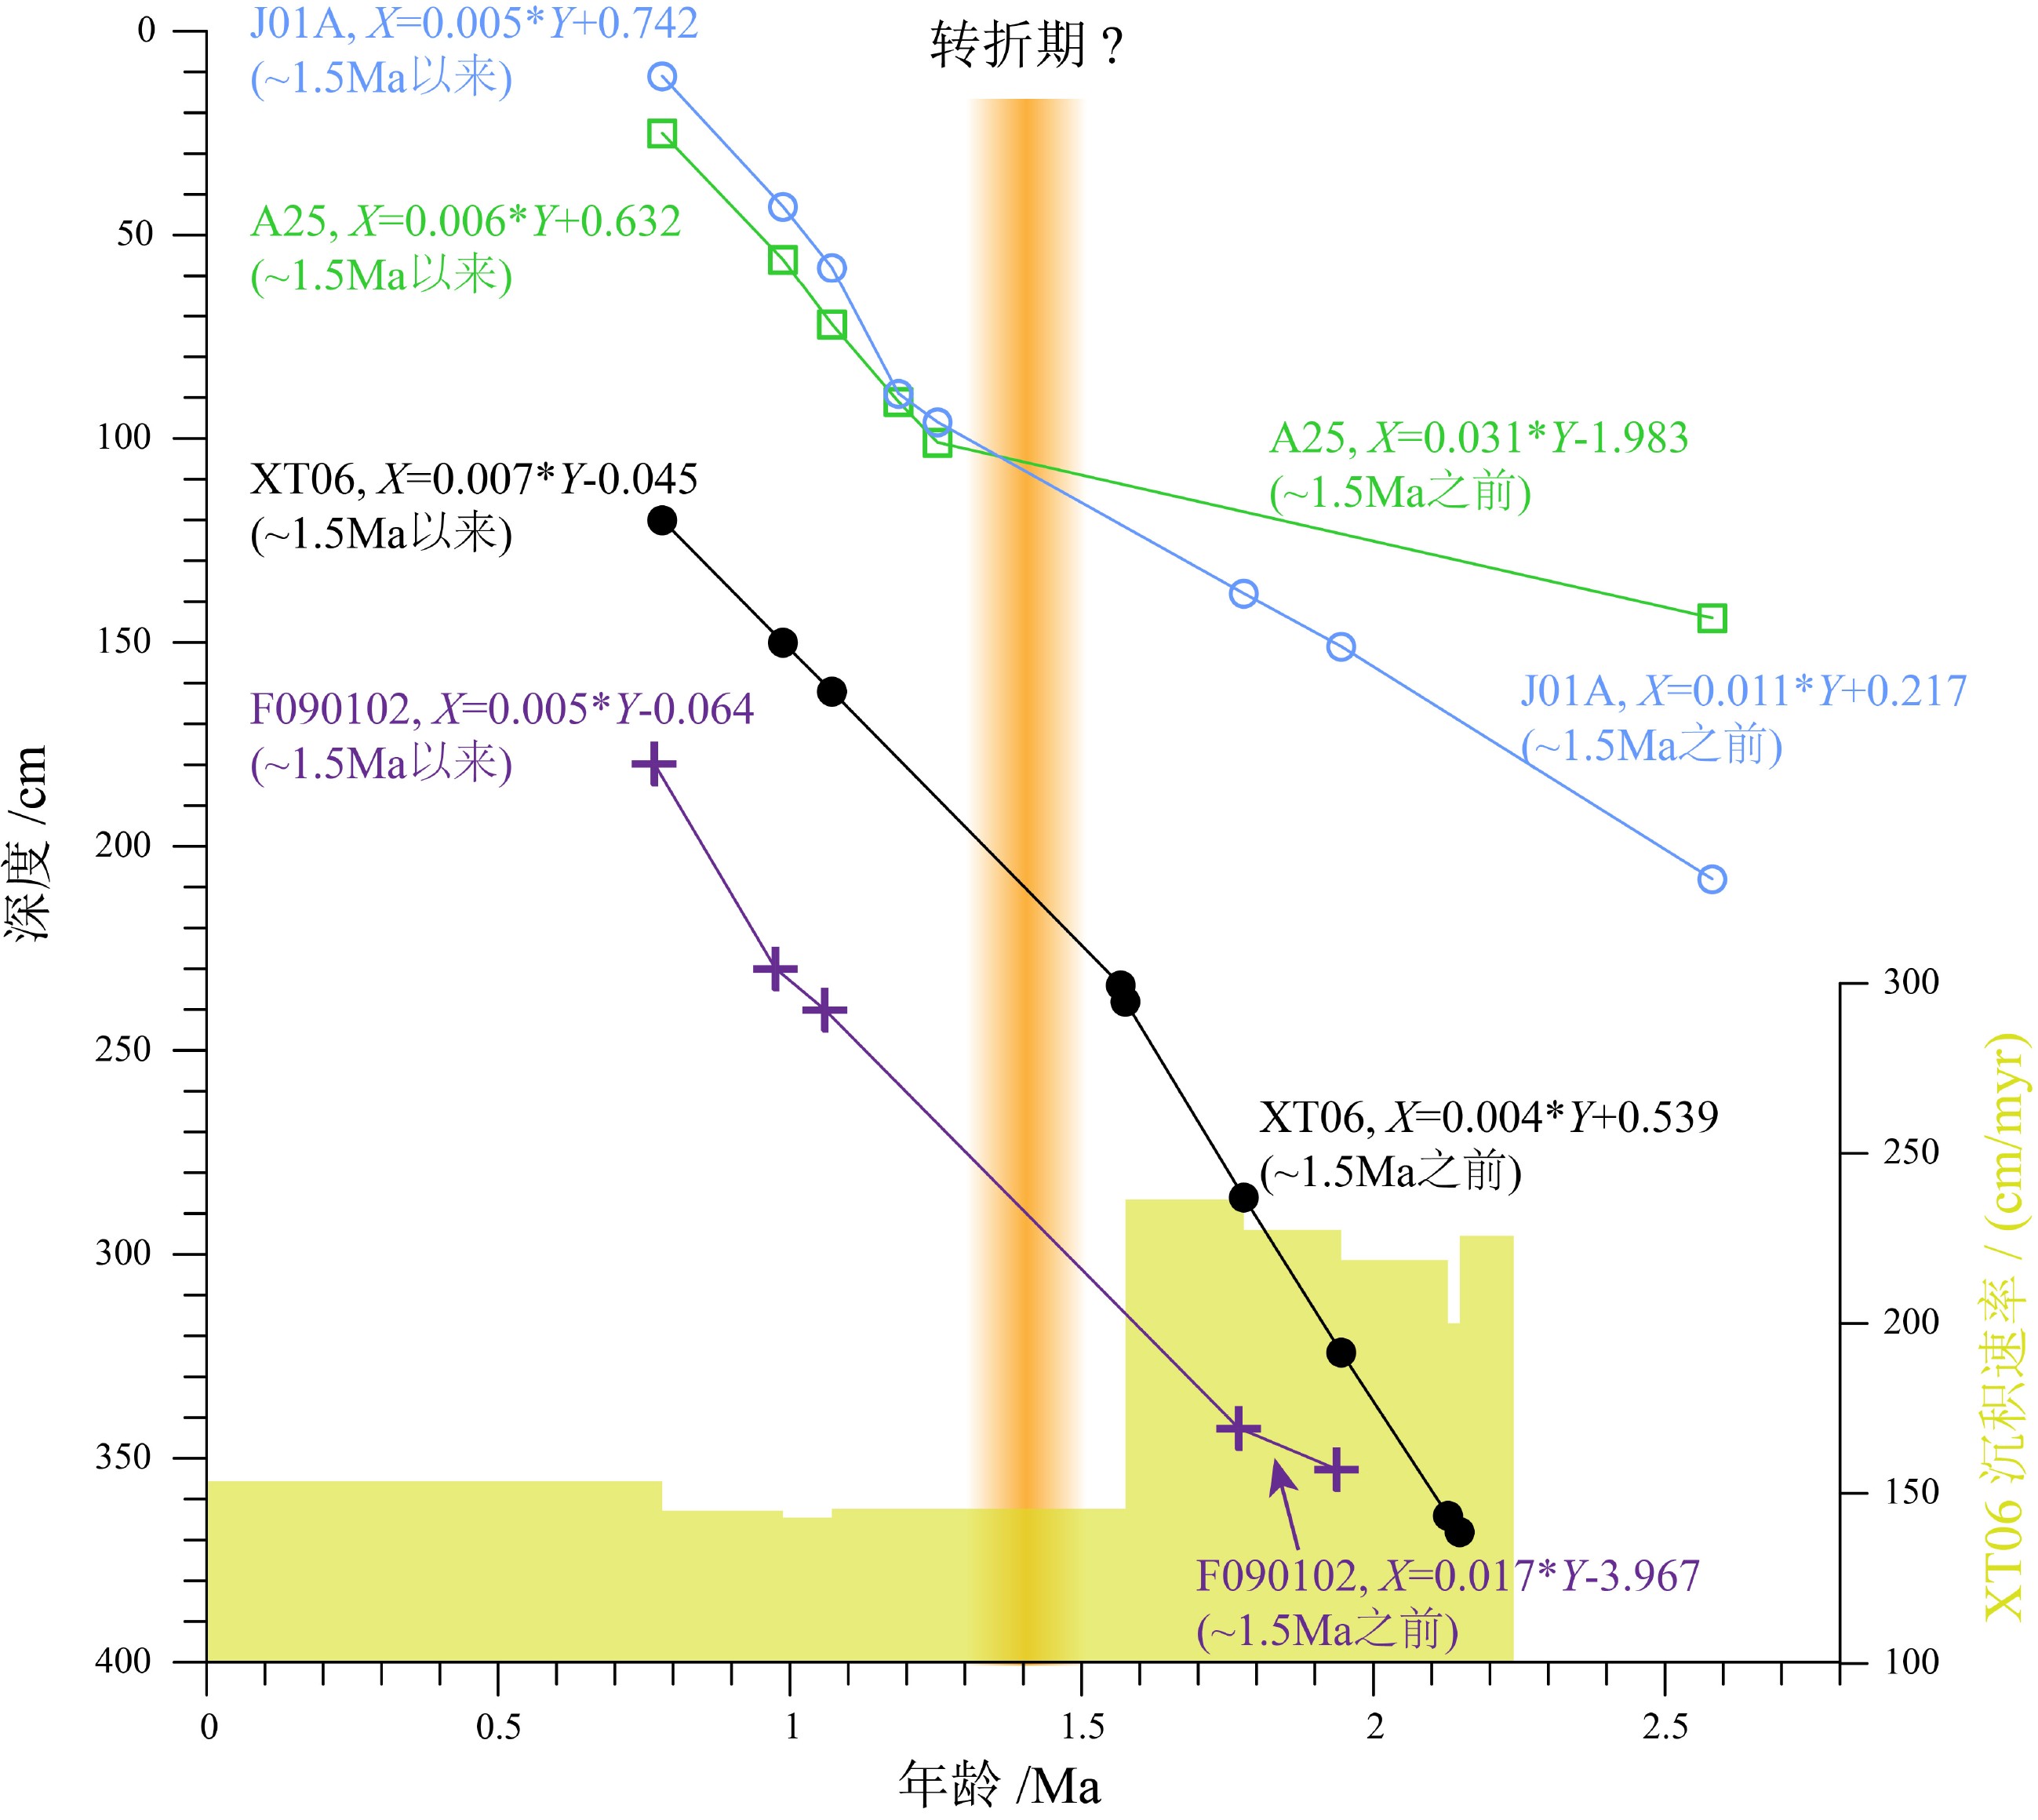
表 1 XT06站磁极性柱年龄对比
Table 1 Correlation of magnetozones of core XT06 to the geomagnetic polarity time scale
国 际标准磁极性年表 年 龄 1)/Ma XT06深度 /cm J01A2)深度/cm A252)深度 /cm F0901023)深度 /cm 布容C1n(底) 0.781 120 11 25 182 加拉米洛C1r.1n(顶) 0.988 150 43 56 232 加拉米洛C1r.1n(底) 1.072 162 58 72 242 Cobb漂移事件(顶) 1.186 – 89 91 – Bjorn漂移事件(底) 1.253 – 96 101 – Gilsa漂移事件(顶) 1.567 234 – – – Gilsa漂移事件(底) 1.575 238 – – – 奥杜维尔C2n(顶) 1.778 286 138 – 344 奥杜维尔C2n(底) 1.945 324 151 – 354 Reunion漂移事件(顶) 2.128 364 – – – Reunion漂移事件(底) 2.148 368 – – – 高斯C2An.1n(顶) 2.581 – 208 144 – 注:1)年龄数据来自文献[41]和文献[42];2)数据来自文献[40];3)数据来自文献[43]。  下载: 导出CSV
表 2 XT06站沉积物粒度主成分分析结果
Table 2 Results of principal component analysis for XT06 sediments
分析数据 主成分 主成分参数 特征根 方差 /% 累计方差 /% 所有样品的粒度分布数据 Fc1 42.2 44.0 44.0 Fc2 25.3 26.3 70.3 Fc3 23.2 24.2 94.5 Fc1、Cc-1、EM1三个序列 1 3.0 98.6 98.6 2 0.038 1.252 99.9 3 0.003 0.108 100 Fc2、Cc-2、EM2三个序列 1 2.1 70.8 70.8 2 0.872 29.1 99.9 3 0.004 0.1 100
下载: 导出CSV
-
[1] Sato T, Oda H, Ishizuka O, et al. Detailed bathymetry and magnetic anomaly in the central Ryukyu Arc, Japan: Implications for a westward shift of the volcanic front after approximately 2.1 Ma [J]. Earth, Planets and Space, 2014, 66: 68. doi: 10.1186/1880-5981-66-68
[2] Kawabe M, Fujio S. Pacific ocean circulation based on observation [J]. Journal of Oceanography, 2010, 66(3): 389-403. doi: 10.1007/s10872-010-0034-8
[3] Zhai F G, Gu Y Z. Abyssal circulation in the Philippine Sea [J]. Journal of Ocean University of China, 2020, 19(2): 249-262. doi: 10.1007/s11802-020-4241-7
[4] Nechaev V P. Evolution of the Philippine and Japan Seas from the clastic sediment record [J]. Marine Geology, 1991, 97(1-2): 167-190. doi: 10.1016/0025-3227(91)90025-Y
[5] Xu Z K, Li T G, Clift P D, et al. Quantitative estimates of asian dust input to the western Philippine Sea in the mid-late Quaternary and its potential significance for paleoenvironment [J]. Geochemistry, Geophysics, Geosystems, 2015, 16(9): 3182-3196. doi: 10.1002/2015GC005929
[6] Ming J, Li A C, Huang J, et al. Assemblage characteristics of clay minerals and its implications to evolution of eolian dust input to the Parece Vela basin since 1.95 ma [J]. Chinese Journal of Oceanology and Limnology, 2014, 32(1): 174-186. doi: 10.1007/s00343-014-3066-x
[7] Jiang Z Z, Sun Z L, Liu Z Q, et al. Rare-earth element geochemistry reveals the provenance of sediments on the southwestern margin of the Challenger Deep [J]. Journal of Oceanology and Limnology, 2019, 37(3): 998-1009. doi: 10.1007/s00343-019-8046-8
[8] 王汾连, 何高文, 王海峰, 等. 马里亚纳海沟柱状沉积物稀土地球化学特征及其指示意义[J]. 海洋地质与第四纪地质, 2016, 36(4):67-75. [WANG Fenlian, HE Gaowen, WANG Haifeng, et al. Geochemistry of rare earth elements in a core from Mariana Trench and its significance [J]. Marine Geology & Quaternary Geology, 2016, 36(4): 67-75. [9] Xiao C H, Wang Y H, Tian J W, et al. Mineral composition and geochemical characteristics of sinking particles in the Challenger Deep, Mariana Trench: Implications for provenance and sedimentary environment [J]. Deep Sea Research Part I: Oceanographic Research Papers, 2020, 157: 103211. doi: 10.1016/j.dsr.2019.103211
[10] Rea D K. The paleoclimatic record provided by eolian deposition in the deep sea: The geologic history of wind [J]. Reviews of Geophysics, 1994, 32(2): 159-195. doi: 10.1029/93RG03257
[11] Rea D K, Hovan S A. Grain size distribution and depositional processes of the mineral component of abyssal sediments: Lessons from the north Pacific [J]. Paleoceanography and Paleoclimatology, 1995, 10(2): 251-258.
[12] Hovan S A, Rea D K, Pisias N G, et al. A direct link between the China loess and marine δ18O records: Aeolian flux to the north Pacific [J]. Nature, 1989, 340(6231): 296-298. doi: 10.1038/340296a0
[13] Windom H L. Atmospheric dust records in permanent snowfields: Implications to marine sedimentation [J]. GSA Bulletin, 1969, 80(5): 761-782. doi: 10.1130/0016-7606(1969)80[761:ADRIPS]2.0.CO;2
[14] Pettke T, Halliday A N, Hall C M, et al. Dust production and deposition in Asia and the north Pacific Ocean over the past 12 Myr [J]. Earth and Planetary Science Letters, 2000, 178(3-4): 397-413. doi: 10.1016/S0012-821X(00)00083-2
[15] Xiao C H, Wang Y H, Lin J. Constraints of magnetostratigraphic and mineralogical data on the provenance of sediments in the Parece Vela basin of the western Pacific [J]. Journal of Asian Earth Sciences, 2020, 196: 104373. doi: 10.1016/j.jseaes.2020.104373
[16] 黄杰, 万世明, 张国良, 等. 海底地形特征对东菲律宾海表层黏土矿物分布的影响[J]. 海洋地质与第四纪地质, 2017, 37(1):77-85. [HUANG Jie, WAN Shiming, ZHANG Guoliang, et al. Impact of seafloor topography on distribution of clay minerals in the east Philippines Sea [J]. Marine Geology & Quaternary Geology, 2017, 37(1): 77-85. [17] Yu Z J, Wan S M, Colin C, et al. Co-evolution of monsoonal precipitation in east Asia and the tropical Pacific ENSO system since 2.36 Ma: New insights from high-resolution clay mineral records in the west Philippine Sea [J]. Earth and Planetary Science Letters, 2016, 446: 45-55. doi: 10.1016/j.jpgl.2016.04.022
[18] Jiang F Q, Frank M, Li T G, et al. Asian dust input in the western Philippine Sea: Evidence from radiogenic Sr and Nd isotopes [J]. Geochemistry, Geophysics, Geosystems, 2013, 14(5): 1538-1551. doi: 10.1002/ggge.20116
[19] Wan S M, Yu Z J, Clift P D, et al. History of Asian eolian input to the west Philippine Sea over the last one million years [J]. Palaeogeography, Palaeoclimatology, Palaeoecology, 2012, 326-328: 152-159. doi: 10.1016/j.palaeo.2012.02.015
[20] Seo I, Lee Y I, Yoo C M, et al. Sr-Nd isotope composition and clay mineral assemblages in eolian dust from the central Philippine Sea over the last 600 kyr: Implications for the transport mechanism of Asian dust [J]. Journal of Geophysical Research: Atmospheres, 2014, 119(19): 11492-11504. doi: 10.1002/2014JD022025
[21] Kirschvink J L. The least-squares line and plane and the analysis of palaeomagnetic data [J]. Geophysical Journal of the Royal Astronomical Society, 1980, 62(3): 699-718. doi: 10.1111/j.1365-246X.1980.tb02601.x
[22] Ashley G M. Interpretation of polymodal sediments [J]. The Journal of Geology, 1978, 86(4): 411-421. doi: 10.1086/649710
[23] Kranck K, Smith P C, Milligan T G. Grain-size characteristics of fine-grained unflocculated sediments I: 'One-round' distributions [J]. Sedimentology, 1996, 43(3): 589-594. doi: 10.1046/j.1365-3091.1996.d01-27.x
[24] Kranck K, Smith P C, Milligan T G. Grain-size characteristics of fine-grained unflocculated sediments II: 'Milti-round' distributions [J]. Sedimentology, 1996, 43(3): 597-606. doi: 10.1046/j.1365-3091.1996.d01-28.x
[25] Sun D H, Bloemendal J, Rea D K, et al. Grain-size distribution function of polymodal sediments in hydraulic and aeolian environments, and numerical partitioning of the sedimentary components [J]. Sedimentary Geology, 2002, 152(3-4): 263-277. doi: 10.1016/S0037-0738(02)00082-9
[26] Qin X G, Cai B G, Liu T S. Loess record of the aerodynamic environment in the east Asia monsoon area since 60, 000 years before present [J]. Journal of Geophysical Research: Solid Earth, 2005, 110(B1): B01204.
[27] 易亮, 于洪军, 徐兴永, 等. 碳酸盐含量对莱州湾南岸钻孔沉积物粒度测试结果的影响[J]. 海洋科学进展, 2010, 28(3):325-331. [YI Liang, YU Hongjun, XU Xingyong, et al. Influences of carbonate contents on the grain-size measurements of borehole sediments from southern shore of Laizhou Bay [J]. Advances in Marine Science, 2010, 28(3): 325-331. doi: 10.3969/j.issn.1671-6647.2010.03.008 [28] Chen G Q, Yi L, Chen S L, et al. Partitioning of grain-size components of estuarine sediments and implications for sediment transport in southwestern Laizhou bay, China [J]. Chinese Journal of Oceanology and Limnology, 2013, 31(4): 895-906. doi: 10.1007/s00343-013-2304-y
[29] Yi L, Deng C L, Xu X Y, et al. Paleo-megalake termination in the Quaternary: Paleomagnetic and water-level evidence from south Bohai Sea, China [J]. Sedimentary Geology, 2015, 319: 1-12. doi: 10.1016/j.sedgeo.2015.01.005
[30] Yi L, Yu H J, Ortiz J D, et al. A reconstruction of late Pleistocene relative sea level in the south Bohai Sea, China, based on sediment grain-size analysis [J]. Sedimentary Geology, 2012, 281: 88-100. doi: 10.1016/j.sedgeo.2012.08.007
[31] Su Q, Peng C S, Yi L, et al. An improved method of sediment grain size trend analysis in the Xiaoqinghe estuary, southwestern Laizhou Bay, China [J]. Environmental Earth Sciences, 2016, 75: 1185. doi: 10.1007/s12665-016-5924-7
[32] Boulay S, Colin C, Trentesaux A, et al. Sedimentary responses to the Pleistocene climatic variations recorded in the South China Sea [J]. Quaternary Research, 2007, 68(1): 162-172. doi: 10.1016/j.yqres.2007.03.004
[33] Boulay S, Colin C, Trentesaux A, et al. Mineralogy and sedimentology of Pleistocene sediment in the South China Sea (ODP Site 1144)[C]//Prell W L, Wang P, Blum P, et al. Proceedings of the Ocean Drilling Program: Scientific Results. 2003, 184: 1-21.
[34] Darby D A, Ortiz J D, Polyak L, et al. The role of currents and sea ice in both slowly deposited central Arctic and rapidly deposited Chukchi–Alaskan margin sediments [J]. Global and Planetary Change, 2009, 68(1-2): 58-72. doi: 10.1016/j.gloplacha.2009.02.007
[35] Yi L, Yu H J, Ortiz J D, et al. Late quaternary linkage of sedimentary records to three astronomical rhythms and the Asian monsoon, inferred from a coastal borehole in the south Bohai Sea, China [J]. Palaeogeography, Palaeoclimatology, Palaeoecology, 2012, 329-330: 101-117. doi: 10.1016/j.palaeo.2012.02.020
[36] Hu B Q, Yang Z S, Zhao M X, et al. Grain size records reveal variability of the east Asian winter monsoon since the middle Holocene in the central Yellow Sea Mud Area, China [J]. Science China Earth Sciences, 2012, 55(10): 1656-1668. doi: 10.1007/s11430-012-4447-7
[37] Zijderveld J D A. A. C. Demagnetization of rocks: Analysis of results [M] //Collinson D W, Creer K M, Runco S K. Methods in paleomagnetism. Amsterdam: Elsevier. 1967: 254-286.
[38] 孟庆勇, 李安春, 蒋富清, 等. 近2 Ma来东菲律宾海地球磁场相对强度变化的沉积记录[J]. 海洋与湖沼, 2010, 41(4):606-613. [Meng Q Y, Li A C, Jiang F Q, et al. A geomagnetic paleointensity record over the last 2 Ma from the east Philippine Sea [J]. Oceanologia et Limnologia Sinica, 2010, 41(4): 606-613. doi: 10.11693/hyhz201004021021 [39] 孟庆勇, 李安春, 靳宁, 等. 东菲律宾海柱样沉积物的磁性特征[J]. 海洋地质与第四纪地质, 2006, 26(3):57-63. [Meng Q Y, Li A C, Jin N, et al. Magnetostratigraphic and magnetic properties of marine sediments from the east Philippine Sea [J]. Marine Geology & Quaternary Geology, 2006, 26(3): 57-63. [40] Yi L, Xu D, Jiang X Y, et al. Magnetostratigraphy and authigenic 10Be/9Be dating of Plio-Pleistocene abyssal surficial sediments on the southern slope of Mariana Trench and sedimentary processes during the mid-Pleistocene transition [J]. Journal of Geophysical Research: Oceans, 2020, 125(8): e2020JC016250.
[41] Hilgen F J, Lourens L J, van Dam J A, et al. The Neogene period[M]//Gradstein F M, Ogg J G, Schmitz M D, et al. The Geologic Time Scale 2012. Amsterdam: Elsevier, 2012: 923-978.
[42] Channell J E T, Singer B S, Jicha B R. Timing of Quaternary geomagnetic reversals and excursions in volcanic and sedimentary archives [J]. Quaternary Science Reviews, 2020, 228: 106114. doi: 10.1016/j.quascirev.2019.106114
[43] Jiang F Q, Zhu X, Li T G, et al. Increased dust deposition in the Parece Vela basin since the mid-Pleistocene inferred from radiogenic Sr and Nd isotopes [J]. Global and Planetary Change, 2019, 173: 83-95. doi: 10.1016/j.gloplacha.2018.12.011
[44] Passega R. Grain size representation by CM patterns as a geologic tool [J]. Journal of Sedimentary Research, 1964, 34(4): 830-847. doi: 10.1306/74D711A4-2B21-11D7-8648000102C1865D
[45] Yao H, Wang F, Wang H, et al. Pleistocene magnetostratigraphy of four cores in the west Philippian basin and regional sedimentary shift during the mid-Pleistocene transition [J]. Geological Journal, 2020. doi: 10.1002/gj.4082
[46] Hays J D, Imbrie J, Shackleton N J. Variations in the Earth's orbit: Pacemaker of the ice ages [J]. Science, 1976, 194(4270): 1121-1132. doi: 10.1126/science.194.4270.1121
[47] Clark P U, Alley R B, Pollard D. Northern hemisphere ice-sheet influences on global climate change [J]. Science, 1999, 286(5442): 1104-1111. doi: 10.1126/science.286.5442.1104
[48] Zachos J, Pagani M, Sloan L, et al. Trends, rhythms, and aberrations in global climate 65 Ma to present [J]. Science, 2001, 292(5517): 686-693. doi: 10.1126/science.1059412
[49] Sun Y B, Yin Q Z, Crucifix M, et al. Diverse manifestations of the mid-Pleistocene climate transition [J]. Nature Communications, 2019, 10: 352. doi: 10.1038/s41467-018-08257-9
[50] Sun J M, Liu T S. Stratigraphic evidence for the uplift of the Tibetan Plateau between ~1.1 and ~0.9 myr ago [J]. Quaternary Research, 2000, 54(3): 309-320. doi: 10.1006/qres.2000.2170
[51] Sun Y B, An Z S. Late Pliocene-Pleistocene changes in mass accumulation rates of eolian deposits on the central Chinese Loess Plateau [J]. Journal of Geophysical Research: Atmospheres, 2005, 110(D23): D23101. doi: 10.1029/2005JD006064
[52] Ford H L, Raymo M E. Regional and global signals in seawater δ18O records across the mid-Pleistocene transition [J]. Geology, 2020, 48(2): 113-117. doi: 10.1130/G46546.1
[53] Clark P U, Archer D, Pollard D, et al. The middle Pleistocene transition: Characteristics, mechanisms, and implications for long-term changes in atmospheric pCO2 [J]. Quaternary Science Reviews, 2006, 25(23-24): 3150-3184. doi: 10.1016/j.quascirev.2006.07.008
[54] Yi L, Ye X Y, Chen J B, et al. Magnetostratigraphy and luminescence dating on a sedimentary sequence from northern East China Sea: Constraints on evolutionary history of eastern marginal seas of China since the early Pleistocene [J]. Quaternary International, 2014, 349: 316-326. doi: 10.1016/j.quaint.2014.07.038
[55] Jolivet L, Tamaki K, Fournier M. Japan sea, opening history and mechanism: A synthesis [J]. Journal of Geophysical Research: Solid Earth, 1994, 99(B11): 22237-22259. doi: 10.1029/93JB03463
[56] Underwood M B, Fergusson C L. Late Cenozoic evolution of the Nankai trench-slope system: Evidence from sand petrography and clay mineralogy [J]. Geological Society, London, Special Publications, 2005, 244(1): 113-129. doi: 10.1144/GSL.SP.2005.244.01.07
[57] Zhu R X, Zheng T Y. Destruction geodynamics of the north China Craton and its paleoproterozoic plate tectonics [J]. Chinese Science Bulletin, 2009, 54(10): 3354-3366.
[58] Lisiecki L E, Raymo M E. A Pliocene-Pleistocene stack of 57 globally distributed benthic δ18O records [J]. Paleoceanography and Paleoclimatology, 2005, 20(1): PA1003.
[59] Hodell D A, Venz-Curtis K A. Late Neogene history of deepwater ventilation in the Southern Ocean [J]. Geochemistry, Geophysics, Geosystems, 2006, 7(9): Q09001.
[60] Elderfield H, Ferretti P, Greaves M, et al. Evolution of ocean temperature and ice volume through the mid-Pleistocene climate transition [J]. Science, 2012, 337(6095): 704-709. doi: 10.1126/science.1221294
[61] Hodell D A, Venz K A, Charles C D, et al. Pleistocene vertical carbon isotope and carbonate gradients in the south Atlantic Sector of the Southern Ocean [J]. Geochemistry, Geophysics, Geosystems, 2003, 4(1): 1-19.
[62] Howe J N W, Piotrowski A M, Noble T L, et al. North Atlantic deep water production during the last glacial maximum [J]. Nature Communications, 2016, 7: 11765. doi: 10.1038/ncomms11765
[63] Jaccard S L, Galbraith E D, Martínez-García A, et al. Covariation of deep Southern Ocean oxygenation and atmospheric CO2 through the last ice age [J]. Nature, 2016, 530(7589): 207-210. doi: 10.1038/nature16514
[64] Sigman D M, Hain M P, Haug G H. The polar ocean and glacial cycles in atmospheric CO2 concentration [J]. Nature, 2010, 466(7302): 47-55. doi: 10.1038/nature09149
[65] Sun Y B, Clemens S C, An Z S, et al. Astronomical timescale and palaeoclimatic implication of stacked 3.6-myr monsoon records from the Chinese Loess Plateau [J]. Quaternary Science Reviews, 2006, 25(1-2): 33-48. doi: 10.1016/j.quascirev.2005.07.005
[66] Rea D K, Snoeckx H, Joseph L H. Late Cenozoic eolian deposition in the north Pacific: Asian drying, Tibetan uplift, and cooling of the northern hemisphere [J]. Paleoceanography and Paleoclimatology, 1998, 13(3): 215-224.
[67] Zhang Q, Liu Q S, Roberts A P, et al. Mechanism for enhanced eolian dust flux recorded in north Pacific Ocean sediments since 4.0 Ma: Aridity or humidity at dust source areas in the Asian interior? [J]. Geology, 2019, 48(1): 77-81.
[68] Serno S, Winckler G, Anderson R F, et al. Eolian dust input to the subarctic north Pacific [J]. Earth and Planetary Science Letters, 2014, 387: 252-263. doi: 10.1016/j.jpgl.2013.11.008
-
期刊类型引用(1)
1. 马瑞琦,曹运诚,何雯,郑子涵,朱志伟,陈多福. 南海北部东沙海域GMGS2-16站位25 ka以来水合物稳定带和流体超压变化. 海洋地质前沿. 2025(01): 21-30 .  百度学术
百度学术
其他类型引用(0)


计量
- 文章访问数: 1912
- HTML全文浏览量: 595
- PDF下载量: 61
- 被引次数: 1