Radiolarian distribution in surface sediments of the Philippine Sea and adjacent areas and its response to environment
-
摘要: 为了解菲律宾海放射虫的区域分布特色,利用同样的样品处理方法,对菲律宾海及其邻近海域的44个表层沉积样中的放射虫进行对比分析,鉴定统计了500个属种,物种多样性较高。菲律宾海表层沉积物中放射虫的群落结构和丰度变化幅度较大,反映了菲律宾海更为复杂的区域生态环境或沉积环境;南海北部放射虫丰度非常高且罩笼虫目占据较大优势,表明南海北部区域营养盐和生物生产力较高;冲绳海槽放射虫丰度相对较低且泡沫虫目占据绝对优势,推测冲绳海槽的海底沉积环境可能不利于放射虫壳体的埋藏富集。RDA分析结果显示暖水种在冲绳海槽的分布与夏季125 m温度呈明显的正相关,可能与夏季黑潮次表层水的影响有关;在南海北部,暖水种的分布主要受冬季75 m硅酸盐和夏季200 m磷酸盐的影响控制,说明高浓度的硅酸盐可能更加有利于罩笼虫目的发育繁殖;菲律宾海主要是次表层水的环境因子影响着放射虫暖水种的分布,比如75 m冬季盐度、200 m年均溶解氧含量和125 m夏季温度。此外,菲律宾海中深层水(1000~3000 m)不同层深66个环境变量和生活于该水体中的5个冷水种的RDA分析结果,显示菲律宾海北部区域主要与1000 m硅酸盐浓度呈显著正相关,可能与富含硅酸盐的北太平洋中深层水南下进入菲律宾有关;而在菲律宾海中南部的分布则主要与1000 m硅酸盐浓度呈显著负相关,与2 000 m溶解氧和2200 m磷酸盐和硝酸盐呈明显正相关,可能与具有高溶解氧低硅酸盐性质的绕极深层水由南端进入菲律宾海后,一部分水体向上进入菲律宾海中层水有关。
-
关键词:
- 放射虫暖水种和冷水种 /
- 环境变量 /
- RDA分析 /
- 表层沉积物 /
- 菲律宾海及其邻近海域
Abstract: In order to understand the distribution pattern of radiolarians in the Philippine Sea, this article, based on a unified method for sample processing and analysis, made analysis and comparison of radiolarians for 44 surface sediment samples taking from the Philippine Sea and its adjacent regions. A total of 500 radiolarians species are identified, suggesting a very high species diversity. The community structure and abundance of radiolarians in the surface sediments of the Philippine Sea vary greatly, suggesting complex regional ecological or sedimentary environments. The abundance of radiolarians dominated by Nassellaria is also very high in the northern South China Sea, indicating that the northern South China Sea is rich in nutrients and high in biological productivity. However, the radiolarian abundance, dominated by Spumellaria, is relatively low in the Okinawa Trough. It is speculated that the submarine environment of the Okinawa Trough is not so conducive to the accumulation and preservation of radiolarian shells. 8 warm water species group living in the euphotic layer and 162 environmental variables at different depths of the 0~200 m water layers are selected for RDA analysis. The results show that the distribution of these warm water species in the Okinawa Trough is significantly positively correlated with the summer temperature in 125 m of water depth, probably owing to the influence of the summer Kuroshio subsurface water. The distribution of warm water species in the northern South China Sea is mainly affected by winter silicate of 75 m and summer phosphate of 200 m. It means that high-concentration silicate is more conducive to the production of Nassellaria. In the Philippine Sea, however, environmental factors mainly in the subsurface water affect the distribution of warm water species, such as winter salinity of 75 m, 200 m annual dissolved oxygen content and summer temperature of 125 m. In addition, the RDA analysis results of 66 environmental variables at different depths of the medium-deep water (1000~3000 m) of the Philippine Sea and 5 cold water species living in this layer show that the northern Philippine Sea is mainly positively correlated with the silicate concentration of 1000 m. This may be related to the fact that the silicate-rich intermediate-deep water mass of the North Pacific moving southward into the Philippine Sea. The distribution in the central and southern part of the Philippine Sea is mainly negatively correlated with the concentration of silicate at 1000 m, and is significantly positively correlated with dissolved oxygen at 2000 m. It may be related to the Circumpolar Deep Water with high dissolved oxygen content and low silicate entering from the southern end of the Philippine Sea, and part of the water upwardly enter the intermediate layer of the Philippine Sea. -
海底浊流作为密度流或重力流的一种[1],是将陆地沉积物、有机碳和营养物质输送到深海的主要机制[2]。海底峡谷是浊流携带沉积物向深海输运的重要通道[3-4],浊流在峡谷中的沉积体能够延伸几百公里,厚度可达几十米,是良好的捕油、储油场所[5-7]。然而,高流速、强携沙能力的海底浊流会对海底通信电缆、海底管道等结构物造成严重危害。如2009年高屏峡谷曾发生线缆断裂事件,台风莫拉克的登陆引发暴雨导致高屏河水沉积物含量大大增加,在洪水期间形成了一个高密度流并沿着峡谷向下流动,导致两条电缆损坏,而三天后在河流水位恢复正常的情况下,却形成了第二次更具破坏力的沉积物密度流,导致了至少6根电缆断裂[8]。考虑到浊流的速度主要受其含沙量影响,如果两股浊流发生汇流,可能会使汇流后的浊流含沙量增大,进而导致其流速增大、破坏力增强。同时,高屏峡谷附近的枋寮峡谷是一个潜在的沉积物来源,因此推测更具破坏力的第二次沉积物流可能是由高屏峡谷和枋寮峡谷产生的两股浊流汇流后形成的。
海底峡谷根据地貌特征可分为单支型与树枝型海底峡谷体系[9],相较于单支型海底峡谷,树枝型海底峡谷体系多分布于构造活跃陆缘,具有活动性强和覆盖面积广等特征。中国南海海域就分布着多个分支型峡谷,在北部海底峡谷群中,台湾峡谷是典型的“Y”型峡谷,峡谷上段有两个主要分支[10];澎湖峡谷则是一个头部分支较多的峡谷,上段主要由3个分支组成[11];分布在东沙海域的峡谷也是一个典型的树枝型峡谷体系,该体系由一个主干峡谷和三个分支峡谷所构成[8];菲律宾北海岸的Malaylay峡谷是由多个海底峡谷向下游汇聚而成的一个主峡谷,曾出现强烈的浊流导致海底管道断裂事件[12]。可见树枝型海底峡谷分布广阔,因此浊流的汇流现象也可能是普遍存在的。现有研究多聚焦于单支峡谷中的浊流运动[13-14],但多股浊流发生汇流后可能会产生更大的破坏力,会对海底电缆、海底管道等结构物造成更严重的危害。
由于浊流具有突发性和强破坏力特征,对高速、偶发性的浊流进行实地观测的难度较大[7],因此研究浊流的主要方式是水槽试验与数值模拟。在地质学家Forel[15]最早提出了浊流概念后,Kuenen[16]通过固定坡水槽试验对Forel关于“浊流”的野外观测进行了验证;1959年浊流的深度平均特征首次被研究,并量化了浊流的垂向速度与含沙量分布。在此基础上Felix等[17]进行了3组不同含沙量的浊流试验,结果表明浊流流速和含沙量变化的相似性取决于其含沙量和流动位置。随后各国学者相继针对浊流流速、含沙量、粒径、动力学和沉积特性等方面开展了一系列水槽试验的研究,推动了浊流理论的发展[17-19]。随着科技的发展,在浊流理论知识的支撑下,浊流的数值模拟研究也进入蓬勃发展阶段,由简单的一维模型[20]到包含流速和含沙量垂直剖面的二维[21]再到多参数的三维数值模拟[22-24],浊流的数值模型日益成熟。Sun等[25]通过建立双层平均模型发现水库中支流的高浓度泥沙会加强主通道中的浊流,从而提高泥沙冲刷能力。FLOW-3D作为一款三维流体仿真软件,因其采用特殊的计算方法可以得到多尺度、多物理场耦合下的非稳态水动力模型,从而被广泛使用。Heimsund在利用Flow-3D模拟了水槽尺度下浊流的运动特征后[26],又以蒙特利峡谷为原型进行了实际尺度的模拟,发现浊流的运动特征对地形的复杂程度非常敏感,并且模拟的速度剖面与定点观测的速度剖面具有一定的可比性[27]。
本文聚焦海底分支峡谷的浊流汇流到主干峡谷中,与主干峡谷中浊流汇流后的含沙量与速度变化问题,通过自制汇流水槽进行室内试验,并开展数值模拟分析,研究海底浊流汇流后含沙量与速度的变化,对浊流现场监测方案的制定以及实际速度的推算等给出基本的规律认识,并对浊流汇流的形成演化过程给出试验参照。
1. 室内水槽试验
利用自制的汇流水槽,配置不同含沙量的浊流在主流情景(有主流无支流)和汇流情景(有主流有支流)2种情况下进行试验,利用自制取样器获取浑水样品,得到浊流头部的含沙量,并使用流速仪获得含沙量取样点附近的流速数据,为后续建立数值模型以获得含沙量取样点处的垂向流速变化提供验证依据。
1.1 试验装置及设备
为了模拟海底峡谷浊流的汇流过程,自制水槽并制作具有一个支流的海底峡谷模型,用以开展支流浊流与主流浊流汇流的试验。水槽长300 cm、宽200 cm、高40 cm(平面型式见图1a;后面文中涉及点位位置,均以图1a所给出的坐标,以cm为单位给出数据)。海底峡谷模型利用石膏制作完成,包括主流通道(主干峡谷)和支流通道(分支峡谷),其后在石膏表面涂刷油漆。本文是对浊流汇流后的含沙量和速度变化进行初步定性分析,因此在试验过程中固定通道的宽深比,地形坡度的选取则参考了南海北部陆坡海底峡谷的坡度数据,该区域峡谷地形起伏相对平缓,坡度通常在1.5°左右[28],因此本模型地形坡度也选为1.5°左右,模型地形等高线见图1b。模型一侧设置有浊流储流区,支流浊流储流区域尺寸为长50 cm×宽40 cm×高40 cm,主流浊流储流区域尺寸为长100 cm×宽50 cm×高40 cm(见图1a),储流区与外侧流动区用隔板分开,通过抽出插板可以实现浊流的释放。
![]() 图 1 海底峡谷汇流模型概况图a:模型平面布置图,b:模型地形等高线图。Figure 1. Image of the submarine canyon confluence modela: top view of the model, b: model terrain contours.
图 1 海底峡谷汇流模型概况图a:模型平面布置图,b:模型地形等高线图。Figure 1. Image of the submarine canyon confluence modela: top view of the model, b: model terrain contours.浊流含沙量测量采用取样后泥沙沉淀烘干法测量。取样采用自制的插板封闭分层取样盒(图2),材质为有机玻璃,壁厚0.5 cm。取样盒自底向上每4 cm分为一层,宽度4 cm,长度10 cm,其长度方向顺浊流流动方向布置,上下游侧利用插板封闭水体,实现取样。试验时,在浊流释放前,将取样盒放置在取样点位置(图1a),取样点S1是浊流汇流处,位置为(130,100),取样点S2是浊流汇流后的继续流动点,位置为(120,90),浊流释放后,当浊流的头部刚好到达取样盒的末端时,快速插入取样盒的插板,封闭浊流水体,然后取出,通过根据层高逐渐提拉一侧插板以获得分层的浊流水体。预试验已知浊流在流动区主要为近底流动,设置的取样盒高度可覆盖浊流高度。
浊流速度测量使用挪威Nortek AS公司生产的Vector多普勒流速仪,布设位置见图1a,vA点位置为(150,90)、vB点位置为(190,90)。试验用土为黏土和粉土。黏土为高岭土,其中值粒径d50为3.7 μm。粉土为来源于黄河三角洲的原土,经晒干、碾碎、过筛去除杂质之后进行颗粒分析,黏粒含量为8.8%。配置沉积物流时,粉土与黏土的质量比为1∶1,混合后的土样经处理分析得到粒度级配曲线(图3)。
1.2 试验工况及流程
试验采用对照的方法,在主流情景和汇流情景两种情况下,配置不同含沙量的浊流进行试验,工况见表1。
表 1 试验浊流初始含沙量配置表Table 1. Configuration in initial sand content in the turbidity current experiment序号 试验情景 浊流含沙量/(g/L) 主流 支流 1 主流 100 0 2 汇流 100 100 3 主流 200 0 4 汇流 200 200 5 主流 300 0 6 汇流 300 300 7 主流 400 0 8 汇流 400 400 9 主流 500 0 10 汇流 500 500 试验采用抽板法制造浊流。每次试验开展前,在流动区注入清水的同时,向储流区注入如表1配置的浊流浑水体,保持储流区与流动区水面齐平。开展的10次试验,水位高度均设置在距底25 cm。释放浊流前,不断搅动储流区的浊流浑水体,以避免泥沙沉降。浊流体搅拌均匀后静置5 s左右,可使浊流体液面无明显晃动,然后迅速抽出储流区的插板,进行浊流的释放。当浊流到达取样点S1、S2处获取浑水样品,并保存在样品瓶中,经静置、烘干等处理后获得含沙量数据。多普勒流速仪在释放浊流前开机保持测量状态直至1次试验结束。
1.3 试验结果
在主流情景和汇流情景两种情况下,将取得的浊流样品进行处理后,得到浊流头部含沙量数据(图4、图5)。图4给出取样点S1、S2处的总含沙量(为浊流分层含沙量的总和)与配置的储流区浊流体含沙量之间的关系。在两种情景下,总含沙量均随着初始含沙量的增加而增大,汇流情景明显比主流情景的要大。试验条件范围内,汇流情景与主流情景相比,含沙量在S1点处增加53%~153%,在S2点处增加18%~53%。总含沙量在汇流与主流情景下在汇流点S1处浊流含沙量的差值,要明显大于浊流继续流动的S2处。
![]() 图 4 总含沙量随初始配置浊流含沙量的变化a:汇流点S1, b:继续流动点S2。Figure 4. Variation in total sand content with initial configurated turbidity currents sand contenta: Confluence point S1, b: continued flow point S2.
图 4 总含沙量随初始配置浊流含沙量的变化a:汇流点S1, b:继续流动点S2。Figure 4. Variation in total sand content with initial configurated turbidity currents sand contenta: Confluence point S1, b: continued flow point S2.![]() 图 5 主流和汇流情景下浊流各层含沙量随初始浊流含沙量的变化a:100 g/L,b:200 g/L,c:300 g/L,d:400 g/L,e:500 g/L。Figure 5. Variation in sand content in each layer of turbidity currents with initial turbidity currents sand content in main flow and confluence scenarios
图 5 主流和汇流情景下浊流各层含沙量随初始浊流含沙量的变化a:100 g/L,b:200 g/L,c:300 g/L,d:400 g/L,e:500 g/L。Figure 5. Variation in sand content in each layer of turbidity currents with initial turbidity currents sand content in main flow and confluence scenarios图5给出主流情景和汇流情景两种情况下,不同初始含沙量的浊流在取样点S1、S2处分层含沙量的变化情况(分层及样品编号见表2)。数据结果表明,泥沙主要分布在底层和中层,其中底层是高浓度含沙层。主流情景时,S1和S2位置的底层含沙量相近,S2的中层含沙量大于S1,上层含沙量接近于0。发生汇流情景时,在取样点S1、S2处的各层含沙量均大于只有主流时的各层含沙量,其中,中层含沙量的增幅最大,而且S1处的各层含沙量均大于S2处的各层含沙量。另外,当发生汇流时,S1处的上层含沙量较主流情景时有所增加,但S2处的上层含沙量小于S1处的上层含沙量。
表 2 含沙量样品编号与取样盒层位对应关系Table 2. Correspondence between sand content sample serial number and sampling box layer取样盒分
层名称距底高度
范围/cmS1处各层
样品编号S2处各层
样品编号上层 8~12 S1-3 S2-3 中层 4~8 S1-2 S2-2 底层 0~4 S1-1 S2-1 通过室内试验获得了含沙量和流速数据,其中流速数据主要用于验证模型,因此本节仅给出含沙量数据结果,试验测量的流速数据结果在2.2节给出。
2. 浊流流动数值模拟
通过室内水槽试验得到了浊流发生汇流后取样点S1、S2的含沙量变化情况,为了分析浊流头部流速与含沙量间的关系,利用数值模拟建立汇流模型,并以室内水槽试验获得的vA、vB点流速来验证模型,最终获得取样点S1、S2处的垂向流速数据,进而完整描述出浊流的汇流过程。
2.1 模型建立
使用三维流体仿真软件FLOW-3D建立汇流试验的数值模型,以室内汇流水槽为原型,等比例建立几何实体模型(图6a)。计算网格全部用结构化正交网格来划分(图6b),网格大小为0.016 m,网格总数为71.82万个。
![]() 图 6 数值模拟模型构建a:模型立体图,b:网格划分。Figure 6. Construction of numerical simulation modela: model stereogram, b: meshing.
图 6 数值模拟模型构建a:模型立体图,b:网格划分。Figure 6. Construction of numerical simulation modela: model stereogram, b: meshing.2.2 模型验证
以在室内水槽试验中初始含沙量为200 g/L的浊流流速数据进行模型验证(表3),对比了浊流头部在流速测点vA、vB距底5 cm处的实测流速与模拟流速(图7)。
表 3 初始含沙量为200 g/L的浊流模拟流速最大值与试验流速最大值对比Table 3. Comparison between the maximum simulated currents velocity and the maximum experimental flow velocity for turbidity flow with initial sand content of 200 g/L项目 主流情景
vA点主流情景
vB点汇流情景
vA点汇流情景
vB点试验值/(m/s) 0.275 0.304 0.306 0.356 模拟值/(m/s) 0.270 0.291 0.305 0.351 绝对误差/(m/s) 0.005 0.013 0.001 0.006 相对误差/% 1.91 4.42 0.42 1.63 注:相对误差的计算方法为相对误差=$ \dfrac{|{\text{模拟值}}-{\text{试验值}}|}{\text{试验值}}$。 ![]() 图 7 初始含沙量为200 g/L的浊流模拟流速与实测流速对比a:vA处主流情景,b:vB处主流情景,c:vA处汇流情景,d:vB处汇流情景。Figure 7. Comparison of simulated current velocity and measured current velocity for turbidity currents with initial sand content of 200 g/La: Main current scenario at vA, b: main current scenario at vB, c: confluence scenario at vA, d: confluence scenario at vB.
图 7 初始含沙量为200 g/L的浊流模拟流速与实测流速对比a:vA处主流情景,b:vB处主流情景,c:vA处汇流情景,d:vB处汇流情景。Figure 7. Comparison of simulated current velocity and measured current velocity for turbidity currents with initial sand content of 200 g/La: Main current scenario at vA, b: main current scenario at vB, c: confluence scenario at vA, d: confluence scenario at vB.在水槽试验中仅获得了初始含沙量为100 g/L和200 g/L的浊流流速,更高初始含沙量的浊流因含沙量过高导致流速仪无法获取流速数据。初始含沙量为100和200 g/L的浊流,汇流情景相比于主流情景,vA处最大流速分别增加17%和27%,vB处最大流速分别增加21%和30%。
2.3 模拟结果
利用已建立的模型模拟浊流在汇流水槽中的运动过程,对室内试验的10种工况进行模拟,得到主流情景和汇流情景下浊流速度的变化情况。为了便于对比分析浊流发生汇流后含沙量与速度结构的关系,提取浊流到达取样点S1、S2处时沿主要流动方向即图6b中x方向的流速vx,绘制垂向速度剖面图(图8)。
![]() 图 8 浊流在取样点S1、S2处的垂向速度剖面a、c、e、g、i:S1处的垂向速度剖面;b、d、f、h、j:S2处垂向速度剖面。速度负值代表反向流动。Figure 8. Vertical velocity profiles of turbidity currents at sampling points S1 and S2a, c, e, g, i: Vertical velocity profile at S1; b, d, f, h, j: vertical velocity profile at S2. The negative values of velocity represent reverse flow.
图 8 浊流在取样点S1、S2处的垂向速度剖面a、c、e、g、i:S1处的垂向速度剖面;b、d、f、h、j:S2处垂向速度剖面。速度负值代表反向流动。Figure 8. Vertical velocity profiles of turbidity currents at sampling points S1 and S2a, c, e, g, i: Vertical velocity profile at S1; b, d, f, h, j: vertical velocity profile at S2. The negative values of velocity represent reverse flow.模拟结果表明,浊流的运动速度与浊流初始含沙量呈正相关,随着初始含沙量的增加,浊流头部的流速形态变得更加尖锐。试验条件范围内,汇流情景相比仅有主流情景,流速在S1点处增加5%~27%,在S2点处增加12%~17%。在主流情景和汇流情景2种情况下,S1处的底层最大流速均小于S2处。在汇流情景下,各层速度均大于主流情景时各层的速度,二者的差值在S1处较大,并且在8 cm高度范围内,速度差值随着距底高度的升高而加大;二者的差值在S2处变小,只有底层最大速度的差值在S1和S2处变化不大。
3. 讨论
3.1 汇流过程浊流含沙量变化
浊流按入流状态分为持续入流型和突然释放型。持续入流型浊流的形态特点是头部较小,主体较大,行进机制是高含沙量主体推动着浊流头部前进;突然释放型浊流的特点是头部较大,主体较小,行进机制是高含沙量的头部驱散前方水体,进而牵引着含沙量较低的主体前进[29]。本试验中,在抽出挡板后浊流开始形成,此时储流区内的浊流浑水还较多,因此此时在产生浊流的边界处相当于有持续性的物料输入,其前进动力的来源是含沙量较高的主体,在这个过程中,浊流的头部高度较小(图9a)。
![]() 图 9 200 g/L的浊流在主流情景时的模拟结果a:浊流到达S1处,b:浊流到达S2处。Figure 9. Simulation results of turbidity flow at 200 g/L in the main currents scenarioa: turbidity currents arrives at S1, b: turbidity currents arrives at S2.
图 9 200 g/L的浊流在主流情景时的模拟结果a:浊流到达S1处,b:浊流到达S2处。Figure 9. Simulation results of turbidity flow at 200 g/L in the main currents scenarioa: turbidity currents arrives at S1, b: turbidity currents arrives at S2.而当储流区内的浊流浑水完全流出后,浊流开始转变为突然释放型,此时浊流头部的高度开始增高,直至完全转变为突然释放型浊流的形态特征(图9b)。在主流情景下,当浊流经过S1处时,储流区内的尚未完全流出,因此此时的浊流头部高度较小,而当浊流经过S2处时,储流区内的浊流浑水已完全流出,因此浊流的头部高度有所提高,因此在含沙量数据中,S1处中层的含沙量小于S2处中层的含沙量。
当分支峡谷浊流与主干峡谷浊流发生汇流时,两股浊流头部在交叉口相遇交汇,水流和泥沙颗粒发生碰撞,水流紊动使得浊流头部高度增加。由此发生汇流情景下,取样点S1处的含沙量明显大于主流情景时的含沙量,并且由于碰撞产生的紊动作用,底层泥沙也被向上搅动,使得中层含沙量的增幅最大,而汇流时底层含沙量增加较小。在主流情景下,上层含沙量接近于0,是因为浊流高度较低,没有达到上层的高度,而在发生汇流时,浊流高度增加,因此上层含沙量也有了少量增加。
在汇流后形成的“新浊流”到达S2点时,各层的含沙量较主流情景时有明显增加,但均小于发生汇流时S1的分层含沙量(图8)。分析原因,应该是在汇流点S1,浊流由于有不同方向水流交汇产生强烈紊动,支持了泥沙在垂向上的向上悬浮,而随着汇流后向下游继续运动,在运动速度没有明显增加的情况下,水流结构不断调整趋向于层流结构,中上层泥沙失去紊动支持条件,出现过饱和而沉降。
3.2 汇流过程浊流速度变化
由于与周围水体的作用,浊流流动并非仅有水平流速,还有垂向流速,这里仅提取浊流主要流动方向的水平流速用于分析,并规定以浊流主要流动方向即图6b中的x方向为正方向。
由模拟结果可知(图10),浊流体内部速度为正方向,流体外部速度则是反方向,这是浊流在近底流动时对前方水体挤压导致的前方水体在上部返流,以达到水位高度均衡。在浊流上部与清水处,会出现水平流速等于0的界面,该界面高度可以视为浊流头部的高度。主流情景时,浊流在S2处的流速值和头部高度均大于S1处,这是由于浊流在斜坡上受到重力影响做加速运动,因而速度是逐渐增大的,同时由于浊流刚产生时属于持续输入型浊流,经过S1点后转变为突然释放型浊流,导致浊流头部形态发生变化,高度增加(图9b)。
![]() 图 10 浊流运动中的头部流场(x方向)图Figure 10. Diagram of the head current field (x-direction) in turbidity currents motion
图 10 浊流运动中的头部流场(x方向)图Figure 10. Diagram of the head current field (x-direction) in turbidity currents motion发生汇流后,浊流在S1处的流速和头部高度都大于主流情景时的流速和高度,且中上层流速增量明显大于底层流速的增量,这是由于两股浊流相遇碰撞后导致浊流头部增高和整体含沙量增大,含沙量的增加会导致浊流与周围水体的密度差增大,进而导致流速增大。而底层含沙量的增量小,中层含沙量的增量最大,这就导致了中层流速增值最大而底层流速增值较小。与S1处相比,S2处的浊流头部高度有所降低且中层速度明显减小。其中浊流头部高度降低是由于在S1处碰撞增加的中上层泥沙在流动过程中不断沉降而导致的,而沉降的上层泥沙由于距离近底高含沙量沙层较远,受到的拖曳影响较小,同时其与周围水体密度差较小,在二者的共同影响下,导致沉降的上层泥沙速度较中层泥沙速度低,当这部分泥沙以相对较低的速度沉降到中层时,会使得中层泥沙的速度降低。同时,近底含沙层因距离上层泥沙较远,未受到上述情况的影响,因此在运动过程中与主流情景时一样,其受重力影响,做加速度运动,其加速度与主流情景时相同,因此汇流情境中底层最大速度与主流情景中底层最大速度的差值在S1处与S2处的相差不大。
4. 结论
(1)发生汇流处,浊流头部的高度和含沙量均有增加,其中含沙量较低的中层含沙量增加最多,含沙量较高的底层含沙量增加较少。
(2)发生汇流处,浊流头部的速度变化与含沙量变化一致,即中层流速增加最大,底层流速增加较小。
(3)发生汇流并流动一段距离后,与汇流点处相比,浊流头部的高度有所降低,各层含沙量也均有减少,其中中层含沙量减少幅度最大,中层速度也有所减小;整体来看,各层的含沙量和速度仍大于主流情景在该处的数据。
-
![]()
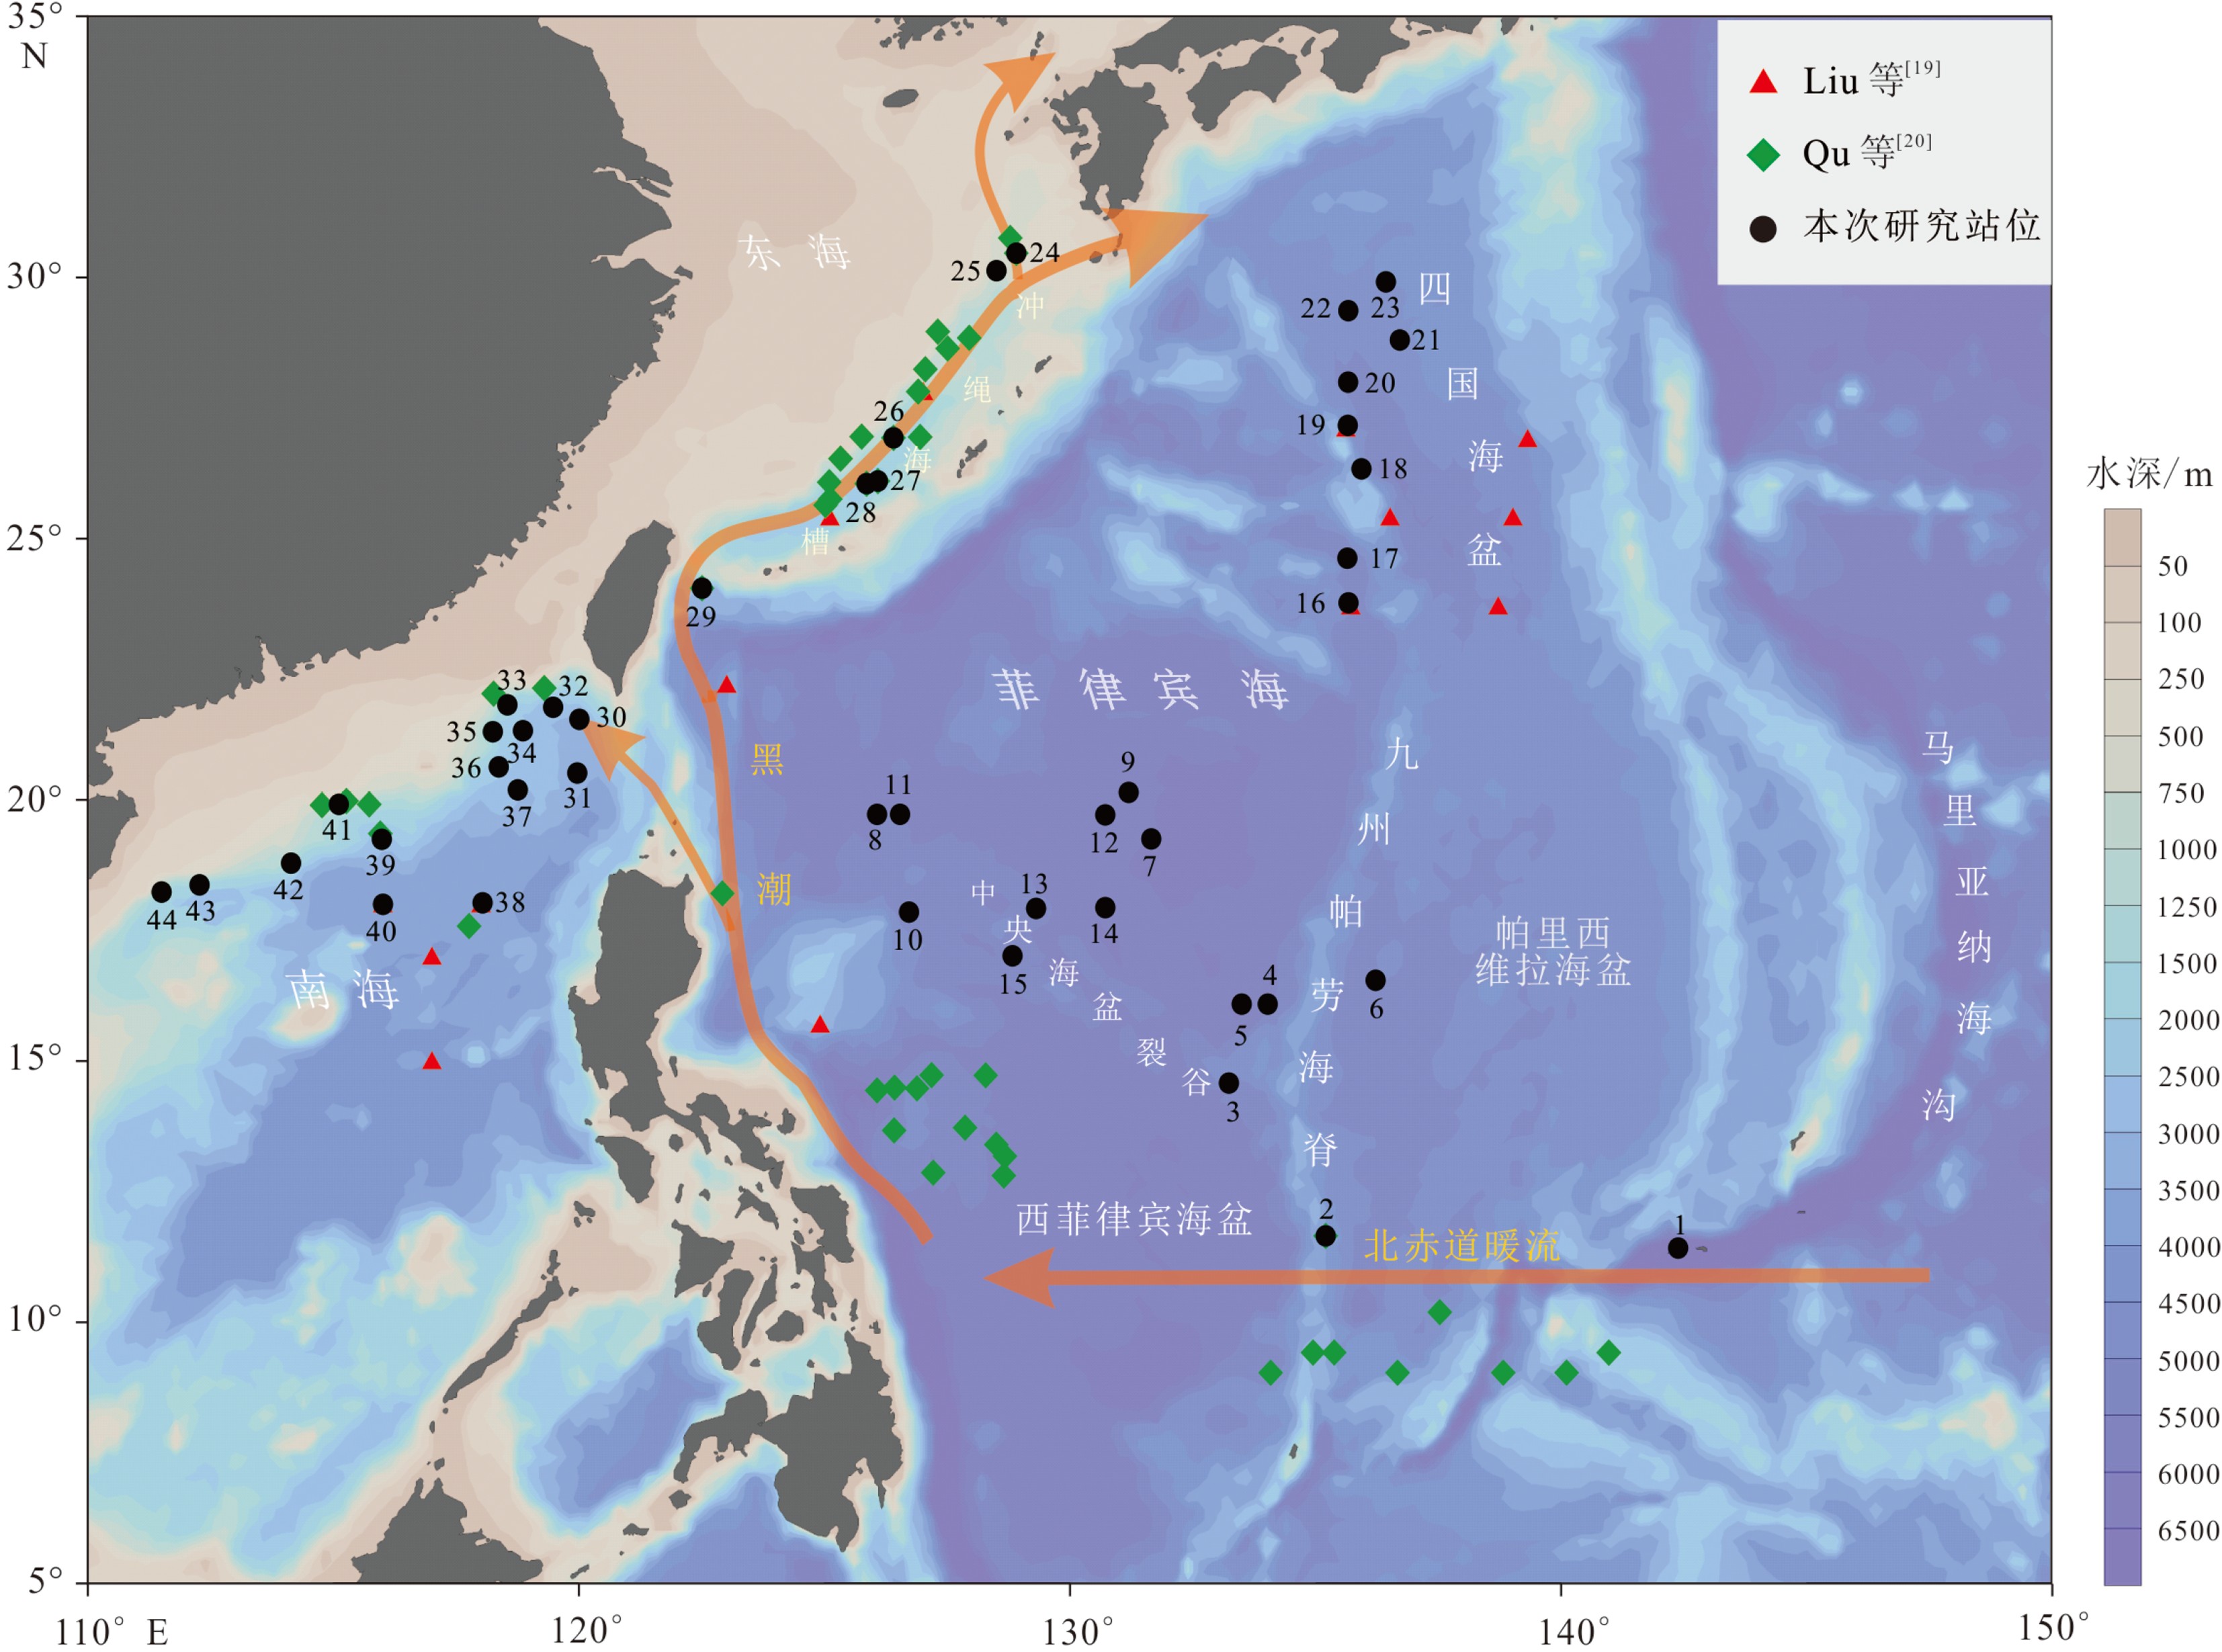
图 1 本次研究站位分布(黑色圆点所示)和以往研究站位(红色三角形和绿色菱形所示)
Figure 1. Locations of sampling sites of this research(shown by the black dots)and previous research (shown by the red triangles and the green diamond)
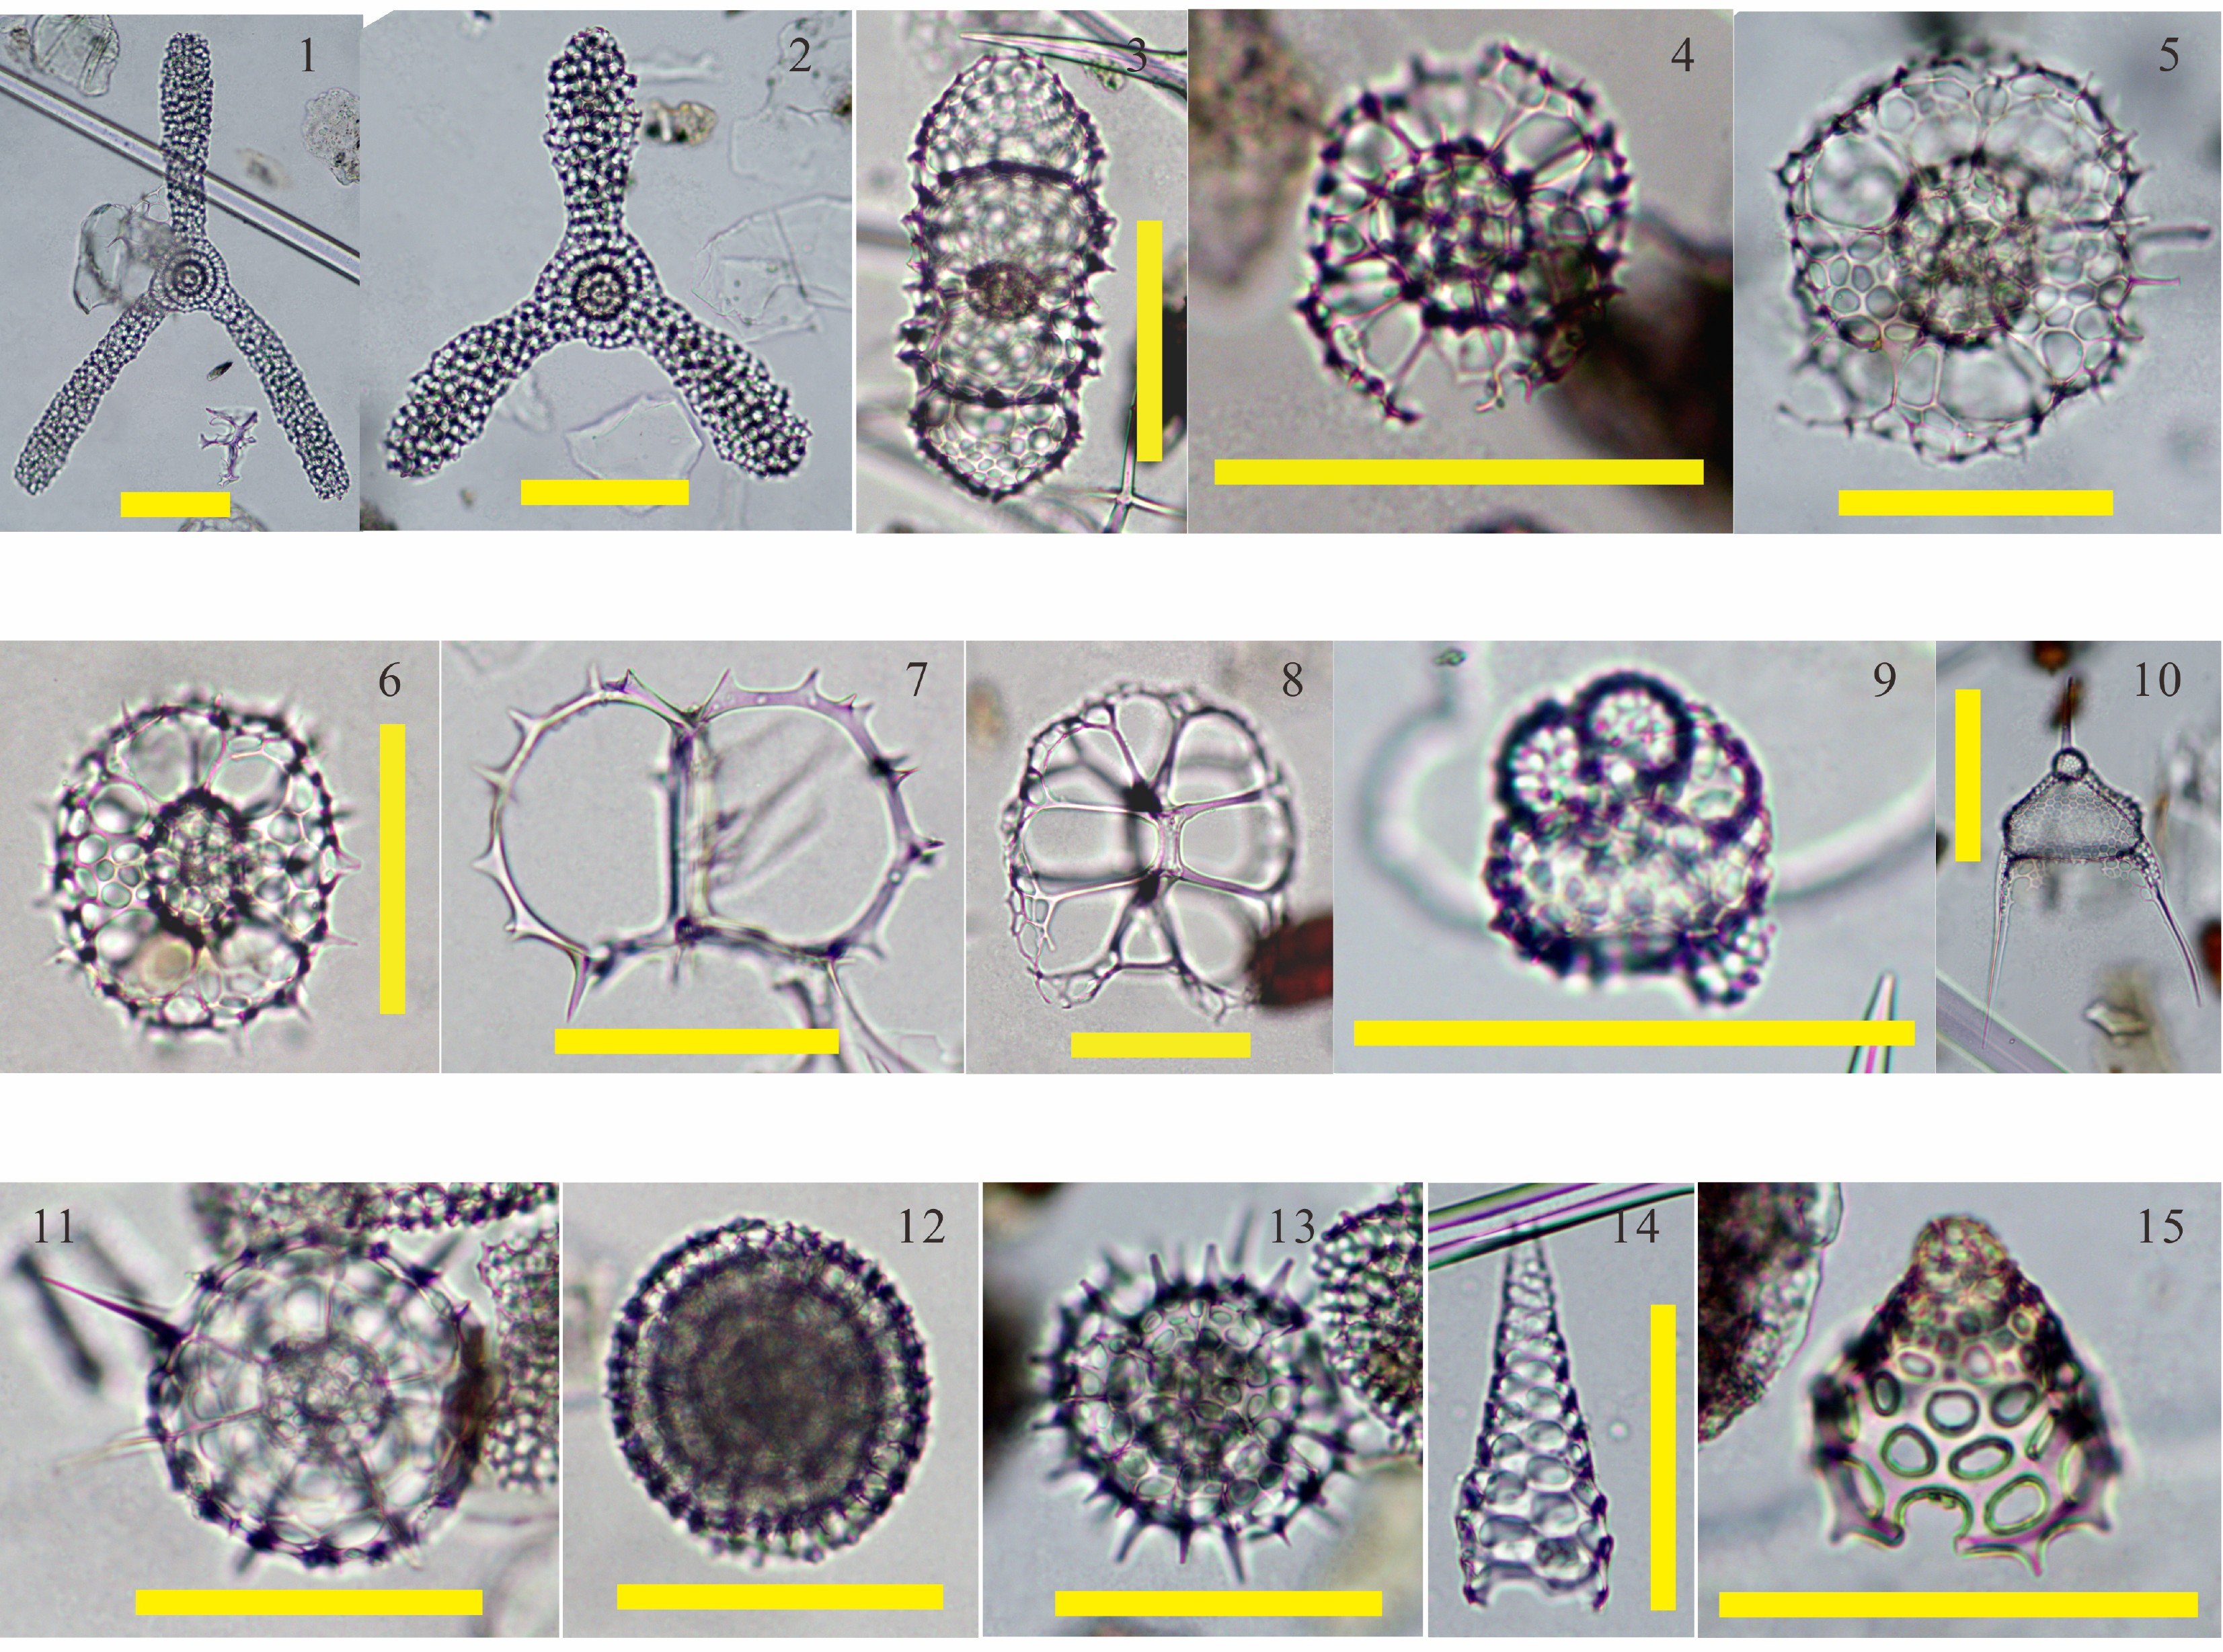
![]()
图 2 研究区部分放射虫(比例尺为100 μm)
1. Dictyocoryne elegans(Ehrenberg)(站位号29),2. Dictyocoryne muelleri(Haeckel)(站位号29), 3. Didymocyrtis tetrathalamus tetrathalamus(Haeckel)(站位号29), 4. Phorticium pylonium Zhang and Suzuki(站位号27), 5. Phorticium polycladum Tan and Tchang(站位号27), 6. Tetrapyle group(站位号29), 7. Acanthodesmia vinculata(Müller)(站位号27), 8. Amphispyris reticulata(Ehrenberg)(站位号29),9. Botryocyrtis scutum(Harting)(站位号29), 10. Pterocanium praetextum praetextum(Ehrenberg)(站位号29), 11. Actinomma leptodermum(Jørgensen)(站位号27), 12. Lithelius minor Jørgensen(站位号27), 13. Lithelius nautiloides Popofsky(站位号29), 14. Cornutella profunda Ehrenberg(站位号29), 15. Cycladophora davisiana Ehrenberg(站位号29)。
Figure 2. Some radiolarian species in the research area(Scale bars=100 μm)
![]()
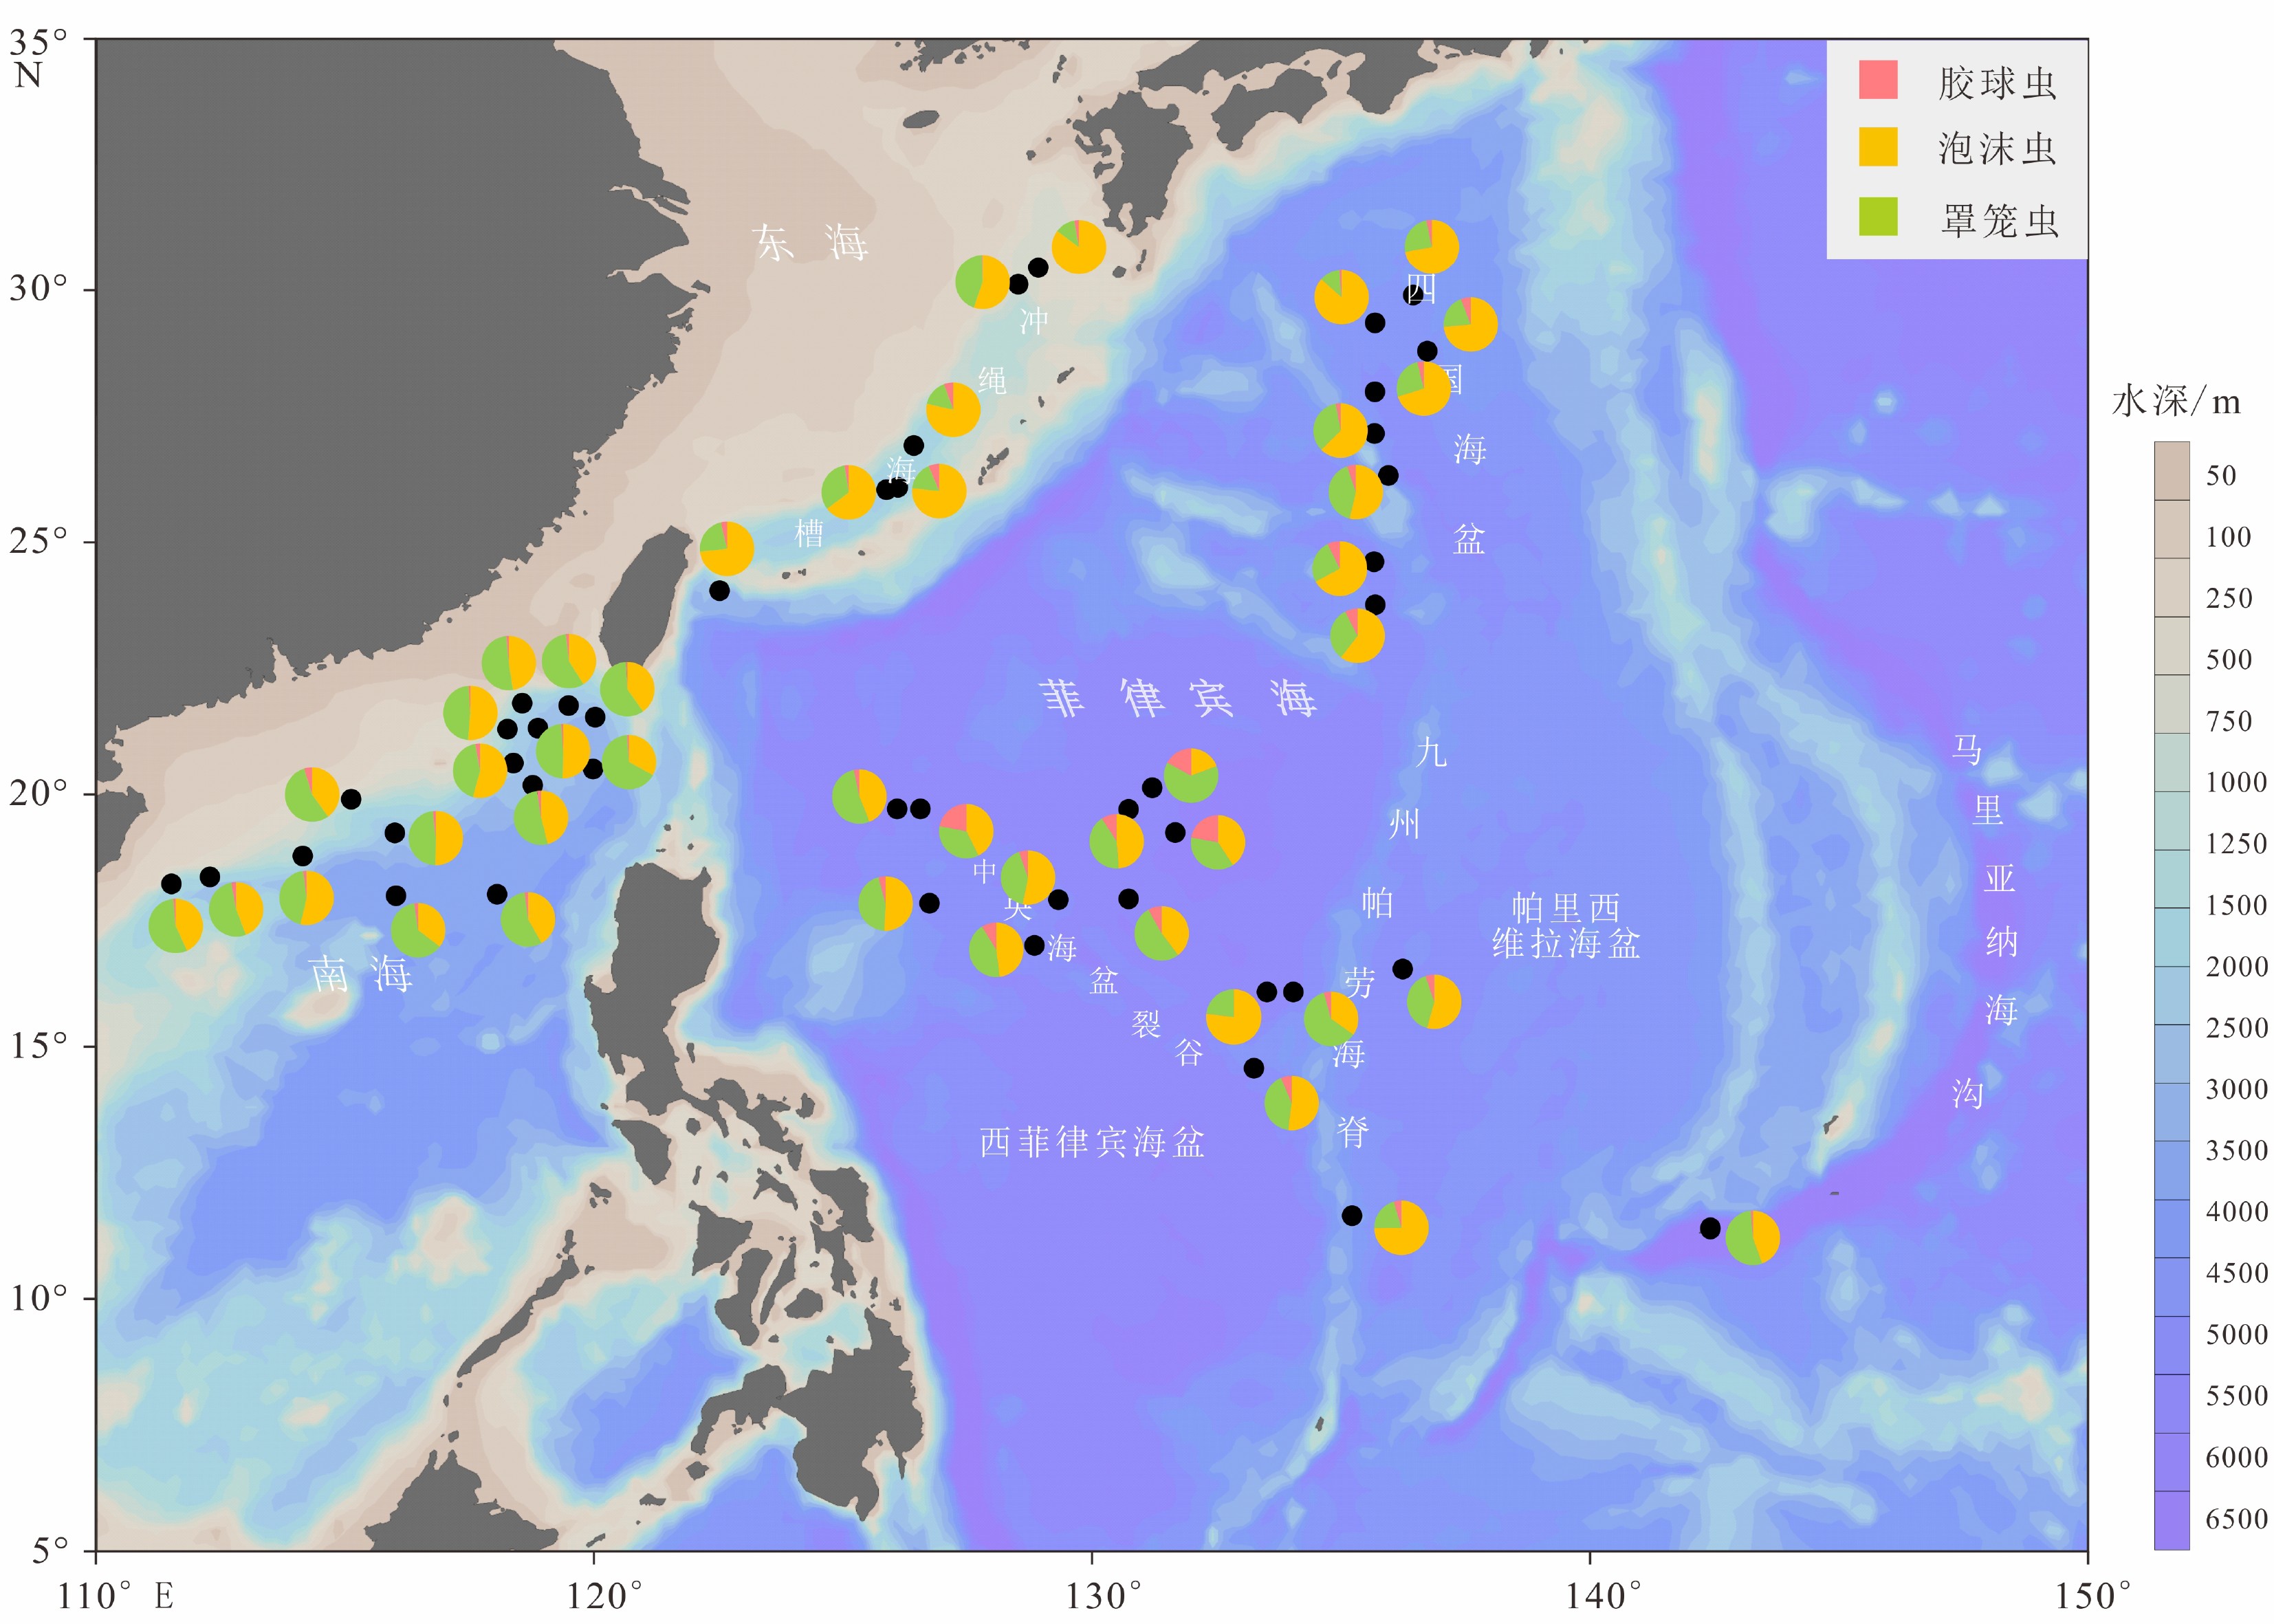
图 3 菲律宾海及其邻近海域表层沉积物中放射虫的三大类群占比分布
Figure 3. Relative abundances of three Order of radiolarians in surface sediments of the Philippine Sea and adjacent waters.
![]()
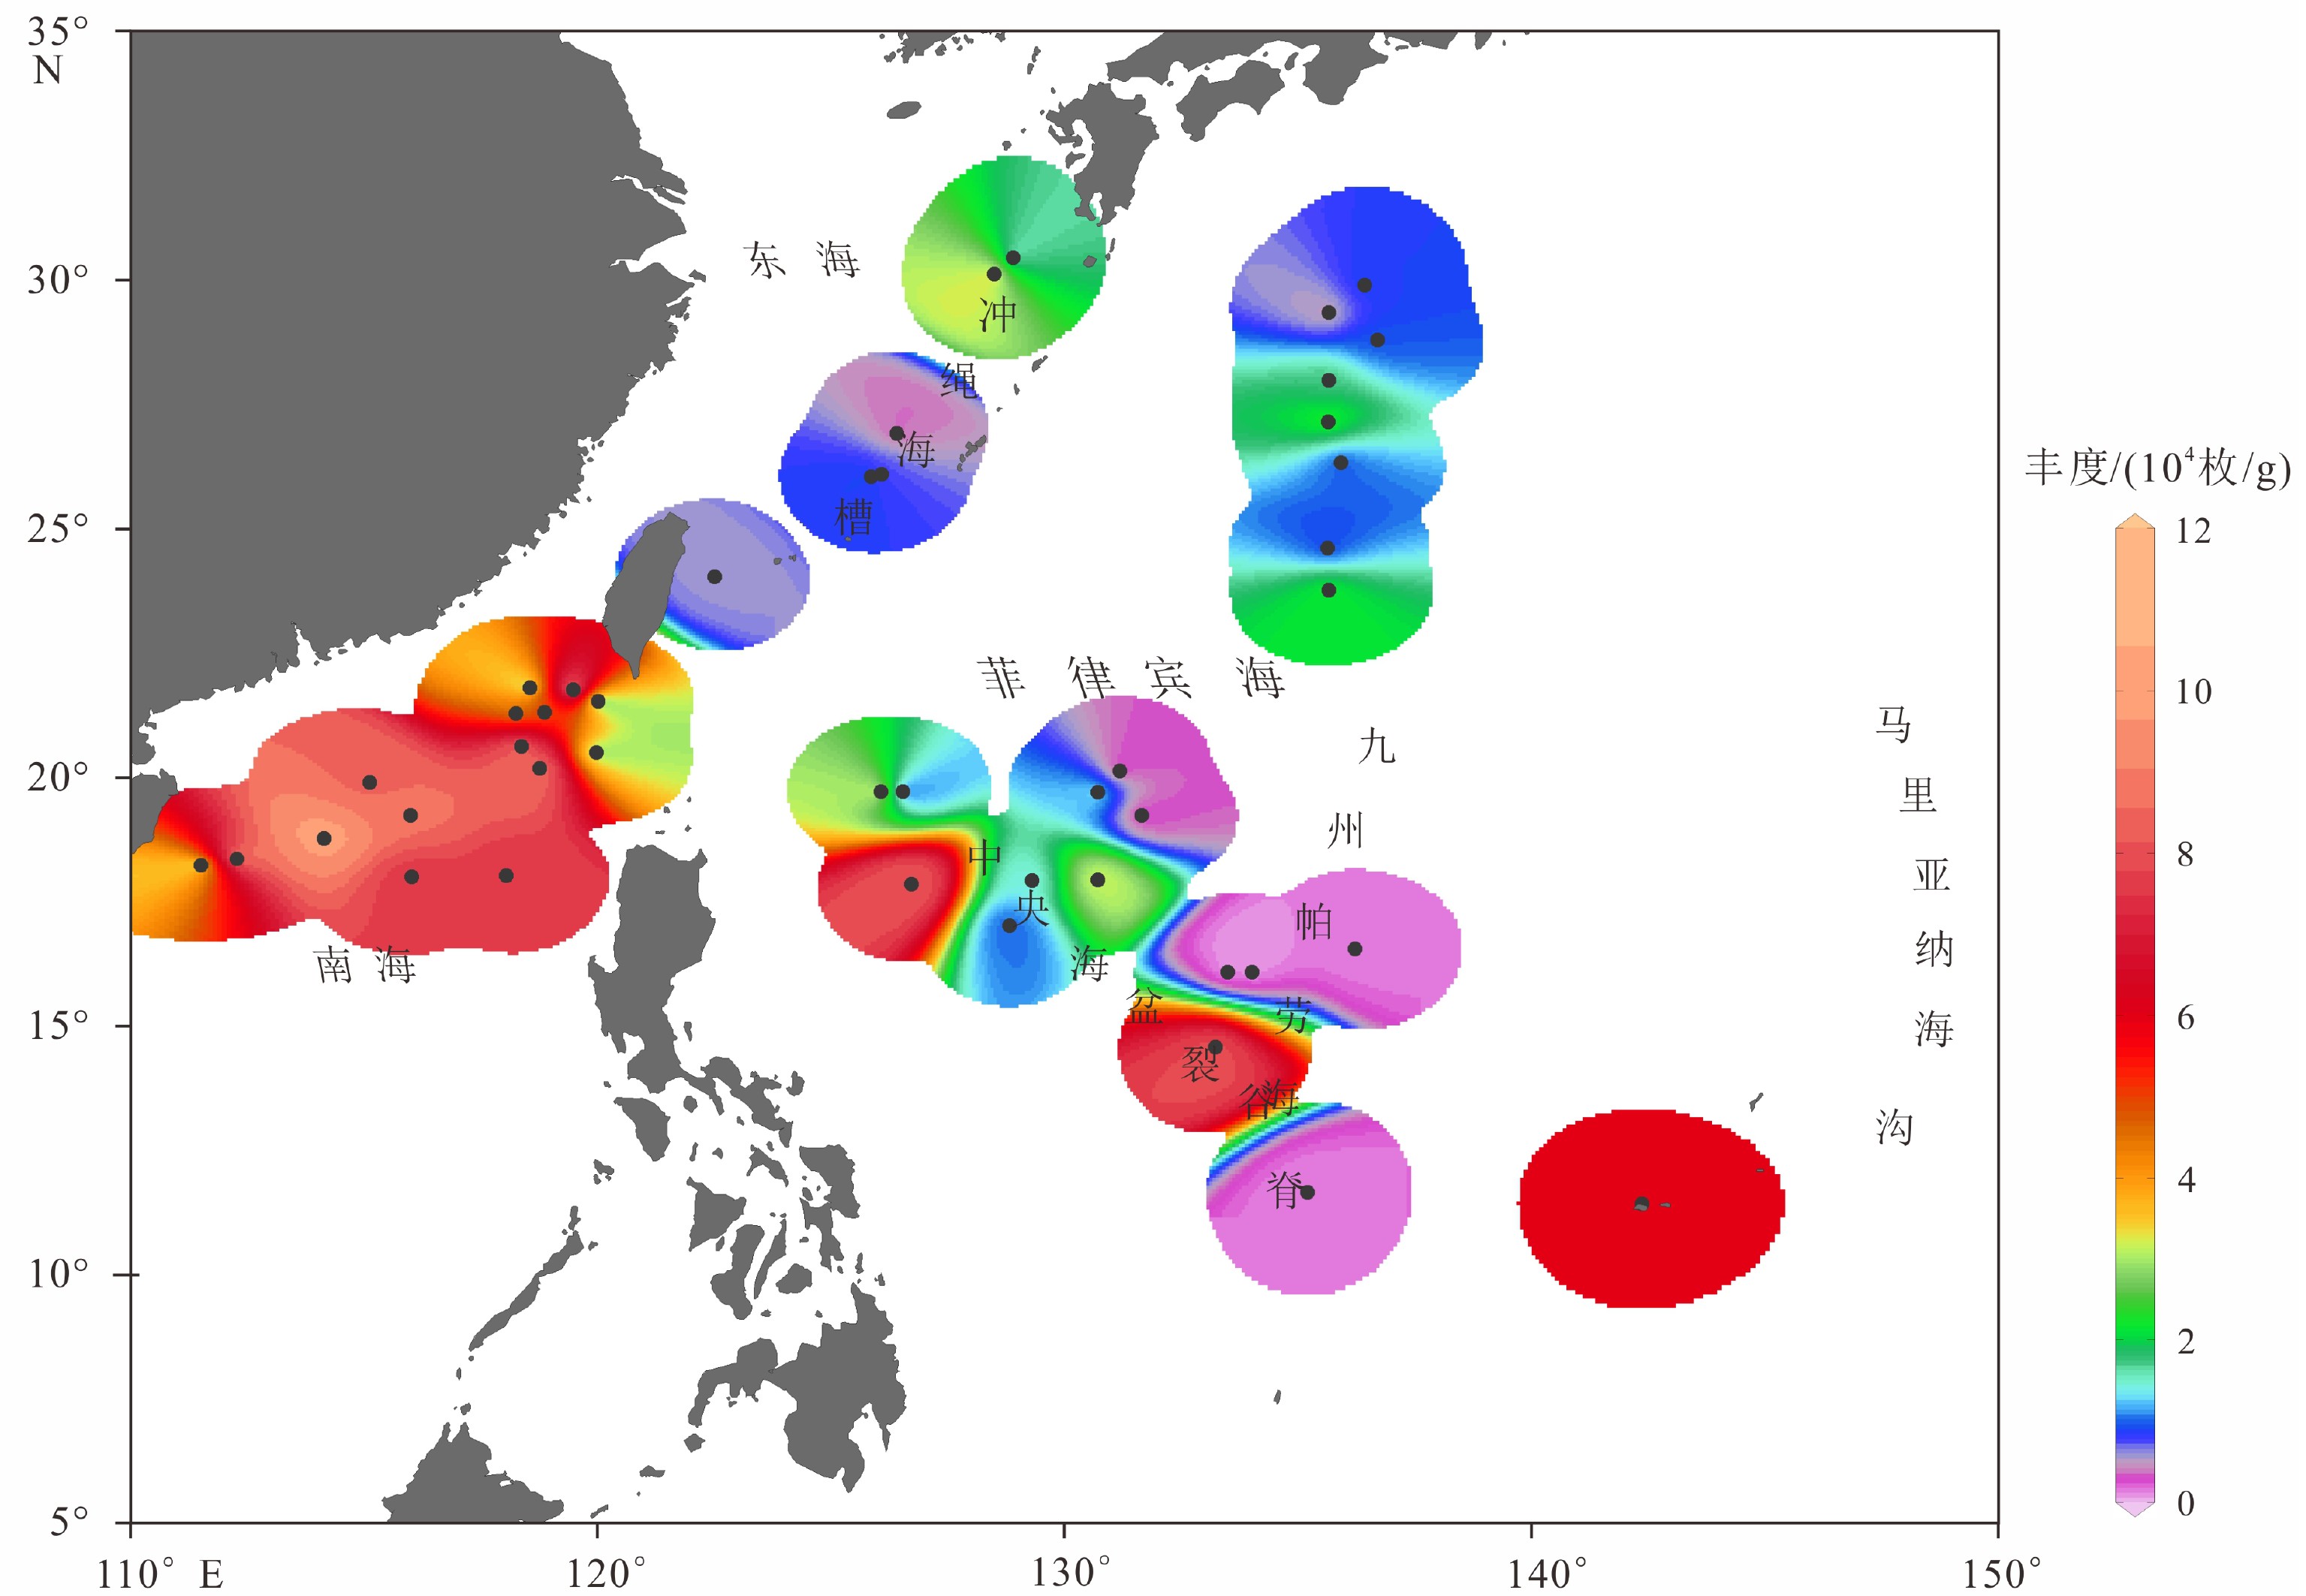
图 4 菲律宾海及其邻近海域表层沉积物中放射虫绝对丰度分布
使用Ocean Data View(ODV)(https://odv.awi.de/)绘制,采用VG网格化算法。
Figure 4. Radiolarian absolute abundance in surface sediments of the Philippine Sea and adjacent waters
The map was drawn using VG grid method by Ocean Data View(ODV)(https://odv.awi.de/).
![]()
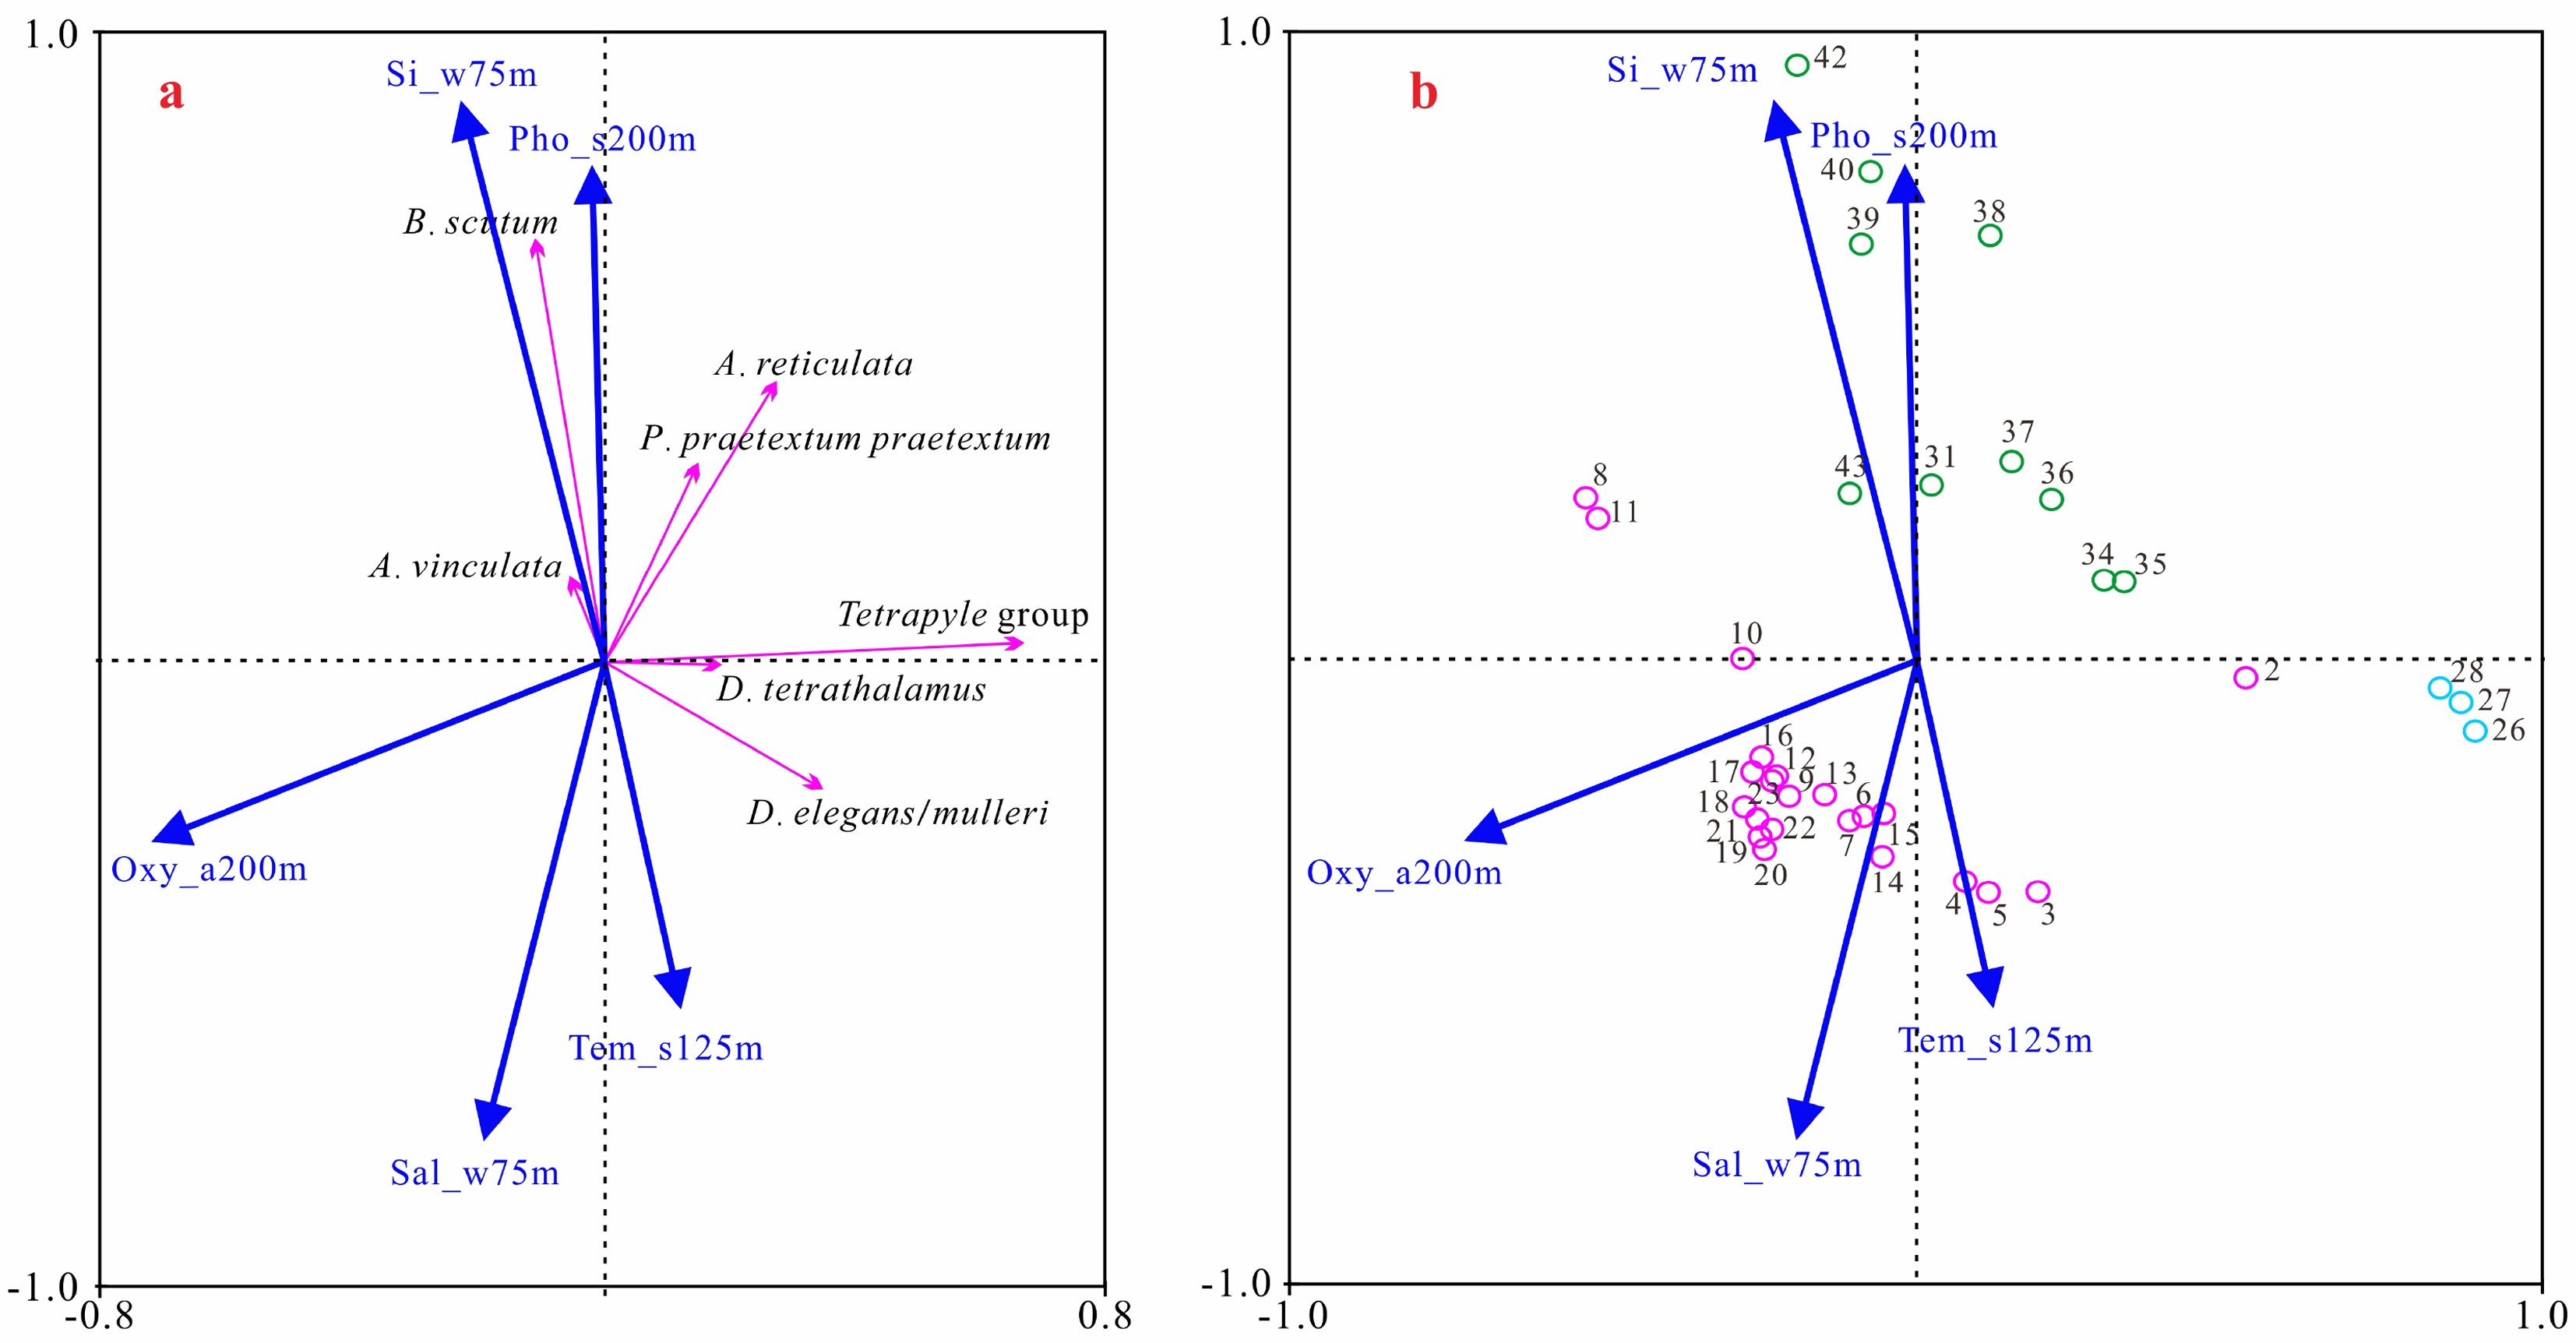
图 5 放射虫暖水种和上层水环境变量的RDA排序图
a. 物种和环境变量排序图,b. 样品和环境变量排序图。蓝色圆圈代表冲绳海槽站位,绿色圆圈代表南海站位,洋红色代表菲律宾海站位。Oxy_a200m为200 m年均溶解氧含量,Si_w75m为75 m冬季平均硅酸盐含量,Pho_s200m为200 m夏季平均磷酸盐含量,Tem_s125m为125 m夏季平均温度,Sal_w75m为75 m冬季平均盐度。
Figure 5. The sequence diagram of the RDA of warm water radiolarian species and upper water environmental variables
a. Sequence diagram of species and environmental variables, b. Sequence diagram of samples and environmental variables. The blue circle represents the station of Okinawa Trough, the green circle represents the station of South China Sea, and the magenta represents the station of Philippine Sea. Oxy_a200m is the annual mean dissolved oxygen content at 200 m, Si_w75m is the winter mean silicate content at 75 m, Pho_s200m is the summer mean phosphate content at 200 m, Tem_s125m is the summer mean temperature at 125 m, and Sal_w75m is the winter mean salinity at 75 m.
![]()
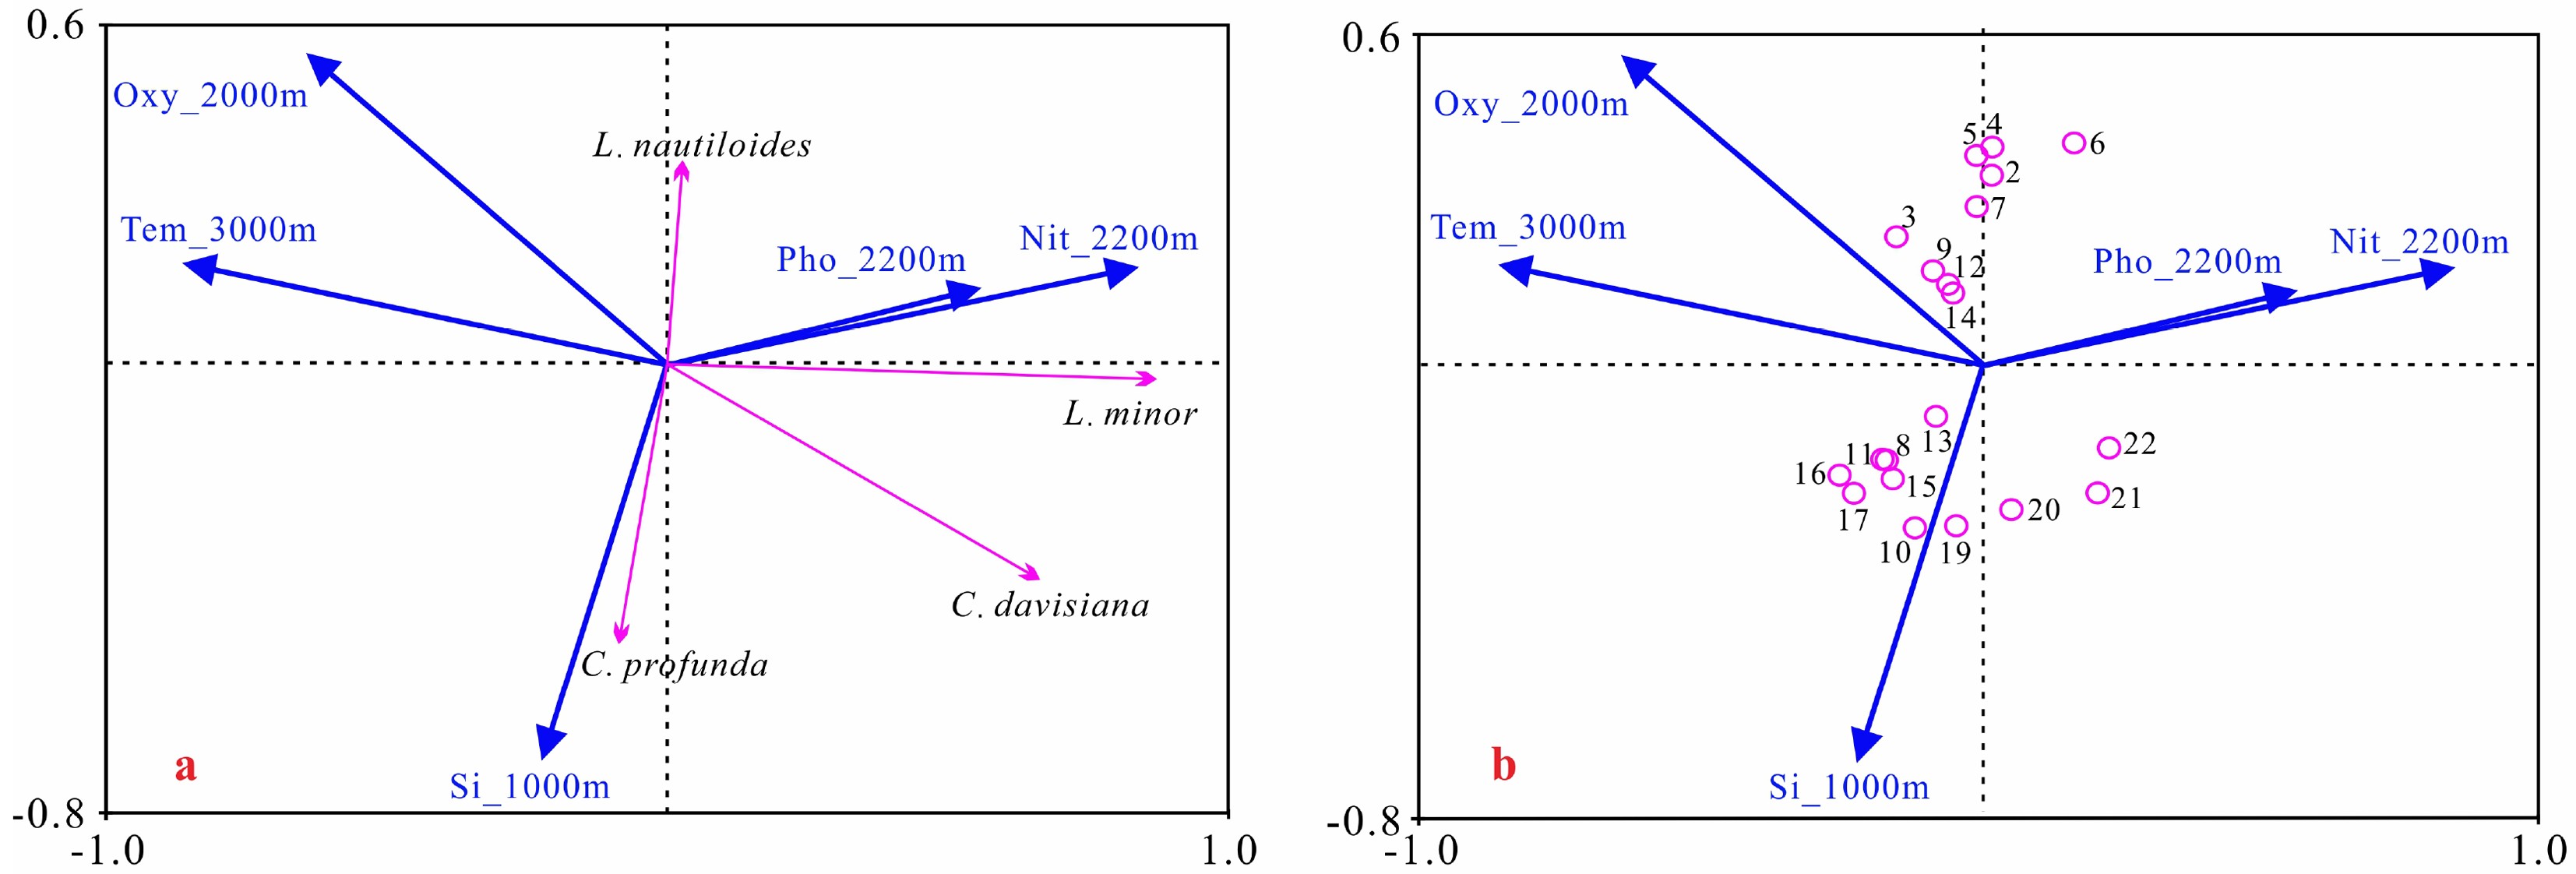
图 6 典型冷水种和中层水环境变量RDA分析排序图
a. 物种和环境变量排序图,b. 样品和环境变量排序图。Oxy_2000m为2000 m年平均溶解氧含量,Tem_3000m为3000 m年平均温度,Si_1000m为1000 m年平均硅酸盐含量,Pho_2200m为2200 m年平均磷酸盐含量,Nit_2200m为2200 m年平均硝酸盐含量。
Figure 6. RDA sequence diagram of typical cold water species and intermediate water environmental variables
a. sequence diagram of species and environmental variables, b. sequence diagram of samples and environmental variables. Oxy_2000m is the annual mean dissolved oxygen content at 2000 m, Tem_3000m is the annual mean temperature at 3000 m, Si_1000m is the anneal mean silicate content at 1000 m, Pho_2200m is the anneal mean phosphate content at 2200 m, and Nit_2200m is the anneal mean nitrate at 2200 m.
表 1 研究站位位置、水深、放射虫丰度以及放射虫三大类(泡沫虫目、罩笼虫目和胶球虫目)的相对丰度
Table 1 Sampling locations, water depths, total radiolarian abundance, and relative abundance of Spumellaria, Nassellaria, and Collodaria of three order of radiolarian
站位号 位置 水深 /m 放射虫总丰度/(枚/g) 泡沫虫目相对丰度/% 罩笼虫目相对丰度/% 胶球虫目相对丰度/% 1 11.4°N,142.36°E 10853 60051 44.52 54.30 1.18 2 11.64°N,135.19°E 4092 1061 74.90 20.59 4.51 3 14.56°N,133.22°E 5466 80634 52.11 41.48 6.40 4 16.07°N,134.01°E 5472 164 34.78 60.87 4.35 5 16.07°N,133.48°E 5370 9 76.92 23.08 0 6 16.53°N,136.21°E 5060 1181 54.31 40.52 5.17 7 19.23°N,131.64°E 6059 1703 40.70 37.21 22.09 8 19.7°N,126.06°E 5404 38204 43.91 52.88 3.21 9 20.12°N,131.18°E 5801 898 19.32 63.64 17.05 10 17.83°N,126.71°E 5380 81801 50.79 44.94 4.27 11 19.7°N,126.53°E 4882 2325 42.65 35.29 22.06 12 19.69°N,130.7°E 5761 14866 48.82 42.01 9.17 13 17.9°N,129.3°E 5307 13600 53.21 41.44 5.35 14 17.92°N,130.71°E 5708 32243 39.71 52.17 8.12 15 16.99°N,128.82°E 5505 9293 48.04 43.20 8.76 16 23.74°N,135.65°E 5270 21952 60.51 31.94 7.54 17 24.6°N,135.63°E 5370 8269 67.19 25.52 7.29 18 26.31°N,135.92°E 5392 8711 62.21 31.57 6.22 19 27.14°N,135.64°E 5050 23250 62.57 34.67 2.76 20 27.97°N,135.65°E 4865 17102 70.22 25.93 3.86 21 28.77°N,136.7°E 4560 9257 73.62 20.41 5.96 22 29.34°N,135.65°E 4439 3766 86.53 12.03 1.43 23 29.89°N,136.42°E 4725 8901 72.12 24.65 3.23 24 30.44°N,128.89°E 781 10235 85.24 11.99 2.77 25 30.1°N,128.49°E 885 37924 55.23 44.40 0.37 26 26.9°N,126.39°E 1266 3045 78.58 15.83 5.59 27 26.08°N,126.08°E 2044 6414 76.65 16.95 6.40 28 26.03°N,125.85°E 2064 10062 64.74 32.76 2.50 29 24.03°N,122.5°E 1800 5740 73.34 22.96 3.70 30 21.52°N,120°E 3010 7053 40.30 58.96 0.75 31 20.49°N,119.96°E 3347 23908 32.93 65.87 1.20 32 21.75°N,119.47°E 2709 115522 41.09 57.17 1.74 33 21.79°N,118.54°E 2049 18319 47.58 50.97 1.45 34 21.3°N,118.85°E 2620 46887 50.30 48.49 1.21 35 21.28°N,118.24°E 2184 41087 51.43 47.43 1.14 36 20.61°N,118.36°E 2540 90291 54.19 43.01 2.80 37 20.17°N,118.75°E 2893 90042 46.12 51.53 2.35 38 18.01°N,118.03°E 3888 75833 41.76 56.26 1.98 39 19.22°N,115.98°E 2612 86607 50.31 47.84 1.86 40 17.98°N,116°E 3865 75229 35.37 62.44 2.20 41 19.89°N,115.11°E 1182 83800 40.10 55.13 4.77 42 18.77°N,114.13°E 1575 100490 53.66 44.39 1.95 43 18.35°N,112.27°E 1564 101667 44.26 52.82 2.91 44 18.21°N,111.5°E 1808 17314 43.18 55.33 1.50  下载: 导出CSV
表 2 菲律宾海放射虫组合和环境变量的RDA分析结果
Table 2 RDA results of radiolarian assemblage and environmental variables in the Philippine Sea(I for warm species-upper environments, II for cold species-intermediate environments)
类型 参数 轴1 轴2 轴3 轴4 总方差 I 特征值 0.325 0.063 0.03 0.006 1 物种-环境相关性 0.676 0.686 0.614 0.489 变量累积百分比 物种数据 32.5 38.8 41.8 42.4 物种-环境关系 76.3 91.1 98.2 99.5 所有特征值总和 1 所有典范特征值总和 0.426 II 特征值 0.268 0.113 0.052 0 1 物种-环境相关性 0.87 0.554 0.455 0.271 变量累积百分比 物种数据 26.8 38.1 43.2 43.3 物种-环境关系 61.9 88 99.9 100 所有特征值总和 1 所有典范特征值总和 0.433 注:I 暖水种-上层水环境因子,II 冷水种-中深层水环境因子。
下载: 导出CSV
-
[1] Gallinari M, Ragueneau O, Corrin L, et al. The importance of water column processes on the dissolution properties of biogenic silica in deep-sea sediments I. Solubility [J]. Geochimica et Cosmochimica Acta, 2002, 66(15): 2701-2717.
[2] Hu W F, Zhang L L, Chen M H, et al. Distribution of living radiolarians in spring in the South China Sea and its responses to environmental factors [J]. Science China Earth Sciences, 2015, 58(2): 270-285.
[3] Itaki T. Depth-related radiolarian assemblage in the water-column and surface sediments of the Japan Sea [J]. Marine Micropaleontology, 2003, 47(3-4): 253-270.
[4] Kamikuri S I, Moore T C. Reconstruction of oceanic circulation patterns in the tropical Pacific across the early/middle Miocene boundary as inferred from radiolarian assemblages [J]. Palaeogeography, Palaeoclimatology, Palaeoecology, 2017, 487: 136-148.
[5] Sandoval M I, Boltovskoy D, Baxter A T, et al. Neogene paleoceanography of the eastern equatorial Pacific based on the radiolarian record of IODP drill sites off Costa Rica [J]. Geochemistry, Geophysics, Geosystems, 2017, 18(3): 889-906.
[6] 陈木宏, 张兰兰, 张丽丽, 等. 南海表层沉积物中放射虫多样性与丰度的分布与环境[J]. 地球科学—中国地质大学学报, 2008, 33(4):431-442. [CHEN Muhong, ZHANG Lanlan, ZHANG Lili, et al. Distributions of radiolarian diversity and abundance in surface sediments of the South China Sea and their environmental implications [J]. Earth Science—Journal of China University of Geosciences, 2008, 33(4): 431-442. [7] 张杰, 张兰兰, 陈木宏, 等. 现代放射虫的高阶分类现状及其生态学意义[J]. 微体古生物学报, 2020, 37(1):82-98. [ZHANG Jie, ZHANG Lanlan, CHEN Muhong, et al. The higher level classification of modern radiolarians and their ecological significance [J]. Acta Micropalaeontologica Sinica, 2020, 37(1): 82-98. [8] Hu D X, Wu L X, Cai W J, et al. Pacific western boundary currents and their roles in climate [J]. Nature, 2015, 522(7556): 299-308.
[9] Yan X H, Ho C R, Zheng Q N, et al. Temperature and size variabilities of the Western Pacific Warm Pool [J]. Science, 1992, 258(5088): 1643-1645.
[10] Palmer M R, Pearson P N. A 23, 000-year record of surface water pH and PCO2 in the western equatorial Pacific Ocean [J]. Science, 2003, 300(5618): 480-482.
[11] 张兰兰, 胡邦琦, 邱卓雅, 等. 西菲律宾海硅藻席沉积中的多囊虫类放射虫记录及其环境意义[J]. 地球科学, 2020. [ZHANG Lanlan, HU Bangqi, QIU Zhuoya, et al. Records of polycystine Radiolaria in the diatom mats sediments from the West Philippe Sea and their environmental significance [J]. Earth Science, 2020. [12] 李铁刚, 熊志方, 翟滨. 低纬度西太平洋硅藻席沉积与碳循环[M]. 北京: 海洋出版社. 2015. LI Tiegang, XIONG Zhifang, ZHAI Bin. Laminated Diatom Mat Deposits from the Low-Latitude Western Pacific Linked to Global Carbon Cycle[M]. Beijing: Ocean Press, 2015.
[13] Chen M H, Tan Z Y. Radiolarian distribution in surface sediments of the northern and central South China Sea [J]. Marine Micropaleontology, 1997, 32(1-2): 173-194.
[14] Matsuzaki K M, Itaki T, Kimoto K. Vertical distribution of polycystine radiolarians in the northern East China Sea [J]. Marine Micropaleontology, 2016, 125: 66-84.
[15] Zhang L L, Chen M H, Xiang R, et al. Distribution of polycystine radiolarians in the northern South China Sea in September 2005 [J]. Marine Micropaleontology, 2009, 70(1-2): 20-38.
[16] Chang F M, Zhuang L H, Li T G, et al. Radiolarian fauna in surface sediments of the northeastern East China Sea [J]. Marine Micropaleontology, 2003, 48(3-4): 169-204.
[17] 董智, 石学法, 邹欣庆, 等. 冲绳海槽表层沉积物放射虫属种空间分布特征及其影响因素[J]. 地学前缘, 2020, 27(6):300-312. [DONG Zhi, SHI Xuefa, ZOU Xinqing, et al. Spatial distribution characteristics of radiolarian species in surface sediments from the Okinawa Trough and its influence factors [J]. Earth Science Frontiers, 2020, 27(6): 300-312. [18] Liu L, Zhang Q, Chen M H, et al. Radiolarian biogeography in surface sediments of the Northwest Pacific marginal seas [J]. Science China Earth Sciences, 2017, 60(3): 517-530.
[19] Qu H X, Wang J B, Xu Y, et al. Radiolarian assemblage as an indicator of environmental conditions in the marginal seas of the Western North Pacific [J]. Marine Micropaleontology, 2020, 157: 101859.
[20] Hernández-Almeida I, Cortese G, Yu P S, et al. Environmental determinants of radiolarian assemblages in the western Pacific since the last deglaciation [J]. Paleoceanography and Paleoclimatology, 2017, 32(8): 830-847.
[21] Matsuzaki K M, Itaki T. New northwest Pacific radiolarian data as a tool to estimate past sea surface and intermediate water temperatures [J]. Paleoceanography and Paleoclimatology, 2017, 32(3): 218-245.
[22] Hsueh Y. The Kuroshio in the East China Sea [J]. Journal of Marine Systems, 2000, 24(1-2): 131-139.
[23] Matsuno T, Lee J S, Yanao S. The Kuroshio exchange with the South and East China Seas [J]. Ocean Science, 2009, 5(3): 303-312.
[24] 张弦, 俞慕耕, 江伟, 等. 菲律宾海及其邻近海区的水文特征[J]. 海洋通报, 2004(1):8-14. [ZHANG Xuan, YU Mugeng, JIANG Wei, et al. Hydrologic characteristic of the Philippine Sea and its nearby areas [J]. Marine Science Bulletin, 2004(1): 8-14. doi: 10.3969/j.issn.1001-6392.2004.01.002 [25] 赵一阳, 何丽娟, 张秀莲, 等. 冲绳海槽沉积物地球化学的基本特征[J]. 海洋与湖沼, 1984, 15(4):371-379. [ZHAO Yiyang, HE Lijuan, ZHANG Xiulian, et al. Basic characteristics of geochemistry of sediments in Okinawa trough [J]. Oceanologia et Limnologia Sinica, 1984, 15(4): 371-379. [26] 黄财京. 菲律宾海深层水团与环流特征分析[J]. 中国科学院大学硕士学位论文, 2018. HUANG Caijing. Analysis of the characteristics of deep water mass and circulation in the Philippine sea[D]. Master Dissertation of University of Chinese Academy of Sciences, 2018.
[27] Zhang L L, Suzuki N. Taxonomy and species diversity of Holocene pylonioid radiolarians from surface sediments of the northeastern Indian Ocean [J]. Palaeontologia Electronica, 2017, 20(3).
[28] 陈木宏, 谭智源. 南海中、北部沉积物中的放射虫[M]. 北京: 科学出版社, 1996: 271. CHEN Muhong, TAN Zhiyuan. Radiolaria from Surface Sediments of the Central and Northern South China Sea[M]. Beijing: Science Press, 1996: 271.
[29] 谭智源, 陈木宏. 中国近海的放射虫[M]. 北京: 科学出版社, 1999: 404. TAN Zhiyuan, CHEN Muhong. Radiolaria off the Coast of China[M]. Beijing: Science Press, 1999: 404.
[30] Boltovskoy D. Classification and distribution of South Atlantic recent polycystine Radiolaria [J]. Palaeontologia Electronica, 1998, 1(2): 116.
[31] Matsuzaki K M, Suzuki N, Nishi H. Middle to Upper Pleistocene polycystine radiolarians from Hole 902-C9001C, northwestern Pacific [J]. Paleontological Research, 2015, 19(1): 1-77.
[32] Zhang L L, Suzuki N, Nakamura Y, et al. Modern shallow water radiolarians with photosynthetic microbiota in the western North Pacific [J]. Marine Micropaleontology, 2018, 139: 1-27.
[33] Müller J. Über die Thalassicollen, Polycystinen und Acanthometren des Mittelmeeres[M]. Abhandlungen: Konigliche Preussische Akademie der Wissenschaften zu Berlin, 1858: 1-62.
[34] Haeckel E. Report on the radiolaria collected by H. M. S. Challenger during the Years 1873-1876[R]. Report on the Scientific Results of the Voyage of H. M. S. Challenger, 1887: 1-1803.
[35] Petrushevskaya M G. Radiolarians of the Ocean [J]. Reports on the Soviet Expeditions. Academy of Sciences of the U.S.S.R., Zoological Institute, Explorations of the Fauna of the Seas, 1971, 9(17): 1-418.
[36] Renz G W. Radiolaria from Leg 27 of the Deep Sea Drilling Poject[R]. Initial Reports of the Deep Dea Drilling Project (U. S. Government Printing Office), 1974, 27: 769-841.
[37] Takahashi K, Honjo S. Vertical flux of Radiolaria: A taxon-quantitative sediment trap study from the western tropical Atlantic [J]. Micropaleontology, 1981, 27(2): 140-190.
[38] Matsuzaki K M, Itaki T, Sugisaki S. Polycystine radiolarians vertical distribution in the subtropical Northwest Pacific during Spring 2015 (KS15-4) [J]. Paleontological Research, 2020, 24(2): 113-133.
[39] Adl S M, Bass D, Lane C E, et al. Revisions to the classification, nomenclature, and diversity of eukaryotes [J]. Journal of Eukaryotic Microbiology, 2019, 66(1): 4-119.
[40] Zhang J, Zhang L L, Xiang R, et al. Radiolarian biogeographic contrast between spring of 2017 and winter of 2017-2018 in the South China sea and Malacca Strait [J]. Continental Shelf Research, 2020, 208: 104245.
[41] 常凤鸣, 庄丽华, 李铁刚, 等. 冲绳海槽北部表层沉积物中的放射虫组合[J]. 海洋与湖沼, 2003, 34(2):208-216. [CHANG Fengming, ZHUANG Lihua, LI Tiegang, et al. Modern radiolarian assemblages in surficial sediments of northern Okinawa Trough [J]. Oceanologia et Limnologia Sinica, 2003, 34(2): 208-216. doi: 10.3321/j.issn:0029-814X.2003.02.012 [42] 程振波, 鞠小华. 冲绳海槽中部表层沉积物中的放射虫[J]. 海洋与湖沼, 1998, 29(6):656-662. [CHEN Zhenbo, JU Xiaohua. Radiolaria from the surface sediments in the middle Okinawa Trough [J]. Oceanologia et Limnologia Sinica, 1998, 29(6): 656-662. doi: 10.3321/j.issn:0029-814X.1998.06.015 [43] 王汝建, 陈荣华. 冲绳海槽南部表层沉积物中放射虫的初步研究[J]. 同济大学学报, 1996, 24(6):670-676. [WANG Rujian, CHEN Ronghua. Preliminary study on the radiolaria from the surface sediments in southern Okinawa Trough [J]. Journal of Tongji University, 1996, 24(6): 670-676. [44] 王越奇, 宋金明, 袁华茂, 等. 西北太平洋黑潮源区沉积特征及黑潮输入对东海沉积物的影响[J]. 海洋科学, 2018, 42(9):112-126. [WANG Yueqi, SONG Jinming, YUAN Huamao, et al. Sedimentary characteristics of the Kuroshio origination area and the influence of the Kuroshio intrusion on sediments of the East China Sea [J]. Marine Sciences, 2018, 42(9): 112-126. doi: 10.11759/hykx20180129001 [45] 宋金明, 袁华茂. 黑潮与邻近东海生源要素的交换及其生态环境效应[J]. 海洋与湖沼, 2017, 48(6):1169-1177. [SONG Jinming, YUAN Huamao. Exchange and ecological effects of biogenic elements between Kuroshio and adjacent east China sea [J]. Oceanologia et Limnologia Sinica, 2017, 48(6): 1169-1177. doi: 10.11693/hyhz20170900234 [46] 冯庆来. 放射虫古生态的初步研究[J]. 地质科技情报, 1992, 11(2):41-46. [FENG Qinglai. A preliminary study on the rediolarian palaeoecology [J]. Geological Science and Technology Information, 1992, 11(2): 41-46. [47] 梁文, NILANTHI P, 冉莉华, 等. 南海北部和西菲律宾海颗石藻种群特征及差异[J]. 微体古生物学报, 2017, 34(3):279-290. [LIANG Wen, NILANTHI P, RAN Lihua, et al. Community structures of the living coccolithophores in the northern South China Sea and the western Philippines sea [J]. Acta Micropalaeontologica Sinica, 2017, 34(3): 279-290. [48] Takahashi K. Vertical flux, ecology and dissolution of Radiolaria in tropical oceans: implications for the silica cycle[D]. Doctor Dissertation of Massachusetts Institute of Technology and Woods Hole Oceanographic Institution, 1981: 1-461.
[49] 袁梁英, 戴民汉. 南海北部低浓度磷酸盐的测定与分布[J]. 海洋与湖沼, 2008, 39(3):202-208. [YUAN Liangying, DAI Minhan. The distribution of low-level phosphate in the northern South China sea [J]. Oceanologia et Limnologia Sinica, 2008, 39(3): 202-208. doi: 10.3321/j.issn:0029-814X.2008.03.002 [50] Glud R N, Wenzhöfer F, Middelboe M, et al. High rates of microbial carbon turnover in sediments in the deepest oceanic trench on Earth [J]. Nature Geoscience, 2013, 6(4): 284-288.
[51] 杨海燕, 毛新燕, 郭新宇. 基于WOD数据集的西北太平洋混合层内营养盐浓度初步研究[J]. 中国海洋大学学报, 2018, 48(8):1-9. [YANG Haiyan, MAO Xinyan, GUO Xinyu. A preliminary study on nutrients concentration within the mixed layer in the northwest pacific based on WOD data [J]. Periodical of Ocean University of China, 2018, 48(8): 1-9. [52] Liu K K, Chao S Y, Shaw P T, et al. Monsoon-forced chlorophyll distribution and primary production in the South China Sea: observations and a numerical study [J]. Deep Sea Research Part I: Oceanographic Research Papers, 2002, 49(8): 1387-1412.
[53] 张金鹏, 邓希光, 杨胜雄, 等. 马里亚纳海沟挑战者深渊南部7000 m水深处发现硅藻化石软泥[J]. 地质通报, 2015, 34(12):2352-2354. [ZHANG Jinpeng, DENG Xiguang, YANG Shengxiong, et al. Diatom ooze found in 7000 m submarine area of Challenger Depth in Mariana Trench [J]. Geological Bulletin of China, 2015, 34(12): 2352-2354. doi: 10.3969/j.issn.1671-2552.2015.12.021 [54] 黄财京, 谢强, 陈举, 等. 菲律宾海底层水体在1990s—2010s之间的暖化[J]. 热带海洋学报, 2018, 37(6):26-32. [HUANG Caijing, XIE Qiang, CHEN Ju, et al. Bottom-water warming in the Philippine Sea between 1990s and 2010s [J]. Journal of Tropical Oceanography, 2018, 37(6): 26-32. [55] Kawabe M, Fujio S. Pacific ocean circulation based on observation [J]. Journal of Oceanography, 2010, 66(3): 389-403.
[56] 张兰兰, 陈木宏, 胡维芬, 等. 现生放射虫的水深分布及其环境指示意义[J]. 热带海洋学报, 2013, 32(6):101-107. [ZHANG Lanlan, CHEN Muhong, HU Weifen, et al. Vertical distribution of living radiolarians and its environmental implication [J]. Journal of Tropical Oceanography, 2013, 32(6): 101-107. doi: 10.3969/j.issn.1009-5470.2013.06.015 [57] Zhang Q, Chen M H, Zhang L L, et al. Variations in the radiolarian assemblages in the Bering Sea since Pliocene and their implications for paleoceanography [J]. Palaeogeography, Palaeoclimatology, Palaeoecology, 2014, 410: 337-350.
[58] Matsuzaki K M, Itaki T, Tada R. Paleoceanographic changes in the Northern East China Sea during the last 400 kyr as inferred from radiolarian assemblages (IODP Site U1429) [J]. Progress in Earth and Planetary Science, 2019, 6: 22.
[59] 畠田 健太朗. 現世放散虫に関する生態情報リスト[J]. 大阪微化石研究会誌, 2009, S1(14):31-41. [Hatakeda K. Compiled ecological data on living Polycystine radiolarian [J]. News of Osaka Micropaleontologists (NOM), 2009, S1(14): 31-41. [60] Boltovskoy D. Vertical distribution patterns of Radiolaria Polycystina (Protista) in the World Ocean: living ranges, isothermal submersion and settling shells [J]. Journal of Plankton Research, 2017, 39(2): 330-349.
[61] Welling L A, Pisias N G. Radiolarian fluxes, stocks, and population residence times in surface waters of the central equatorial Pacific [J]. Deep Sea Research Part I: Oceanographic Research Papers, 1998, 45(4-5): 639-671.
[62] Pisias N G. Vertical water mass circulation and the distribution of radiolaria in surface sediments of the Gulf of California [J]. Marine Micropaleontology, 1986, 10(1-3): 189-205.
[63] Matsuzaki K M, Itaki T, Tada R, et al. Paleoceanographic history of the Japan Sea over the last 9.5 million years inferred from radiolarian assemblages (IODP Expedition 346 Sites U1425 and U1430) [J]. Progress in Earth and Planetary Science, 2018, 5: 54.
[64] Takahashi K. Radiolaria: Flux, Ecology, and Taxonomy in the Pacific and Atlantic[M]. Woods Hole, MA: Woods Hole Oceanographic Institution Ocean, 1991.


计量
- 文章访问数: 1512
- HTML全文浏览量: 288
- PDF下载量: 55