The kinematic mechanism study of Hawaii-Emperor seamount chain: Evidence from paleomagnetic records
-
摘要: 夏威夷-皇帝海山链位于北太平洋中部,是一条自西北至东南延伸的海底火山链,并在47 Ma存在一个方向弯折。厘定这一特征的成因机制和运动学过程,是西太平洋海区软流圈与岩石圈相互作用以及跨圈层物质能量交换的关键科学问题,对于解译东亚大陆动力学演化过程亦具有重要意义。目前对于夏威夷-皇帝海山链47 Ma弯折的机制有两种争论:太平洋板块运动方向改变和热点移动。古地磁学是研究大陆漂移和板块演化的最有效手段之一,其最大优势是可以定量化研究地质历史时期中岩石圈板块的运动学过程。本文首先通过回顾与总结前人对夏威夷-皇帝海山链成因及转向机制的研究,重点探讨古地磁学在该问题上所提供的约束证据,并对存在的关键科学问题进行了梳理和展望。Abstract: The Hawaiian-Emperor seamount chain is located in the middle of North Pacific Ocean extending in a direction from northwest to southeast. It consists of two segments, the older Emperor chian trending in N10°W and the Hawaiian chanin extending in N110°E. The research interests of the Hawaiian-Emperor seamount chain remain in the origin of seamount chain and the the sharp bend of the chain, which are the key to the investigation of the upwelling in the mantle, the movement of the lithosphere, and the exchange of material and energy between different layers. Paleomagnetism is the best tool for the kinematic studies on the seamount chain. In this paper, we summarized the previous studies on the formation mechanism of the Hawaiian-Emperor chain and the bend formed 47 Ma, with emphasis on the paleomagnetic evidence for the kinematics process of the Hawaiian-Emperor seamount chain. Key scientific topics and research directions were also discussed.
-
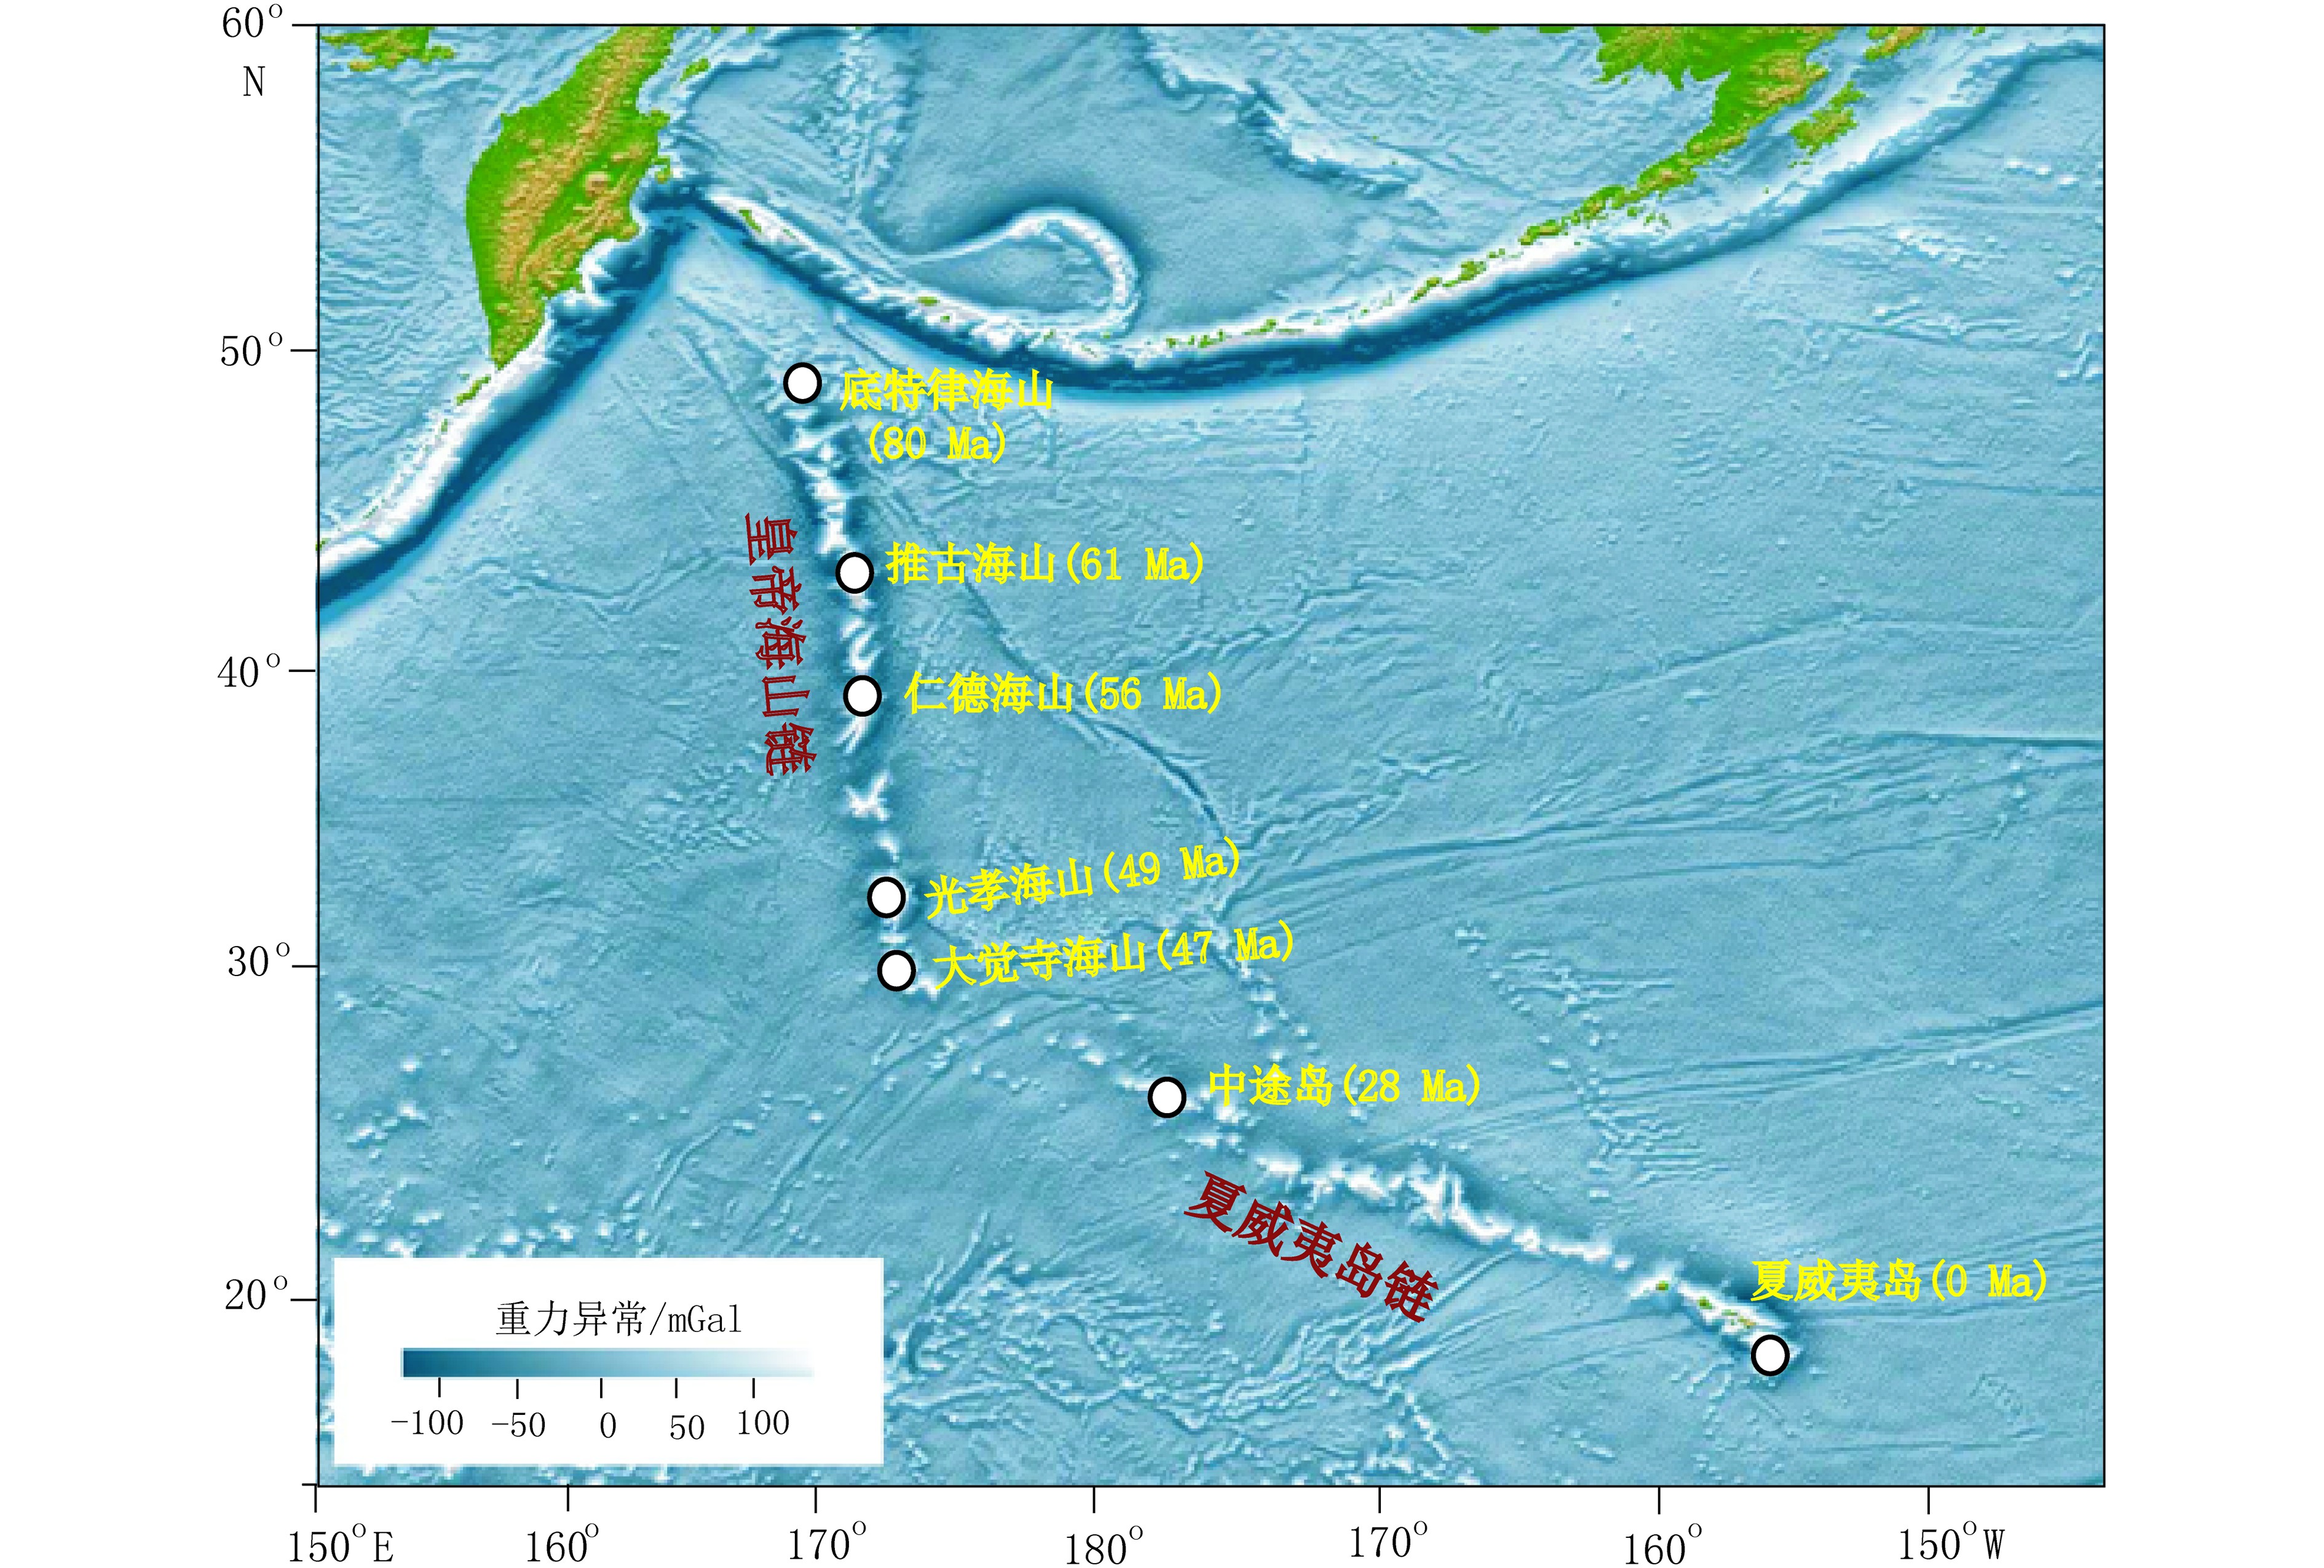
夏威夷-皇帝海山链是北太平洋中部最著名的海底火山链,其自北西至南东延伸,长度大于6 000 km。它主要由两部分组成:走向为N10°W的皇帝海山链和走向为N110°E的夏威夷海山链(图1)。各海山年龄从西北到东南逐渐变年轻,同时二者走向上存在一个明显的60°转折[1-2]。根据古生物学和放射性同位素年龄数据,该转折发生在43 Ma前的中始新世[3],因此也被称为“43 Ma弯折”(43 Ma Bend),后来更精确的年龄数据将其界定为47 Ma [4]。O’Connor等[5]提出转折区域中心位于大觉寺(Daikakuji)海山,年龄为47.5 Ma,弯折过程经历了5 Ma,起始年龄为50 Ma。夏威夷-皇帝火山海山链是目前发育最完好、研究最深入的一支热点轨迹,是研究板块运动、地幔对流、构造、地球化学演化和岩石圈特征的理想区域[6-12]。
目前对于夏威夷-皇帝海山链研究的关键问题是其成因及二者之间转向的运动学机制。由于板块运动很难解释板内岩浆活动,因此,Wilson[1]提出该海山链是太平洋板块之下的热点产生的火山记录。后来Morgan[2, 14]进一步提出地幔柱理论,认为热点在地幔中的位置是固定的,不随时间变化。该海山链是太平洋板块漂移经过近似固定的热点而形成的一系列海山。因此,该海山链成为了太平洋板块运动方向的直接证据[8, 15]。早期观点认为热点是固定不动的,夏威夷-皇帝火山链之间的转向是太平洋板块的运动发生转向导致的[8, 15]。但是,随着研究的逐渐深入,人们发现热点在地幔中并不是固定的,而是存在相互移动[16-18],这给传统的板块运动学及基于此建立的其他理论带来了强烈的冲击[19]。古地磁学是研究大陆漂移和板块演化的最有效手段之一,其最大优势是可以通过对保存在岩石中的磁学信息的解读,进而可以认识地史时期岩石圈板块的运动学过程[20-21]。对夏威夷-皇帝海山链的古地磁学研究发现,夏威夷热点在转向之前是向南运动的[19, 22-25],那么,该转向是太平洋板块运动方向改变还是热点移动导致的,亦或二者共同作用的结果?本文通过回顾总结前人对夏威夷-皇帝海山链成因及转向机制的研究,重点探讨古地磁学在该问题上所提供的约束证据,并在此基础上对存在的问题及未来的研究方向进行初步探讨和展望。
1. 夏威夷-皇帝海山链成因争论
夏威夷-皇帝海山链的成因一直是太平洋板块运动及深部动力学机制研究的焦点。目前关于夏威夷-皇帝海山链的成因有两派观点:热点固定论和热点移动论[26-28]。
1.1 热点固定论
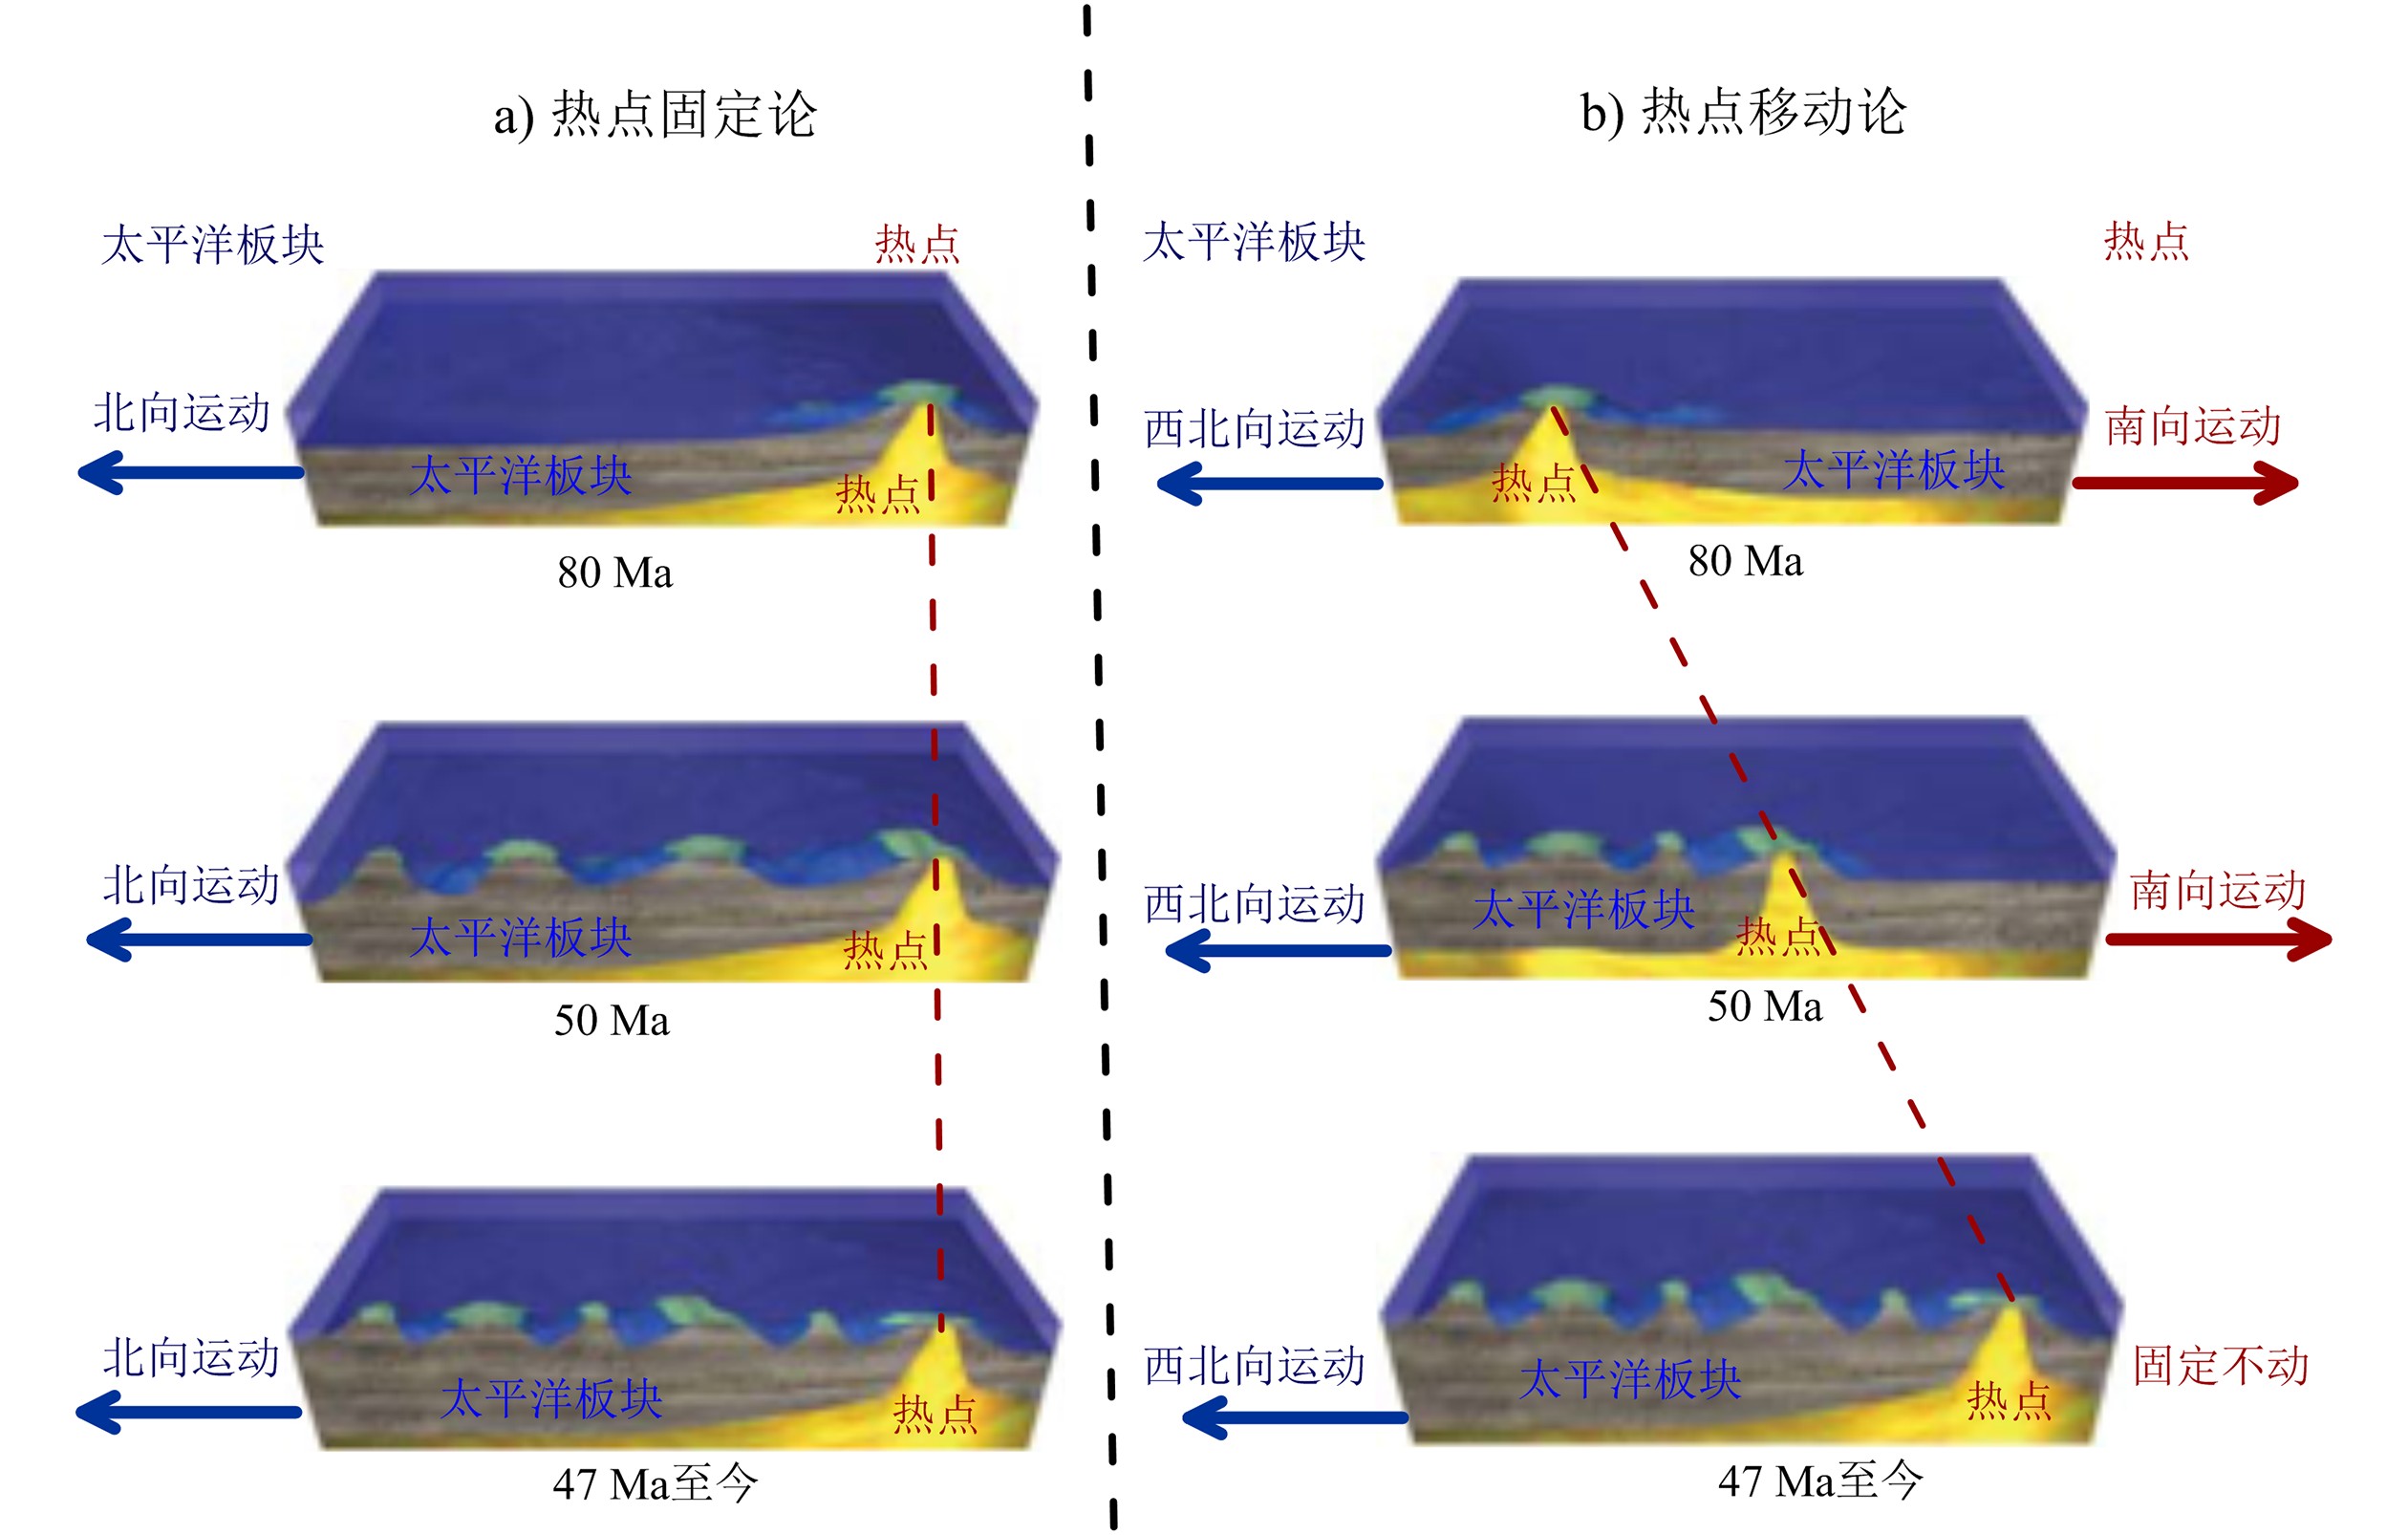
热点固定论认为,热点相对于地幔是固定的,可以作为板块运动重建的绝对参考系[2, 14-15, 29-30]。当岩石圈板块跨越固定的夏威夷热点之上时,地幔物质喷出地表,形成火山。先形成的火山随着太平洋板块移动离开热点,逐渐熄灭形成死火山,同时在热点上部对应的洋壳上又会喷发形成新的火山。如此不断推陈出新,发育成今天所看到的NW-SE向、由老到新的一列火山链,标志着太平洋板块在热点上方移动的轨迹,并记录了太平洋板块运动的方向(图2a)[1-2, 14, 29]。而皇帝海山链与夏威夷海山链之间的弯折可能是太平洋板块相对于固定热点运动方向发生60°的转向引起的[3, 15]。
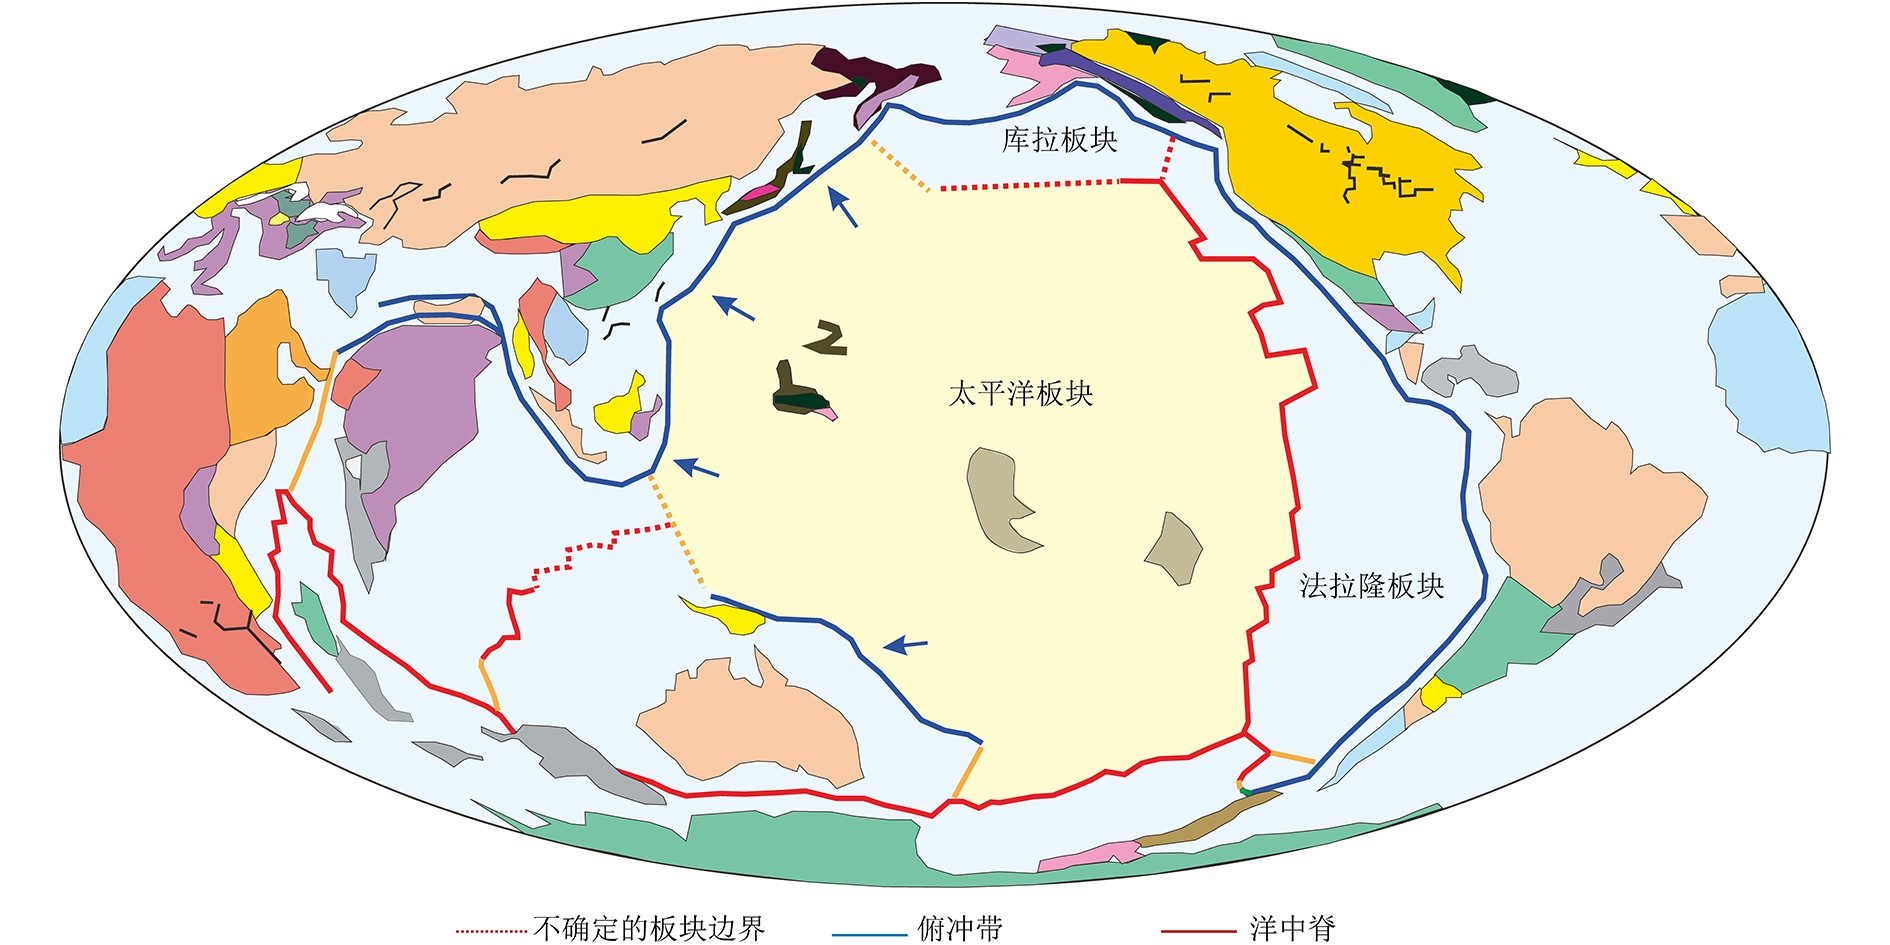
对于太平洋板块转向机制,前人提出可能是印度与欧亚大陆在约45 Ma的碰撞引起的[31],但是后来证明该事件对太平洋板块运动的作用很小[32]。Niu[10]认为可能是夏威夷地幔柱头到达安第斯型的Okhotsk-Chukotka活动大陆边缘,导致了海沟堵塞,阻碍了太平洋板块的北向运动,进而转向西北方向。目前这只是个假设,需要更多大洋钻探的数据支持。另外,西南太平洋汤加-克马德克岛弧在早始新世的启动也可能导致太平洋板块转向。阿留申、伊豆-小笠原-马里亚纳海沟(IBM)以及汤加-克马德克俯冲带都是在55~45 Ma期间开始启动,包含了太平洋板块边界主要的几何应力变化。尤其是IBM俯冲启动之后的几个百万年产生的牵引力可以导致太平洋板块转向[33-34]。但这些事件与夏威夷-皇帝海山链弯折的时间存在偏差。Sharp和Clague[35]对海山的最新定年结果将弯折启动年龄限定在50 Ma,弯折发生的时间超过8 Ma。新的弯折年龄将太平洋地区地幔动力学、板块运动和西太平洋板块边界的主要构造事件紧密地联系起来,为太平洋转向提供了一个机制解释[36]。Koivisto等[37]则认为太平洋板块转向是49.7~40.1 Ma期间太平洋-法拉隆洋中脊扩张速度增加导致的(图3)。但是Wright等[38]根据海底磁异常数据和破碎带识别得出,太平洋-法拉隆洋中脊的扩张速率的增加是法拉隆板块东向绝对运动速率增加导致的,而且扩张方向并没有改变,因此不能作为太平洋板块转向的主要诱因。
目前对于47 Ma太平洋板块运动转向仍存在质疑,表现在太平洋洋壳保存的扩张方向并没有显著变化,磁异常数据没有明显的转向[19]。唯一可能与太平洋板块47 Ma转向事件相关的是皇帝海山北部和阿留申海沟之间高低不平的地形。这些特征表明,在42~53 Ma之间,库拉板块和太平洋板块之间的扩张方向改变并最终停止(图3)。但是,这个时间与太平洋-法拉隆洋中脊变化并不一致。另外,太平洋板块运动方向的改变应该会同时传播到俯冲带[39],导致俯冲方向发生变化或者在周围大陆边缘产生对应的构造活动,但是在北美和亚洲板块边缘都没有与47 Ma对应的良好的构造记录[19]。同时,在太平洋其他的热点轨迹中,如路易斯维尔海山链,也没有47 Ma转向的记录[18-19]。板块运动轨迹计算显示[40],尽管夏威夷海山链可以与根据全球热点得到的轨迹很好对应,但是皇帝海山链并不符合。一个可能的解释是皇帝海山形成时热点在地幔参考系中是运动的[16-17]。
1.2 热点移动论
尽管热点固定论为板块运动提供了有效的理论基础,但是后来人们对太平洋与印度洋-大西洋热点参考系的对比研究发现,二者存在相互移动,根据印度-大西洋热点参考系得到的太平洋板块运动轨迹在夏威夷-皇帝海山链南侧,直线形态与夏威夷热点的轨迹存在很大偏差,这对热点固定论提出了挑战[16-17, 42-43]。对全球板块运动重建的研究指出,夏威夷热点与印度-大西洋热点参考系之间存在相对运动[27, 44-46]。系统的地幔流模型分析表明,热点不是固定不动的,而是单独或者集体以一定的速度移动[41, 47-48]。
在固定热点参考系下,对全球板块运动重建不能将夏威夷-皇帝海山链47 Ma时的弯折进行有效恢复,并且前人对太平洋板块运动突然转向缺乏可靠的机制解释,于是一些学者提出皇帝海山链可能是47 Ma之前夏威夷热点的南向运动产生的[16-17, 49]。例如,Norton[19]认为该47 Ma弯折记录了夏威夷热点固定在地幔中的时间,而不是板块运动方向改变的时间。在47 Ma之前,夏威夷热点应该向南运动,形成皇帝火山链(图2b)。Steinberger[41]通过对全球地幔流模型的数值模拟再现了夏威夷-皇帝海山链的形成过程,提出热点的南向移动是海山链形成的必备因素。但是目前对80 Ma热点开始移动以及47 Ma热点突然停止运动的机制,仍没有得到一致的解释。
2. 古地磁学约束
2.1 古地磁方法
由于非偶极子组分的贡献,现代地球磁场的主磁场可以近似等效为一个偏心偶极子所产生的磁场[50],但古地磁场在地质历史时期可近似为一个轴向地心偶极子磁场(Geocentric Axial Dipole, GAD)[20, 51]。在GAD假设下,可近似地认为地磁坐标系与地理坐标系完全重叠,地球上的刚性板块围绕地球表面的某一中心即欧拉极做小圆弧运动,任一观测点的磁场方向由磁偏角D和磁倾角I确定,磁倾角I与观测点所处地理纬度λ之间存在如下对应关系[20]:
$$\tan I = 2\tan\lambda $$ 因此,地质历史时期板块的古纬度可通过记录在岩石中的古地磁场的磁倾角确定。
不同观测点的地球磁场的方向不同,但是古地磁极只有一对,与观测点位置无关。由一次地磁观测的地球磁场方向换算得到的地磁极称为虚地磁极(Virtual Geomagnetic Pole, VGP)[52]。对某一地质时期内(大于105~106 a范围)一定数量的VGP求平均可以“平均掉”地球磁场长期变化的影响,从而获得该地质时期的平均极位置,即古地磁极。古地磁极相对于一个特定板块随时间序列的变化曲线称为视极移曲线(Apparent Polar Wander Path,APWP)[23, 53]。同一板块不同地质历史时期古地磁极位置间的“离散”说明该板块古地理位置发生了变化[54],因此,APWP为地球古板块位置重建以及不同板块之间的相对位置恢复提供了一个有效途径[52]。
但是,如果地球自转轴相对于地球发生了移动,此时即为真极移(True Polar Wander, TPW)[55]。真极移一般是由于地幔的密度结构或者地磁场非偶极子场发生变化,导致最大惯性轴发生移动,于是自转轴也随之移动。如果热点相对于自转轴是固定的,并且没有发生真极移,那么视极移曲线和热点火山轨迹都沿着地磁极的最小同心圆。这时候,基于热点轨迹得到的板块运动模型可用来预测视极移曲线。如果热点固定,但是存在真极移,那么热点轨迹上火山古纬度的变化具有全球性[55]。如果不存在真极移,但是热点之间存在相对运动,那么这时候热点火山的古纬度变化不具有全球性,只是反映了该热点的运动行为[56]。
2.2 夏威夷-皇帝海山链成因机制的古地磁约束
天然介质记录的古地磁场方向可以被用来恢复板块古地理位置[20-21],根据海底磁异常的偏态数据以及钻孔中沉积物或玄武岩记录的古地磁倾角可以计算得到太平洋板块的古地磁极位置,进而得到太平洋板块的视极移曲线[57-58]。另外,当火山喷出的岩浆固结成岩时,其中的磁性矿物会记录当时的地磁场倾角和偏角,该信息不会随岩石位置变化而变化。因此,可以根据岩石记录的地磁场倾角得到火山喷发处的古纬度,进而恢复火山位置[41]。现今夏威夷热点在19.4°N,如果根据古地磁方法得到的各海山的古纬度和现今夏威夷热点的位置一致,则说明热点没有移动;若古纬度随时间而变化,则说明热点是移动的。因此,辨别二者最好的办法就是对海山上岩石进行古地磁数据提取,根据得到的古纬度变化可以反演热点的移动轨迹[41]。
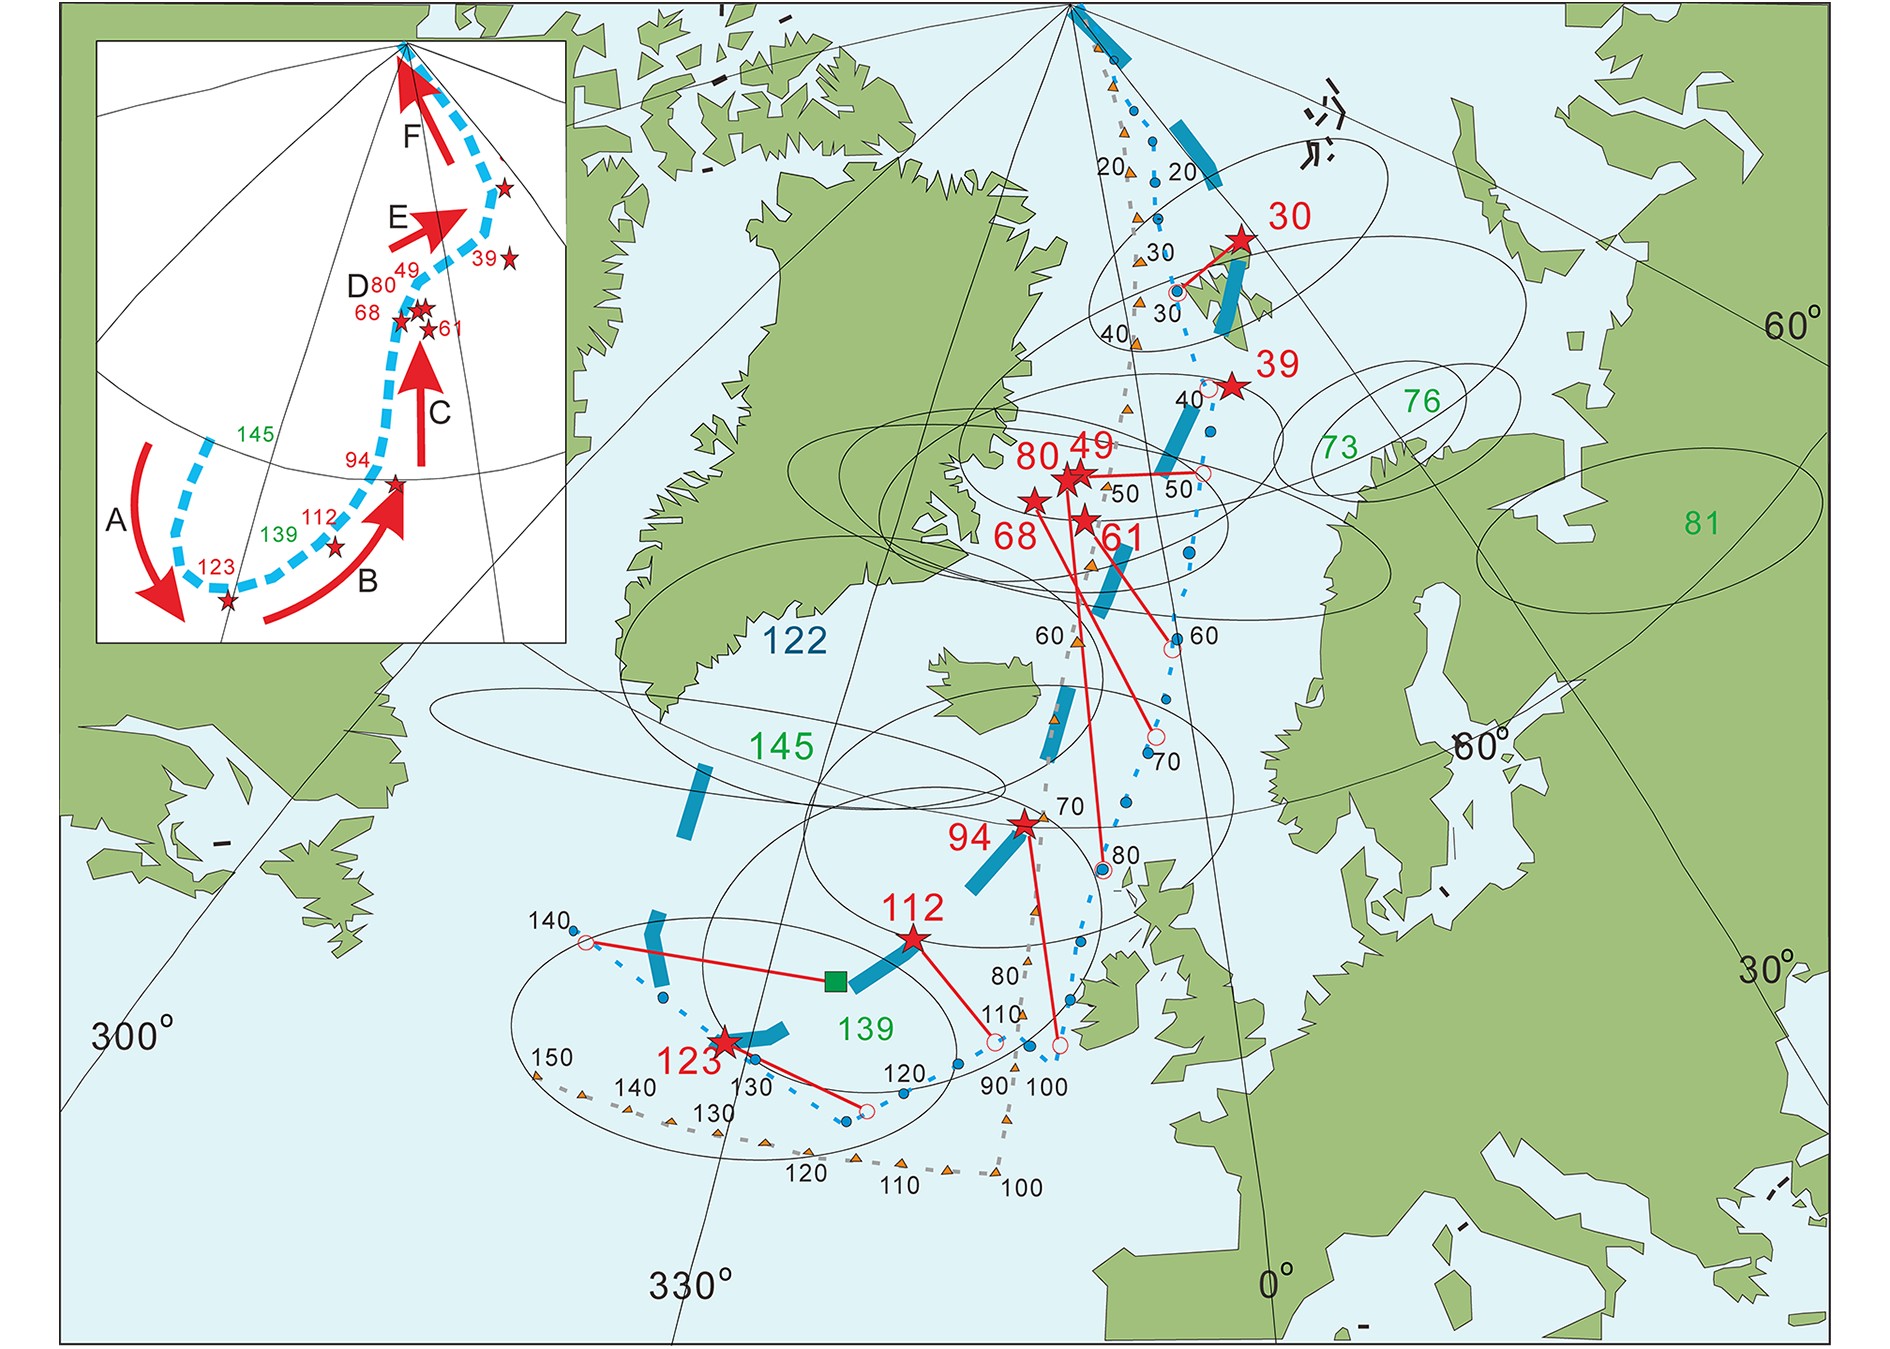
Sager等[59-60]综合钻孔样品、海山磁异常模型以及海底磁异常的偏态数据,更细致地重建了晚白垩世—早中生代太平洋板块的视极移曲线[57, 60-61],提出太平洋板块在该阶段的运动分为6个阶段,分别为晚侏罗世—早白垩纪的南向移动(A,145~123 Ma),中—晚白垩纪转为北向移动(B和C,123~80 Ma),80~49 Ma太平洋板块保持静止(D),之后继续向北移动(E,49~30 Ma),并在30 Ma发生运动转向(F)(图4)。其中80~49 Ma太平洋板块视极移曲线在纬向上保持不动,而根据热点得到的视极移曲线却显示存在明显的移动,二者之间的最大差异可达15°,这可以作为夏威夷热点向南移动的一个证据。
![]() 图 4 太平洋板块的视极移曲线(APWP)(蓝色粗虚线)其中红色星号代表地磁极位置[60, 61],星号附近的数字代表对应的年龄(Ma),实线椭圆代表每个极位置95%的置信区间。蓝色圆点和蓝色细虚线为根据热点轨迹得到的太平洋板块的极移曲线[15, 62]。插图表明了极移的不同阶段,引自Sager[56]Figure 4. Apparent polar wander path in the Pacific (APWP)The red stars denote pole positions defining the most likely APWP shown by the blue dashed line. Poles are surrounded by 95% confidence ellipses and labeled by age in Ma. Thin dashed lines show predicted polar wander path from plate/hotspots motion models of Duncan and Clague[15] and Wessel et al[62]. Inset sketch map shows interpreted phases of polar wander, revised from Sager[56]
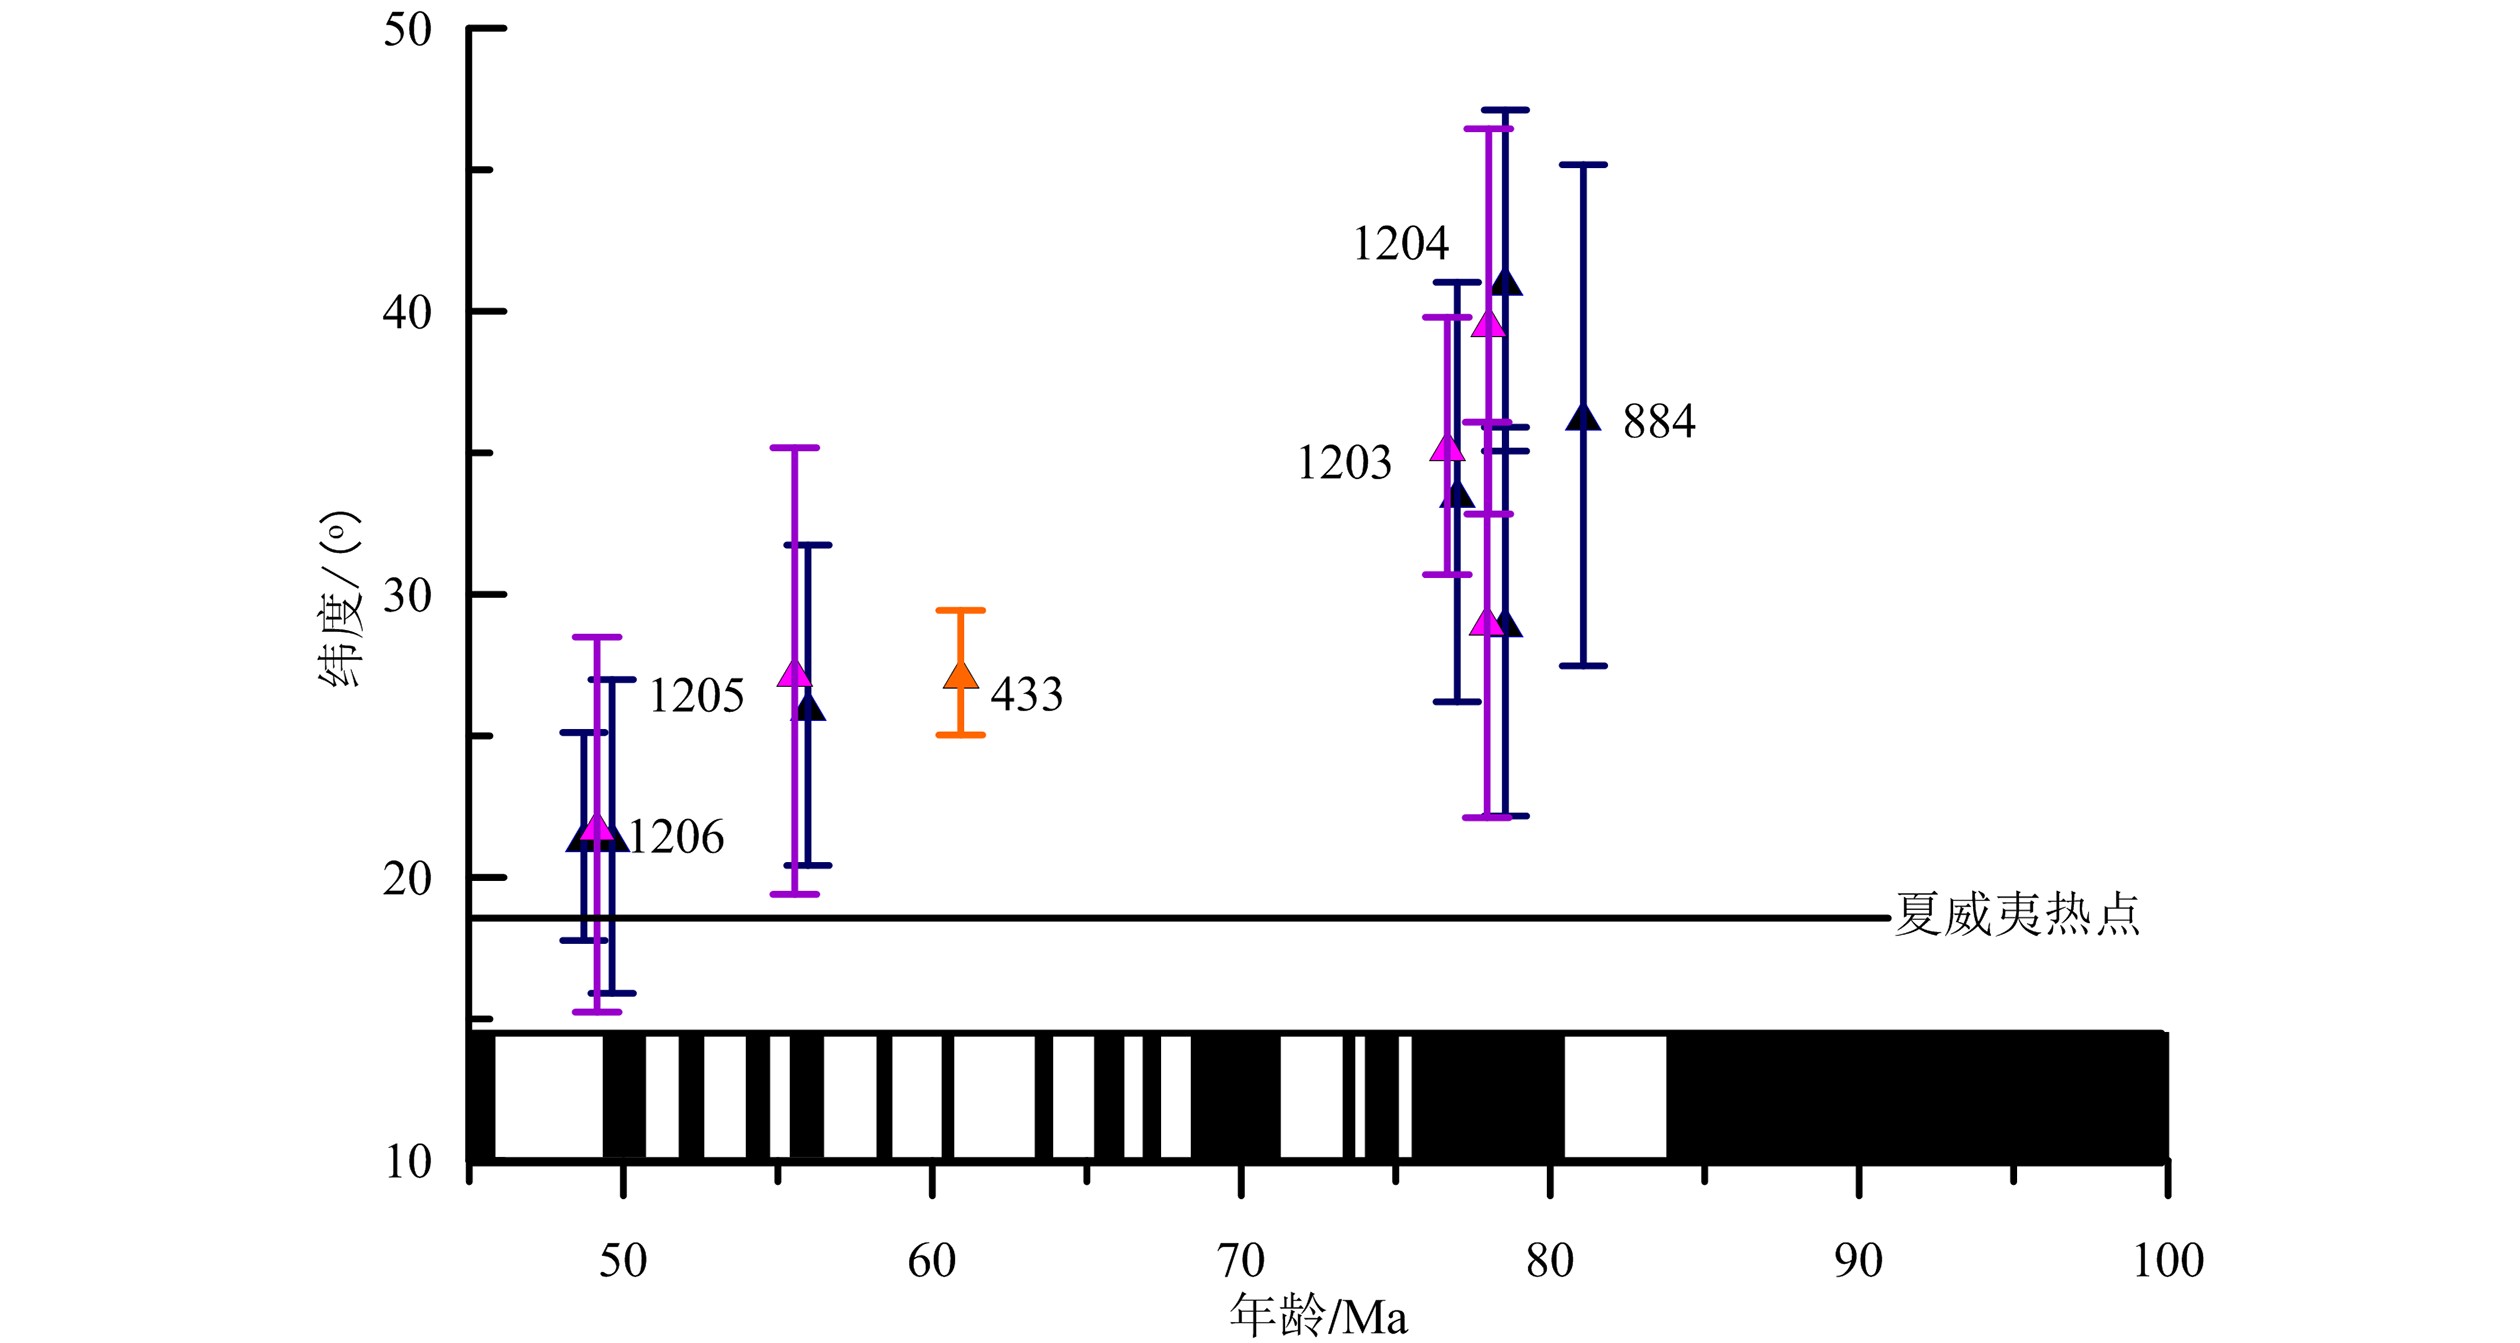
图 4 太平洋板块的视极移曲线(APWP)(蓝色粗虚线)其中红色星号代表地磁极位置[60, 61],星号附近的数字代表对应的年龄(Ma),实线椭圆代表每个极位置95%的置信区间。蓝色圆点和蓝色细虚线为根据热点轨迹得到的太平洋板块的极移曲线[15, 62]。插图表明了极移的不同阶段,引自Sager[56]Figure 4. Apparent polar wander path in the Pacific (APWP)The red stars denote pole positions defining the most likely APWP shown by the blue dashed line. Poles are surrounded by 95% confidence ellipses and labeled by age in Ma. Thin dashed lines show predicted polar wander path from plate/hotspots motion models of Duncan and Clague[15] and Wessel et al[62]. Inset sketch map shows interpreted phases of polar wander, revised from Sager[56]早期古地磁专家试图通过对海底火山的古地磁测试来解决热点移动问题,如Kono[63]、Cox和Gordon[64]、Tarduno和Cottrell[24]、以及Sager[65]分别测定了Suiko海山和Detroit海山的古纬度,但是受方法和样品复杂性限制,无法给出统一的结果[24, 63, 66-68]。为了解决该问题,2001年大洋钻探(ODP)197航次直接钻取了皇帝海山链的样品,其中一个主要目的是获取适于古地磁古纬度和放射性年代测定的熔岩流岩芯,以便证实夏威夷热点南向运动的假说[28]。Tarduno[25]对夏威夷-皇帝海山链的古地磁研究结果发现,Detroit海山(75~81 Ma)的古纬度为32°±8.8°N,Nintoku海山(56 Ma)的古纬度为26°±5.6°N,KoKo海山(49 Ma)的古纬度为21°±5.5°N(图5)。根据年龄与古纬度的对比得出,火山热点在81~47 Ma期间以3~5 cm/a的速度向南移动[69]。Sager[66, 70]对弯折处及其东边七处海山的古地磁模拟研究表明,其古纬度(19.4°±7.4°)与现今夏威夷热点的古纬度值基本一致,说明热点的南向移动在弯折处停止。
![]() 图 5 ODP197航次站位(1206,光孝海山;1205,推古海山;1204和1203,底特律海山),ODP884站位(底特律海山)以及DSDP433站位(仁德海山))的古纬度值蓝色三角形为热退磁结果,紫色三角形为交变退磁结果。433站位为热退和交变退磁结果(修改自Tarduno等[25])Figure 5. Paleolatitude data from ODP Leg 197 (sites 1206, Koko seamount; 1206, Nintoku Seamount; 1204 and 1203, Detroit Seamount), ODP site (884 Detroit Seamount), and DSDP (Site 433, Suiko Seamount)Blue triangle, results of thermal demagnetization; Purple, results of alternating field demagnetization; Results from 433 is based on AF and thermal data (Revised from Tarduno et al[25])
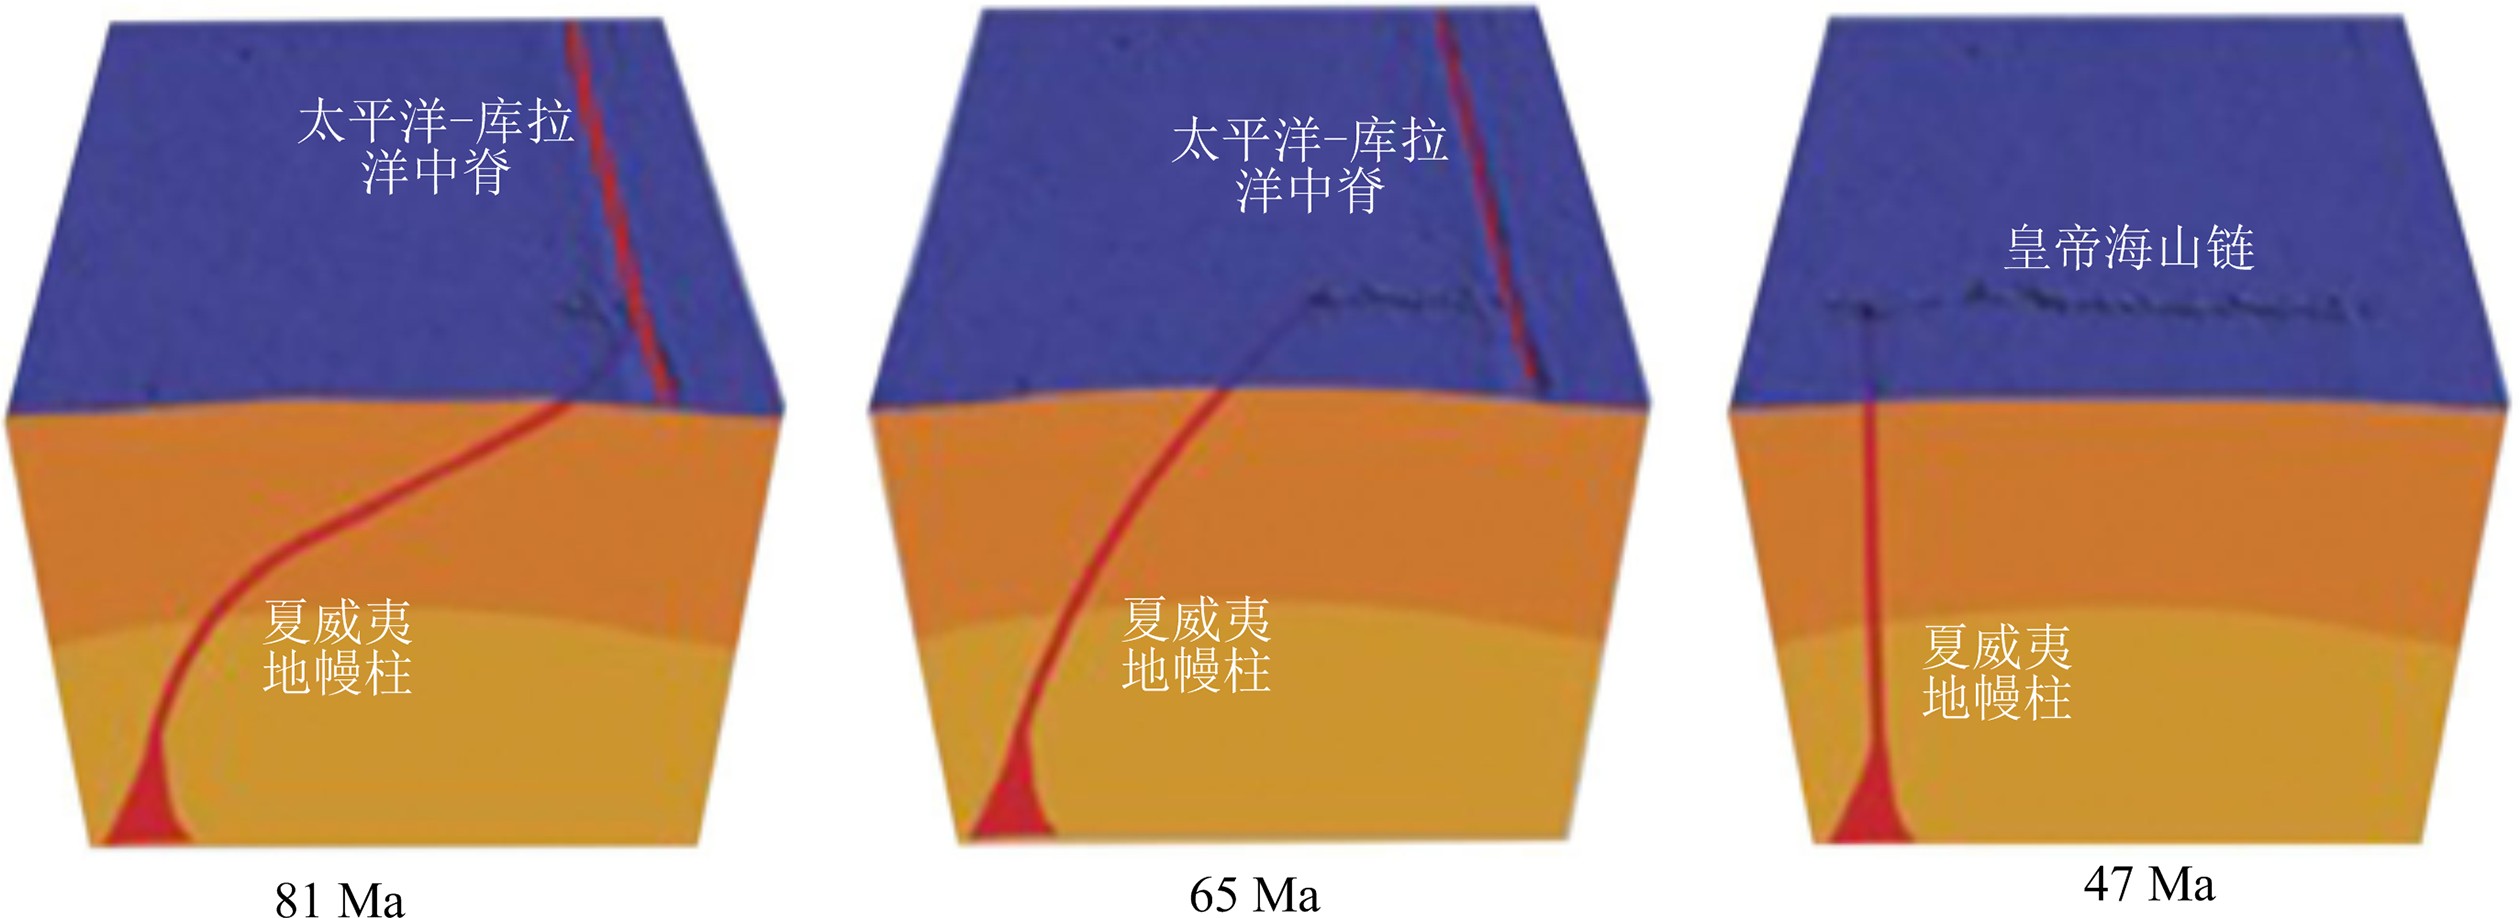
图 5 ODP197航次站位(1206,光孝海山;1205,推古海山;1204和1203,底特律海山),ODP884站位(底特律海山)以及DSDP433站位(仁德海山))的古纬度值蓝色三角形为热退磁结果,紫色三角形为交变退磁结果。433站位为热退和交变退磁结果(修改自Tarduno等[25])Figure 5. Paleolatitude data from ODP Leg 197 (sites 1206, Koko seamount; 1206, Nintoku Seamount; 1204 and 1203, Detroit Seamount), ODP site (884 Detroit Seamount), and DSDP (Site 433, Suiko Seamount)Blue triangle, results of thermal demagnetization; Purple, results of alternating field demagnetization; Results from 433 is based on AF and thermal data (Revised from Tarduno et al[25])为了判定该热点移动是全球性事件还是局部事件,前人通过对南大洋的路易斯维尔海脊的运动研究,发现二者线路上存在若干一致性,但是该海脊在47 Ma没有表现出如此明显的弯折,这说明该转向应该是局部事件[18-19, 71]。根据板块重建及海山的地球化学特征[72-74],Tarduno等[22]对该行为提出了一种可能的解释机制。他们认为在81 Ma,夏威夷热点被太平洋-库拉洋中脊系统牵引,地幔热柱发生弯曲。之后,地幔热柱脱离这种牵引控制,在81~47 Ma期间,逐渐恢复其原始状态(图6)。因此,在47 Ma之前,皇帝海山链同时记录了热点和太平洋板块的运动,47 Ma之后,热点位置基本稳定,夏威夷海山链记录了太平洋西向俯冲模式。
![]() 图 6 夏威夷-皇帝海山链地幔柱牵引和反弹机制81 Ma时,地幔柱在1 200~1 500 km深度处,地幔上升流受太平洋-库拉洋中脊牵引,之后随着上升流减弱,地幔柱逐渐往回折返,并在47 Ma恢复到它本来位置(修改自Tarduno等[22])Figure 6. Schematic diagram of plume capture and release for the Hawaiian-Emperor chainThe plume is bent between 1 200 and 1 500 km depth toward the mantle upwelling associated with the Pacific-Kula ridge system at 81 Ma; upwelling abates thereafter, allowing the plume to return to its original position relative to the deep mantle by 47 Ma (Revised based on Tarduno et al[22])
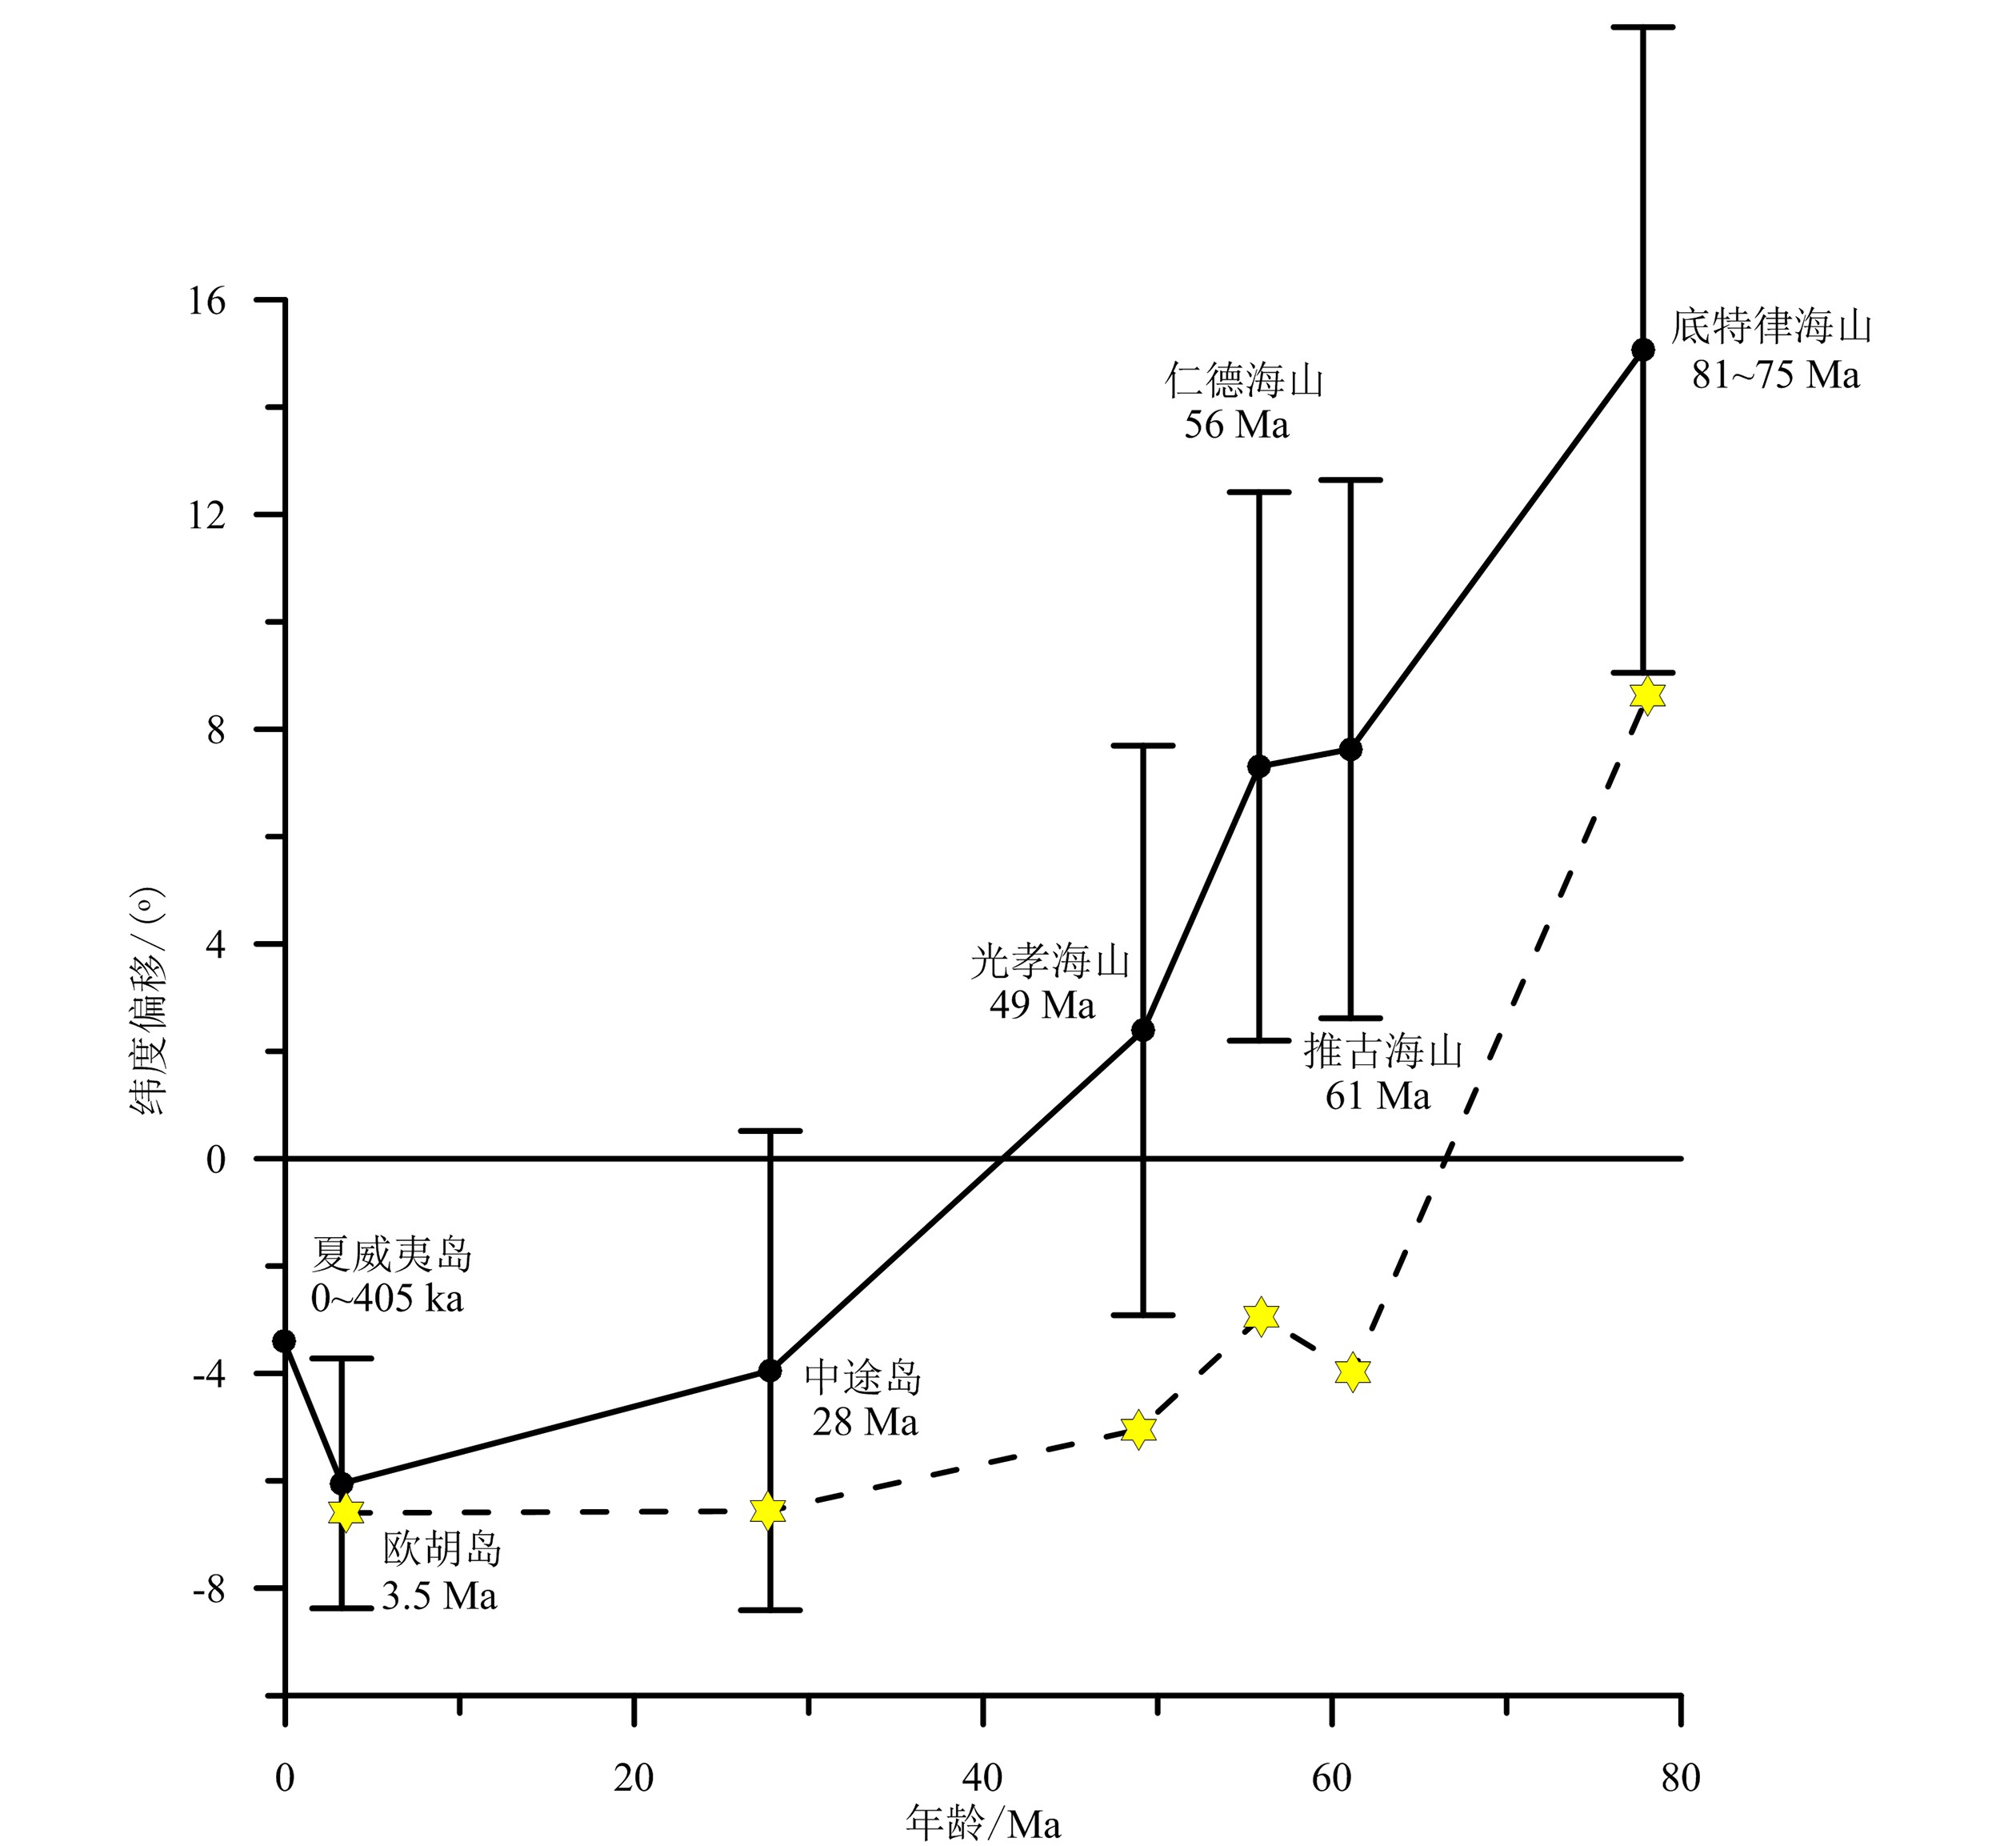
图 6 夏威夷-皇帝海山链地幔柱牵引和反弹机制81 Ma时,地幔柱在1 200~1 500 km深度处,地幔上升流受太平洋-库拉洋中脊牵引,之后随着上升流减弱,地幔柱逐渐往回折返,并在47 Ma恢复到它本来位置(修改自Tarduno等[22])Figure 6. Schematic diagram of plume capture and release for the Hawaiian-Emperor chainThe plume is bent between 1 200 and 1 500 km depth toward the mantle upwelling associated with the Pacific-Kula ridge system at 81 Ma; upwelling abates thereafter, allowing the plume to return to its original position relative to the deep mantle by 47 Ma (Revised based on Tarduno et al[22])综合太平洋板块的视极移曲线和海山的古纬度分析,可以看出夏威夷-皇帝海山链以及47 Ma的弯折主要由夏威夷热点的南向移动和太平洋板块的西向运动共同作用导致,47 Ma的弯折是因为热点移动停止。Butterworth等[75]通过对早新生代太平洋板块三维俯冲模型的模拟也进一步证实,该时期太平洋板块驱动力的变化只能使太平洋板块绝对运动方向产生相对较小的改变,对47 Ma夏威夷-皇帝海山链转向的贡献很小。但是,Torsvik等人[13]从几何学、运动学模拟以及古地磁学等角度综合分析,指出单纯热点的南向移动不能让海山产生如此大的位移量,太平洋板块在纬向上的移动不可忽视,并且应该起主导作用。另外,他们提出前人的古地磁数据存在一个很重要的问题,认为在晚白垩世不存在真极移[23-24, 76],因此在将古纬度数据转化为热点移动速度时没有进行真极移校正,即测量的古纬度减掉对应地质时期地磁极移动的纬度值[27]。但是Doubrovine等[27]通过对太平洋、大西洋和印度洋热点的移动过程的计算模拟提出,80~50 Ma存在真极移,极移速度约为1°/Ma。真极移校正结果表明(图7),除了皇帝海山最北端的底特律海山的纬度比现今夏威夷热点的纬度高约9°,其他海山的纬度都与夏威夷纬度相近甚至要低。底特律海山与其他年轻海山不同,具有洋中脊玄武岩的地化特征[73],因此该纬度偏移可能是洋中脊与地幔柱共同作用的结果。而其他海山的纬度明显低于现今夏威夷的纬度,尤其是夏威夷岛上的玄武岩记录的古纬度都比其纬度值低3.4°。这可能是由于夏威夷热点位于太平洋剪切波低速带(LLSVP)的东北缘,磁倾角(纬度)异常可能是核幔边界热流的水平层状变化引起的非偶极子场的影响。这对于根据古纬度变化得到的热点移动论是一个极大的挑战,因为该异常的活动时间以及强度变化是未知的。
![]() 图 7 夏威夷热点的纬向运动古地磁方法得到的皇帝海山链以及夏威夷岛链各海山或岛礁相对于夏威夷热点现今纬度位置(19.4°N)的纬度偏移量[22, 24- 25, 64, 77-79](黑色实心圆)以及经过真极移校正的数据(黄色六角星)(修改自Torsvik等[13])Figure 7. Latitude motion of the Hawaiian hotspotPaleomagnetically derived latitudes (blue ovals connected with the blue line) from seamounts along Emperor chain and islands/atolls along the Hawaiian chain plotted with 95% confidence bars. The data are shown as latitude offsets from the present latitude of Hawaii (observed latitude minus latitude of Hawaii, 19.4°N) (Revised from Torsvik et al[13])
图 7 夏威夷热点的纬向运动古地磁方法得到的皇帝海山链以及夏威夷岛链各海山或岛礁相对于夏威夷热点现今纬度位置(19.4°N)的纬度偏移量[22, 24- 25, 64, 77-79](黑色实心圆)以及经过真极移校正的数据(黄色六角星)(修改自Torsvik等[13])Figure 7. Latitude motion of the Hawaiian hotspotPaleomagnetically derived latitudes (blue ovals connected with the blue line) from seamounts along Emperor chain and islands/atolls along the Hawaiian chain plotted with 95% confidence bars. The data are shown as latitude offsets from the present latitude of Hawaii (observed latitude minus latitude of Hawaii, 19.4°N) (Revised from Torsvik et al[13])由于太平洋板块视极移曲线存在时间分辨率低的限制,所以在利用视极移曲线进行板块重建的时候需要谨慎。Wilson[80]认为夏威夷-皇帝海山链转向主要是大尺度的太平洋板块运动变化导致的,皇帝海山链古纬度的变化可能是真极移导致的。Torsvik对前人得到的太平洋板块进行真极移校正发现,太平洋板块在80~40 Ma是向北运动的,这与Doubrovine[27]的运动学模型是一致的。这为太平洋板块在47 Ma运动方向发生转向提供了直接证据。
2.3 夏威夷-皇帝海山链古地磁研究存在的问题
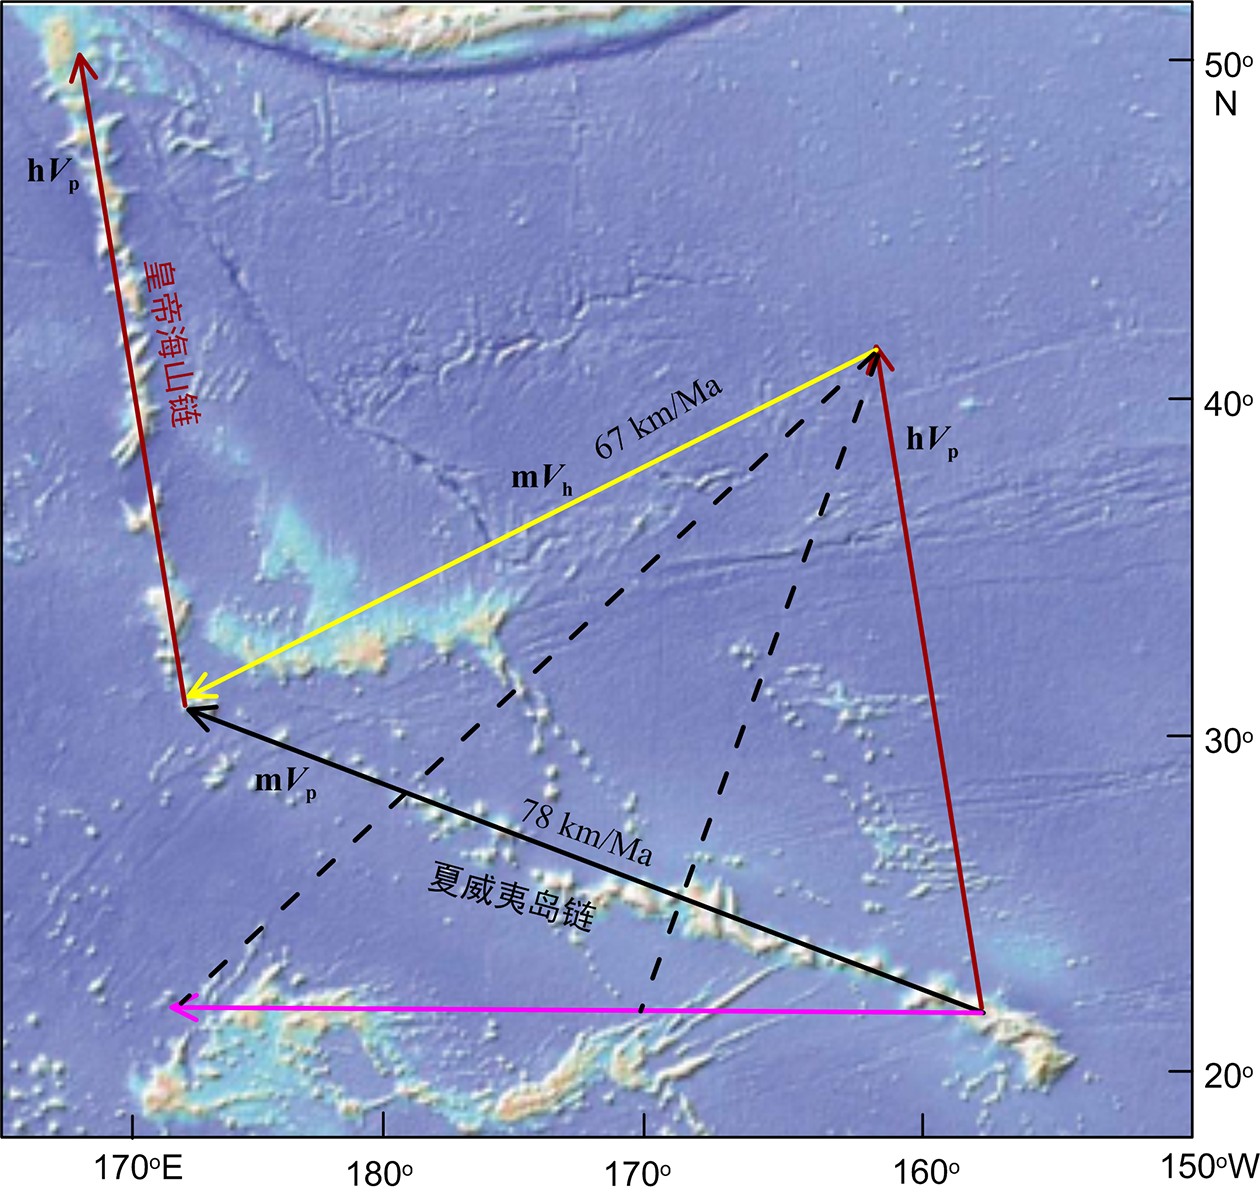
目前古地磁学家在夏威夷热点南向移动这个问题上已经达成共识,争论的焦点在于皇帝海山链以及47 Ma弯折的形成过程中,夏威夷热点的南向移动是否起主导作用,以及太平洋板块在80~49 Ma是否存在明显的纬向运动。解决这些问题需要提高古地磁数据的精度,得到热点和太平洋板块更为精确的运动速度特征(图8)。根据Van der Voo[81]提出的古地磁数据判定标准,夏威夷-皇帝海岭由于其特殊的地理位置,理想古地磁样品的获取难度较大,准确率较低。Tarduno[25]给出的古地磁样品及数据测定方法存在较大的误差,文章所给出古纬度11°的差值可在误差范围内平均掉。另外,同一个地区得到的古地磁结果存在一定的差异,很难对夏威夷热点的移动速度给出精确计算。如Tarduno和Cottrell[24]得到的底特律海山古纬度为36.2°N(+6.9°/−7.2°),Sager[65]选取了不同钻孔的更多样品进行计算,得到的古纬度为42.8°N (+13.2°/−7.6°)。二者得到的移动速度存在很大差异,分别为约50 和68 mm/a。这严重影响对太平洋板块和热点运动特征的判断。另外,Tarduno[23]指出,由于古纬度测量精度的原因,很难监测热点的微小移动。因此提高古地磁数据精度是夏威夷-皇帝海山链的运动学特征研究的关键。同时,目前针对夏威夷-皇帝海山链的古地磁数据都是在假设地层基本水平的前提下得到的,但是每个钻孔的层位并不是完全水平。各海山纬度的差异是真实变化还是地层产状的变化引起的,仍值得商榷。因此,需要对各站位得到的古地磁数据进行必要的层位产状校正。
![]() 图 8 皇帝海山链形成过程中夏威夷热点和太平洋板块运动向量模型图hVp太平洋板块相对于热点的运动速度(红色向量),mVp太平洋板块相对于地幔的运动(假设地幔相对于自转轴固定)(黑色向量)。二者的矢量和mVh代表热点相对于地幔的运动(黄色向量),具有一个很大的西向分量。水平向量(紫色)代表了太平洋板块在没有北向速度分量的情况下表现出来的西向运动。虚线指示了太平洋板块没有北向运动的情况下,热点相对于地幔的运动(引自Sager[56])Figure 8. Sketch of motion vectors indicating Hawaiian hotspot drift during the formation of the Emperor seamountsMotion of plate relative to hotspot, hVp (red vector), given by trend of Emperor seamounts. Motions of plate relative to mantle (assumed fixed relative to spin axis), mVp (black vector), is assumed to be same as at present (Hawaiian chain). Sum is motion of hotspot relative to the mantle, mVh (yellow vector), which has a large westward component. Horizontal vector at bottom (purple) shows Pacific plate motion if the plate had no northward component of velocity. Dashed-line vectors show predicted motion of hotspot relative to mantle if Pacific plate motion has no northward component. Different dashed lines correspond to different westward velocities. Background is a shaded relief plot of Hawaiian-Emperor chain bathymetry (Referred from Sager[56])
图 8 皇帝海山链形成过程中夏威夷热点和太平洋板块运动向量模型图hVp太平洋板块相对于热点的运动速度(红色向量),mVp太平洋板块相对于地幔的运动(假设地幔相对于自转轴固定)(黑色向量)。二者的矢量和mVh代表热点相对于地幔的运动(黄色向量),具有一个很大的西向分量。水平向量(紫色)代表了太平洋板块在没有北向速度分量的情况下表现出来的西向运动。虚线指示了太平洋板块没有北向运动的情况下,热点相对于地幔的运动(引自Sager[56])Figure 8. Sketch of motion vectors indicating Hawaiian hotspot drift during the formation of the Emperor seamountsMotion of plate relative to hotspot, hVp (red vector), given by trend of Emperor seamounts. Motions of plate relative to mantle (assumed fixed relative to spin axis), mVp (black vector), is assumed to be same as at present (Hawaiian chain). Sum is motion of hotspot relative to the mantle, mVh (yellow vector), which has a large westward component. Horizontal vector at bottom (purple) shows Pacific plate motion if the plate had no northward component of velocity. Dashed-line vectors show predicted motion of hotspot relative to mantle if Pacific plate motion has no northward component. Different dashed lines correspond to different westward velocities. Background is a shaded relief plot of Hawaiian-Emperor chain bathymetry (Referred from Sager[56])3. 研究展望
多年来夏威夷-皇帝海山链的成因机制一直是争论的热点,不论是夏威夷热点移动还是太平洋板块运动转向,单一因素都不能完美地解释47 Ma弯折的几何形态和年龄特征,因此该海山链是二者共同作用的结果。对于夏威夷-皇帝海山链的成因机制研究方面还有以下问题需要深入讨论:
(1)47~81 Ma夏威夷热点和太平洋板块精细的运动学过程以及二者移动速度的精确计算,这需要更高精度的古地磁数据的支撑,对于太平洋板块的古地理重建具有重要的指示意义。
(2)夏威夷热点移动和太平洋板块运动转向的触发机制探讨。尽管夏威夷-皇帝海山链的形成是夏威夷热点移动和太平洋板块运动转向共同作用的结果,但是47 Ma时太平洋板块转向以及夏威夷热点停止移动仍是未解之谜,这需要结合其他海山链以及太平洋边缘俯冲带地区寻找可能的线索,同时加入数值模拟手段进行深入研究。对这些问题的深入剖析,对于全球深部地球动力学以及岩石圈构造演化历史具有更加深远的意义。
致谢:感谢中国科学院地质与地球物理研究所靳春胜副研究员和自然资源部第一海洋研究所葛淑兰研究员提供的宝贵意见。
-
图 4 太平洋板块的视极移曲线(APWP)(蓝色粗虚线)
其中红色星号代表地磁极位置[60, 61],星号附近的数字代表对应的年龄(Ma),实线椭圆代表每个极位置95%的置信区间。蓝色圆点和蓝色细虚线为根据热点轨迹得到的太平洋板块的极移曲线[15, 62]。插图表明了极移的不同阶段,引自Sager[56]
Figure 4. Apparent polar wander path in the Pacific (APWP)
The red stars denote pole positions defining the most likely APWP shown by the blue dashed line. Poles are surrounded by 95% confidence ellipses and labeled by age in Ma. Thin dashed lines show predicted polar wander path from plate/hotspots motion models of Duncan and Clague[15] and Wessel et al[62]. Inset sketch map shows interpreted phases of polar wander, revised from Sager[56]
图 5 ODP197航次站位(1206,光孝海山;1205,推古海山;1204和1203,底特律海山),ODP884站位(底特律海山)以及DSDP433站位(仁德海山))的古纬度值
蓝色三角形为热退磁结果,紫色三角形为交变退磁结果。433站位为热退和交变退磁结果(修改自Tarduno等[25])
Figure 5. Paleolatitude data from ODP Leg 197 (sites 1206, Koko seamount; 1206, Nintoku Seamount; 1204 and 1203, Detroit Seamount), ODP site (884 Detroit Seamount), and DSDP (Site 433, Suiko Seamount)
Blue triangle, results of thermal demagnetization; Purple, results of alternating field demagnetization; Results from 433 is based on AF and thermal data (Revised from Tarduno et al[25])
图 6 夏威夷-皇帝海山链地幔柱牵引和反弹机制
81 Ma时,地幔柱在1 200~1 500 km深度处,地幔上升流受太平洋-库拉洋中脊牵引,之后随着上升流减弱,地幔柱逐渐往回折返,并在47 Ma恢复到它本来位置(修改自Tarduno等[22])
Figure 6. Schematic diagram of plume capture and release for the Hawaiian-Emperor chain
The plume is bent between 1 200 and 1 500 km depth toward the mantle upwelling associated with the Pacific-Kula ridge system at 81 Ma; upwelling abates thereafter, allowing the plume to return to its original position relative to the deep mantle by 47 Ma (Revised based on Tarduno et al[22])
图 7 夏威夷热点的纬向运动
古地磁方法得到的皇帝海山链以及夏威夷岛链各海山或岛礁相对于夏威夷热点现今纬度位置(19.4°N)的纬度偏移量[22, 24- 25, 64, 77-79](黑色实心圆)以及经过真极移校正的数据(黄色六角星)(修改自Torsvik等[13])
Figure 7. Latitude motion of the Hawaiian hotspot
Paleomagnetically derived latitudes (blue ovals connected with the blue line) from seamounts along Emperor chain and islands/atolls along the Hawaiian chain plotted with 95% confidence bars. The data are shown as latitude offsets from the present latitude of Hawaii (observed latitude minus latitude of Hawaii, 19.4°N) (Revised from Torsvik et al[13])
图 8 皇帝海山链形成过程中夏威夷热点和太平洋板块运动向量模型图
hVp太平洋板块相对于热点的运动速度(红色向量),mVp太平洋板块相对于地幔的运动(假设地幔相对于自转轴固定)(黑色向量)。二者的矢量和mVh代表热点相对于地幔的运动(黄色向量),具有一个很大的西向分量。水平向量(紫色)代表了太平洋板块在没有北向速度分量的情况下表现出来的西向运动。虚线指示了太平洋板块没有北向运动的情况下,热点相对于地幔的运动(引自Sager[56])
Figure 8. Sketch of motion vectors indicating Hawaiian hotspot drift during the formation of the Emperor seamounts
Motion of plate relative to hotspot, hVp (red vector), given by trend of Emperor seamounts. Motions of plate relative to mantle (assumed fixed relative to spin axis), mVp (black vector), is assumed to be same as at present (Hawaiian chain). Sum is motion of hotspot relative to the mantle, mVh (yellow vector), which has a large westward component. Horizontal vector at bottom (purple) shows Pacific plate motion if the plate had no northward component of velocity. Dashed-line vectors show predicted motion of hotspot relative to mantle if Pacific plate motion has no northward component. Different dashed lines correspond to different westward velocities. Background is a shaded relief plot of Hawaiian-Emperor chain bathymetry (Referred from Sager[56])
-
[1] Wilson J T. A possible origin of the Hawaiian islands [J]. Canadian Journal of Physics, 1963, 41(6): 863-870. doi: 10.1139/p63-094
[2] Morgan W J. Deep mantle convection plumes and plate motions [J]. AAPG Bulletin, 1972, 56(2): 203-213.
[3] Clague D A, Dalrymple G B. Tectonics, geochronology and origin of the Hawaiian-Emperor volcanic chain[M]//Winterer E L, Huss D M, Decker R W. The Eastern Pacific Ocean and Hawaii. The Geology of North America. Geological Society of America, 1989: 188-217.
[4] Sharp W D, Clague D A. An older, slower Hawaii-Emperor bend[Z]. United States: American Geophysical Union, 2002.
[5] O'Connor J M, Steinberger B, Regelous M, et al. Constraints on past plate and mantle motion from new ages for the Hawaiian-Emperor Seamount Chain [J]. Geochemistry, Geophysics, Geosystems, 2013, 14(10): 4564-4584. doi: 10.1002/ggge.20267
[6] Depaolo D J, Manga M. Deep origin of hotspots: The mantle plume model [J]. Science, 2003, 300(5621): 920-921. doi: 10.1126/science.1083623
[7] Foulger G R, Natland J H. Is "Hotspot" volcanism a consequence of plate tectonics? [J]. Science, 2003, 300(5621): 921-922. doi: 10.1126/science.1083376
[8] Hilde T W C, Uyeda S, Kroenke L. Evolution of the western pacific and its margin [J]. Tectonophysics, 1977, 38(1-2): 145-165. doi: 10.1016/0040-1951(77)90205-0
[9] Hill R I, Campbell I H, Davies G F, et al. Mantle plumes and continental tectonics [J]. Science, 1992, 256(5054): 186-193. doi: 10.1126/science.256.5054.186
[10] Niu Y. Origin of the 43 Ma bend along the Hawaiian-Emperor seamount chain: Problem and solution[M]//Hekinian R, Cheminée J L, Stoffers P. Oceanic Hotspots. Berlin Heidelberg: Springer, 2004: 143-155.
[11] Smith A D. A plate model for Jurassic to Recent intraplate volcanism in the Pacific Ocean basin[C]//Foulger G R, Jurdy D M. Plates, Plumes and Planetary Processes. Geological Society of America, 2007, 430: 471-495.
[12] Stock J. Hotspots come unstuck [J]. Science, 2003, 301(5636): 1059-1060. doi: 10.1126/science.1089049
[13] Torsvik T H, Doubrovine P V, Steinberger B, et al. Pacific plate motion change caused the Hawaiian-Emperor Bend [J]. Nature Communications, 2017, 8: 15660. doi: 10.1038/ncomms15660
[14] Morgan W J. Convection plumes in the lower mantle [J]. Nature, 1971, 230(5288): 42-43. doi: 10.1038/230042a0
[15] Duncan R A, Clague D A. Pacific plate motion recorded by linear volcanic chains[M]//Nairn A E M, Stehli F G, Uyeda S. The Ocean Basins and Margins. Boston, MA: Springer, 1985: 89-121.
[16] Molnar P, Atwater T. Relative motion of hot spots in the mantle [J]. Nature, 1973, 246(5431): 288-291. doi: 10.1038/246288a0
[17] Molnar P, Stock J. Relative motions of hotspots in the Pacific, Atlantic and Indian Oceans since late Cretaceous time [J]. Nature, 1987, 327(6123): 587-591. doi: 10.1038/327587a0
[18] Norton I O. Global hotspot reference frames and plate motion[C]//Richards M A, Gordon R G, van der Hilst R D. The History and Dynamics of Global Plate Motions. Washington, DC: AGU, 2000, 121: 339-357.
[19] Norton I O. Plate motions in the North Pacific: The 43 Ma nonevent [J]. Tectonics, 1995, 14(5): 1080-1094. doi: 10.1029/95TC01256
[20] Butler R F. Paleomagnetism: Magnetic Domains to Geologic Terranes[M]. Boston: Blackwell Scientific Publications, 1992.
[21] Tauxe L. Essentials of Paleomagnetism[M]. Berkeley: University of California Press, 2010.
[22] Tarduno J, Bunge H P, Sleep N, et al. The bent Hawaiian-Emperor hotspot track: Inheriting the mantle wind [J]. Science, 2009, 324(5923): 50-53. doi: 10.1126/science.1161256
[23] Tarduno J A. On the motion of Hawaii and other mantle plumes [J]. Chemical Geology, 2007, 241(3-4): 234-247. doi: 10.1016/j.chemgeo.2007.01.021
[24] Tarduno J A, Cottrell R D. Paleomagnetic evidence for motion of the Hawaiian hotspot during formation of the Emperor seamounts [J]. Earth & Planetary Science Letters, 1997, 153(3-4): 171-180.
[25] Tarduno J A, Duncan R A, Scholl D W, et al. The Emperor Seamounts: Southward motion of the Hawaiian hotspot plume in Earth's mantle [J]. Science, 2003, 301(5636): 1064-1069. doi: 10.1126/science.1086442
[26] Christensen U. Fixed hotspots gone with the wind [J]. Nature, 1998, 391(6669): 739-739. doi: 10.1038/35736
[27] Doubrovine P V, Steinberger B, Torsvik T H. Absolute plate motions in a reference frame defined by moving hot spots in the Pacific, Atlantic, and Indian oceans [J]. Journal of Geophysical Research, 2012, 117: B09101. doi: 10.1029/2011JB009072
[28] Duncan R A, Tarduno J A. Motion of the Hawaiian hotspot: a paleomagnetic test [J]. Ocean Drilling Program Scientific Prospectus, 2001, 97: 1-83.
[29] Morgan W J. Hotspot tracks and the opening of the Atlantic and Indian Oceans[M]//Emiliani C. The Oceanic Lithosphere. New York: Wiley, 1981: 443-487.
[30] Müller R D, Royer J Y, Lawver L A. Revised plate motions relative to the hotspots from combined Atlantic and Indian Ocean hotspot tracks [J]. Geology, 1993, 21(3): 275-278. doi: 10.1130/0091-7613(1993)021<0275:RPMRTT>2.3.CO;2
[31] Patriat P, Achache J. India–Eurasia collision chronology has implications for crustal shortening and driving mechanism of plates [J]. Nature, 1984, 311(5987): 615-621. doi: 10.1038/311615a0
[32] Lithgow-Bertelloni C, Richards M A. The dynamics of Cenozoic and Mesozoic plate motions [J]. Reviews of Geophysics, 1998, 36(1): 27-78. doi: 10.1029/97RG02282
[33] Hall C E, Gurnis M, Sdrolias M, et al. Catastrophic initiation of subduction following forced convergence across fracture zones [J]. Earth and Planetary Science Letters, 2003, 212(1-2): 15-30. doi: 10.1016/S0012-821X(03)00242-5
[34] Gurnis M, Hall C, Lavier L. Evolving force balance during incipient subduction [J]. Geochemistry, Geophysics, Geosystems, 2004, 5: Q07001. doi: 10.1029/2003GC000681
[35] Sharp W D, Clague D A. 50-Ma initiation of Hawaiian-Emperor bend records major change in Pacific plate motion [J]. Science, 2006, 313(5791): 1281-1284. doi: 10.1126/science.1128489
[36] Stock J M. The Hawaiian-Emperor bend: Older than expected [J]. Science, 2006, 313(5791): 1250-1251. doi: 10.1126/science.1131789
[37] Koivisto E A, Andrews D L, Gordon R G. Tests of fixity of the Indo-Atlantic hot spots relative to Pacific hot spots [J]. Journal of Geophysical Research, 2014, 119(1): 661-675.
[38] Wright N M, Müller R D, Seton M, et al. Revision of Paleogene plate motions in the Pacific and implications for the Hawaiian-Emperor bend [J]. Geology, 2015, 43(5): 455-458. doi: 10.1130/G36303.1
[39] Li S Z, Suo Y H, Li X Y, et al. Microplate tectonics: new insights from micro-blocks in the global oceans, continental margins and deep mantle [J]. Earth-Science Reviews, 2018, 185: 1029-1064. doi: 10.1016/j.earscirev.2018.09.005
[40] Steinberger B, Sutherland R, O'Connell R J. Prediction of Emperor-Hawaii seamount locations from a revised model of global plate motion and mantle flow [J]. Nature, 2004, 430(6996): 167-173. doi: 10.1038/nature02660
[41] Tarduno J A. Hot spots unplugged [J]. Scientific American, 2008, 298(1): 88-93. doi: 10.1038/scientificamerican0108-88
[42] Duncan R A. Hotspots in the Southern Oceans — an absolute frame of reference for motion of the Gondwana continents [J]. Tectonophysics, 1981, 74(1-2): 29-42. doi: 10.1016/0040-1951(81)90126-8
[43] Parés J M, Moore T C. New evidence for the Hawaiian hotspot plume motion since the Eocene [J]. Earth and Planetary Science Letters, 2005, 237(3-4): 951-959. doi: 10.1016/j.jpgl.2005.06.012
[44] DiVenere V, Kent D V. Are the Pacific and Indo–Atlantic hotspots fixed? Testing the plate circuit through Antarctica [J]. Earth and Planetary Science Letters, 1999, 170(1-2): 105-117. doi: 10.1016/S0012-821X(99)00096-5
[45] Cande S C, Raymond C A, Stock J, et al. Geophysics of the Pitman Fracture Zone and Pacific-Antarctic Plate Motions During the Cenozoic [J]. Science, 1995, 270(5238): 947-953. doi: 10.1126/science.270.5238.947
[46] Doubrovine P V, Tarduno J A. A revised kinematic model for the relative motion between Pacific oceanic plates and North America since the Late Cretaceous [J]. Journal of Geophysical Research, 2008, 113(B12): B12101. doi: 10.1029/2008JB005585
[47] Steinberger B. Plumes in a convecting mantle: Models and observations for individual hotspots [J]. Journal of Geophysical Research, 2000, 105(B5): 11127-11152. doi: 10.1029/1999JB900398
[48] Steinberger B, Antretter M. Conduit diameter and buoyant rising speed of mantle plumes: Implications for the motion of hot spots and shape of plume conduits [J]. Geochemistry, Geophysics, Geosystems, 2006, 7: Q11018. doi: 10.1029/2006GC001409
[49] Sager W W, Bleil U. Latitudinal shift of Pacific hotspots during the late Cretaceous and early Tertiary [J]. Nature, 1987, 326(6112): 488-490. doi: 10.1038/326488a0
[50] 徐文耀. 地磁学[M]. 北京: 地震出版社, 2003: 64-118. XU Wenyao. Geomagnetism[M]. Beijing: Seismic Press, 2003: 64-118.
[51] 朱岗崑. 古地磁学: 基础、原理、方法、成果与应用[M]. 北京: 科学出版社, 2005: 101-112. ZHU Gangkun. Paleomagnetism: Essential, Principle, Methods, and Application[M]. Beijing: Science Press, 2005: 101-112.
[52] 黄宝春. 地球古板块位置的古地磁定位方法[M]//丁仲礼. 固体地球科学研究方法. 北京: 科学出版社, 2013: 805-817. HUANG Baochun. Paleomagnetic location method for paleoplate in the Earth[M]//DING Zhongli. Geophysical Methods. Beijing: Science Press, 2013: 805-817.
[53] Creer K M, Irving E, Runcorn S K. The direction of the Geomagnetic field in remote epochs in Great Britain [J]. Journal of Geomagnetism and Geoelectricity, 1954, 6(4): 163-168. doi: 10.5636/jgg.6.163
[54] Piper J D A. Palaeomagnetism and the Continental Crust[M]. New York: John Wiley & Sons, 1987.
[55] Torsvik T H, Van der Voo R, Redfield T F. Relative hotspot motions versus True Polar Wander [J]. Earth and Planetary Science Letters, 2002, 202(2): 185-200. doi: 10.1016/S0012-821X(02)00807-5
[56] Sager W W. Divergence between paleomagnetic and hotspot-model–predicted polar wander for the Pacific plate with implications for hotspot fixity[C]//Foulger G R, Jurdy D M. Plates, Plumes and Planetary Processes. Geological Society of America, 2007, 430: 335-357.
[57] Acton G D, Gordon R G. A 65 Ma palaeomagnetic pole for the Pacific plate from the skewness of magnetic anomalies 27r-31 [J]. Geophysical Journal International, 1991, 106(2): 407-420. doi: 10.1111/j.1365-246X.1991.tb03904.x
[58] Acton G D, Gordon R G. Paleomagnetic tests of Pacific plate reconstructions and implications for motion between hotspots [J]. Science, 1994, 263(5151): 1246-1254. doi: 10.1126/science.263.5151.1246
[59] Sager W W, Koppers P A A. Late Cretaceous polar wander of the Pacific plate: Evidence of a rapid true polar wander event [J]. Science, 2000, 287(5452): 455-459. doi: 10.1126/science.287.5452.455
[60] Sager W W. Cretaceous paleomagnetic apparent polar wander path for the Pacific plate calculated from Deep Sea Drilling Project and Ocean Drilling Program basalt cores [J]. Physics of the Earth & Planetary Interiors, 2006, 156(3-4): 329-349.
[61] Beaman M, Sager W W, Acton G D, et al. Improved Late Cretaceous and early Cenozoic Paleomagnetic apparent polar wander path for the Pacific plate [J]. Earth & Planetary Science Letters, 2007, 262(1-2): 1-20.
[62] Wessel P, Harada Y, Kroenke L W. Toward a self-consistent, high-resolution absolute plate motion model for the Pacific [J]. Geochemistry, Geophysics, Geosystems, 2006, 7(3): Q03L12. doi: 10.1029/2005gc001000
[63] Kono M. Paleomagnetism of DSDP Leg 55 Basalts and implications for the tectonics of the Pacific Plate [J]. Initial Reports of the Deep Sea Drilling Project, 1980, 55: 737-752.
[64] Cox A, Gordon R G. Paleolatitudes determined from paleomagnetic data from vertical cores [J]. Reviews of Geophysics, 1984, 22(1): 47-72. doi: 10.1029/RG022i001p00047
[65] Sager W W. Basalt core paleomagnetic data from Ocean Drilling Program Site 883 on Detroit Seamount, northern Emperor Seamount chain, and implications for the paleolatitude of the Hawaiian hotspot [J]. Earth & Planetary Science Letters, 2002, 199(3-4): 347-358.
[66] Sager W W. Paleomagnetism of abbott seamount and implications for the latitudinal drift of the Hawaiian Hot Spot [J]. Journal of Geophysical Research: Solid Earth, 1984, 89(B7): 6271-6284. doi: 10.1029/JB089iB07p06271
[67] Kodama K, Uyeda S, Isezaki N. Paleomagnetism of Suiko Seamount, Emperor Seamount Chain [J]. Geophysical Research Letters, 1978, 5(3): 165-168. doi: 10.1029/GL005i003p00165
[68] Tarduno J A. Absolute inclination values from deep sea sediments: A reexamination of the Cretaceous Pacific record [J]. Geophysical Research Letters, 1990, 17(1): 101-104. doi: 10.1029/GL017i001p00101
[69] Duncan R A, Tarduno J A, Scholl D W. 1. Leg 197 Synthesis: Southward motion and geochemical variability of the Hawaiian hotspot[C]//Proceedings of the Ocean Drilling Program, Scientific Results. 2006, 197: 1-39.
[70] Sager W W, Lamarche A J, Kopp C. Paleomagnetic modeling of seamounts near the Hawaiian–Emperor bend [J]. Tectonophysics, 2005, 405(1-4): 121-140. doi: 10.1016/j.tecto.2005.05.018
[71] Koppers A A P, Yamazaki T, Geldmacher J, et al. Limited latitudinal mantle plume motion for the Louisville hotspot [J]. Nature Geoscience, 2012, 5: 911-917. doi: 10.1038/ngeo1638
[72] Cottrell R D, Tarduno J A. A Late Cretaceous pole for the Pacific plate: implications for apparent and true polar wander and the drift of hotspots [J]. Tectonophysics, 2003, 362(1-4): 321-333. doi: 10.1016/S0040-1951(02)00643-1
[73] Keller R A, Fisk M R, White W M. Isotopic evidence for Late Cretaceous plume–ridge interaction at the Hawaiian hotspot [J]. Nature, 2000, 405(6787): 673-676. doi: 10.1038/35015057
[74] Norton I O. Speculations on Cretaceous tectonic history of the Northwest Pacific and a tectonic origin for the Hawaii hotspot[C]//Foulger G R, Jurdy D M. Plates, Plumes and Planetary Processes. Geological Society of America, 2007, 430: 451-470.
[75] Butterworth N P, Müller R D, Quevedo L, et al. Pacific Plate slab pull and intraplate deformation in the early Cenozoic [J]. Solid Earth, 2014, 5: 757-777. doi: 10.5194/se-5-757-2014
[76] Tarduno J A, Gee J. Large-scale motion between Pacific and Atlantic hotspots [J]. Nature, 1995, 378(6556): 477-480. doi: 10.1038/378477a0
[77] Gordon R G, Cape C D. Cenozoic latitudinal shift of the Hawaiian hotspot and its implications for true polar wander [J]. Earth and Planetary Science Letters, 1981, 55(1): 37-47. doi: 10.1016/0012-821X(81)90084-4
[78] Doubrovine P V, Tarduno J A. Late Cretaceous paleolatitude of the Hawaiian Hot Spot: New paleomagnetic data from Detroit Seamount(ODP Site 883) [J]. Geochemistry, Geophysics, Geosystems, 2004, 5: Q11L04. doi: 10.1029/2004GC000745
[79] Cromwell G, Tauxe L, Staudigel H, et al. Paleointensity estimates from historic and modern Hawaiian lava flows using glassy basalt as a primary source material [J]. Physics of the Earth and Planetary Interiors, 2015, 241: 44-56. doi: 10.1016/j.pepi.2014.12.007
[80] Wilson D S. Revision of Paleogene plate motions in the Pacific and implications for the Hawaiian-Emperor bend: comment [J]. Geology, 2016, 44(4): e384. doi: 10.1130/G37388C.1
[81] Van der Voo R. The reliability of paleomagnetic data [J]. Tectonophysics, 1990, 184(1): 1-9. doi: 10.1016/0040-1951(90)90116-P
-
期刊类型引用(1)
1. 胡伟兴,应霖津. “夏威夷—皇帝海山链”试题设计. 中学地理教学参考. 2024(35): 58-60+2 .  百度学术
百度学术
其他类型引用(2)


 下载:
下载:
