Using uranium-series radionuclides as tools for tracing marine sedimentary processes: Source identification, sedimentation rate, and sediment resuspension
-
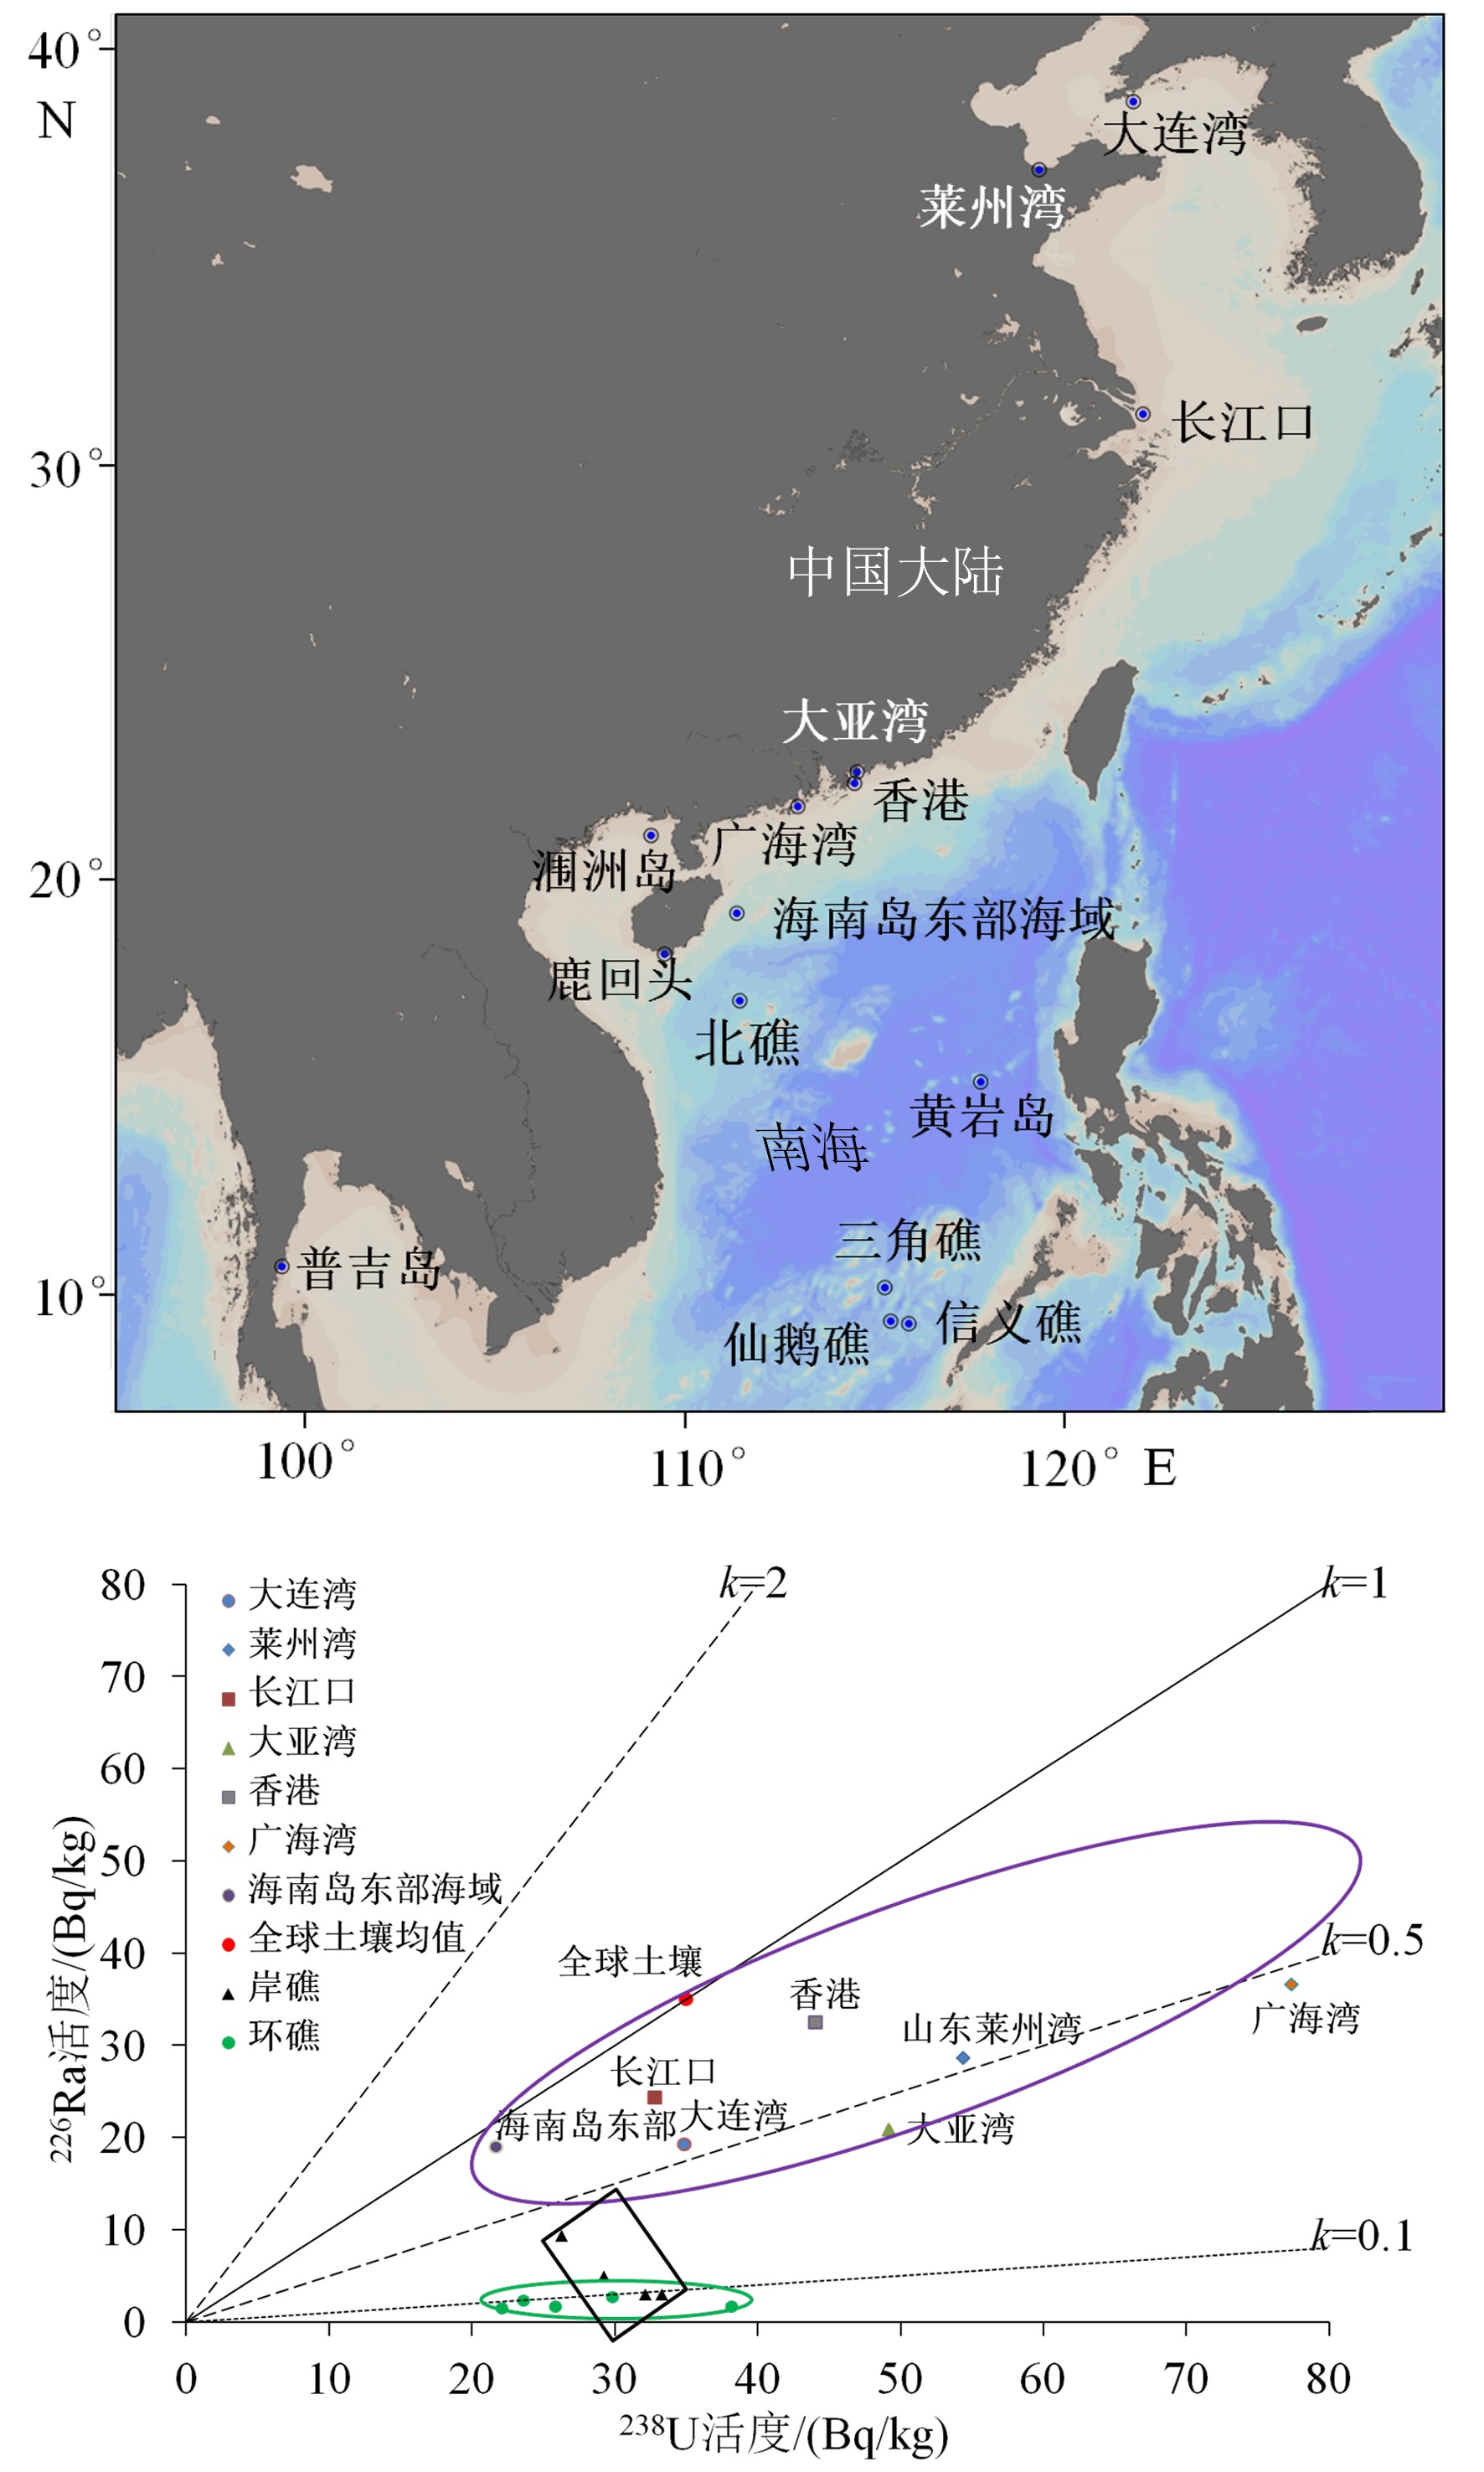
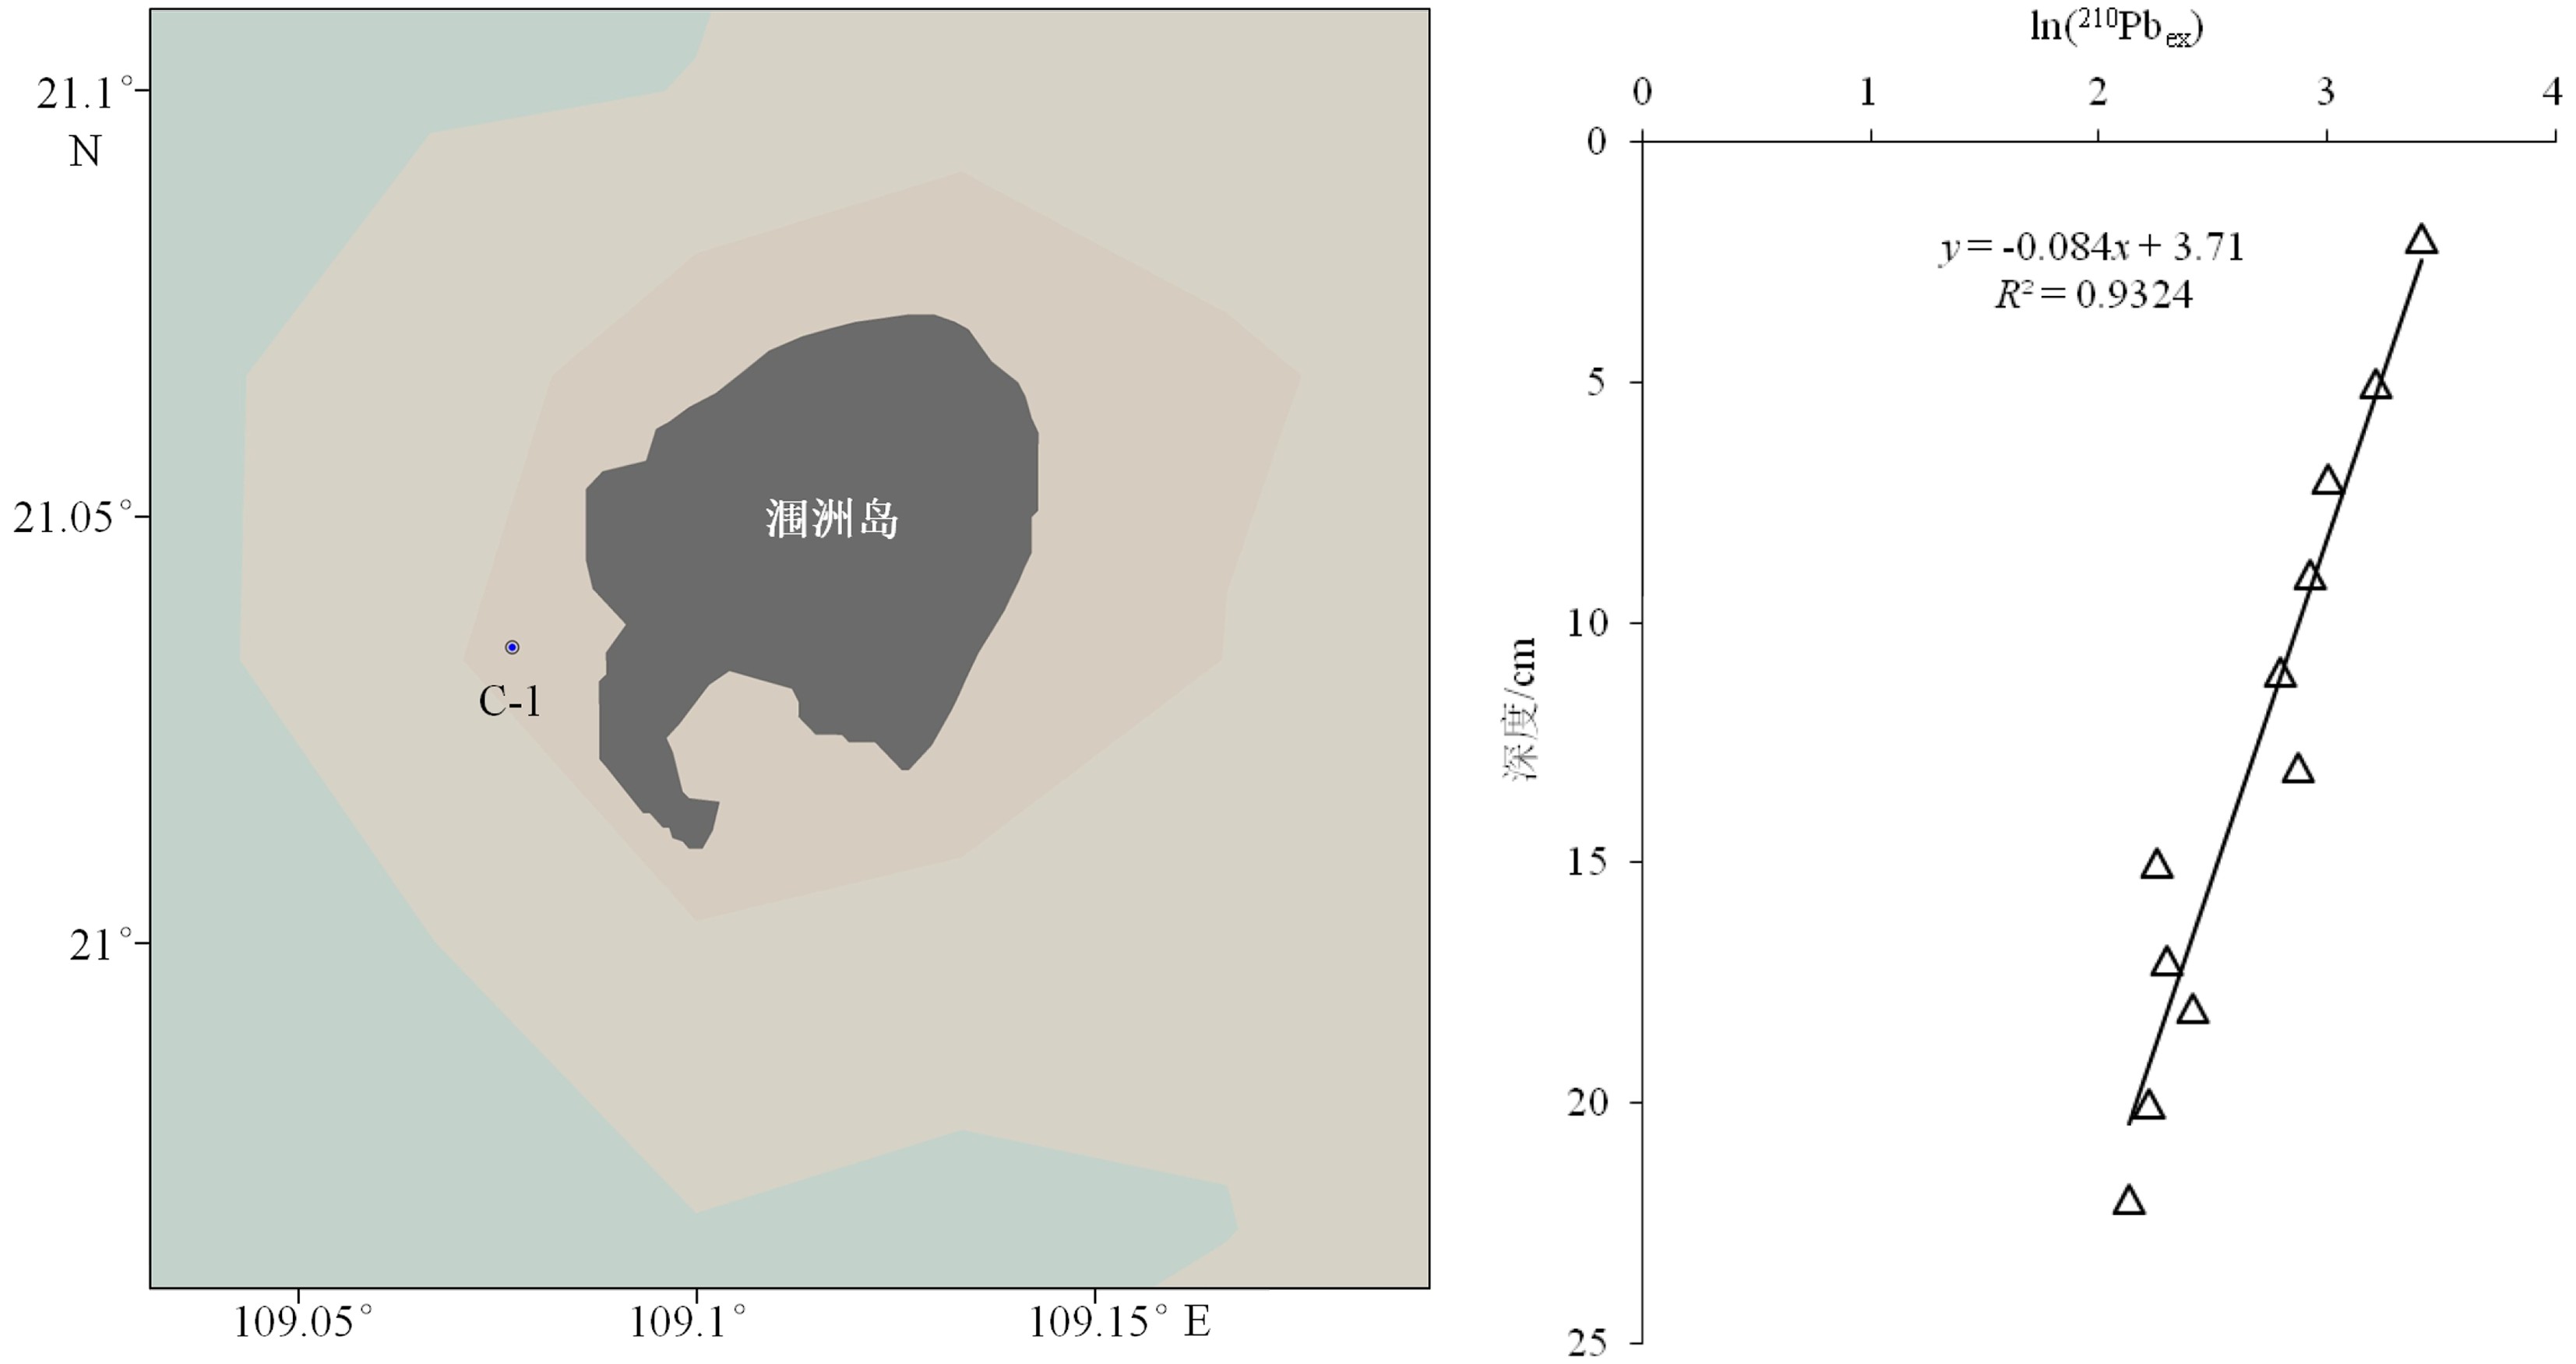
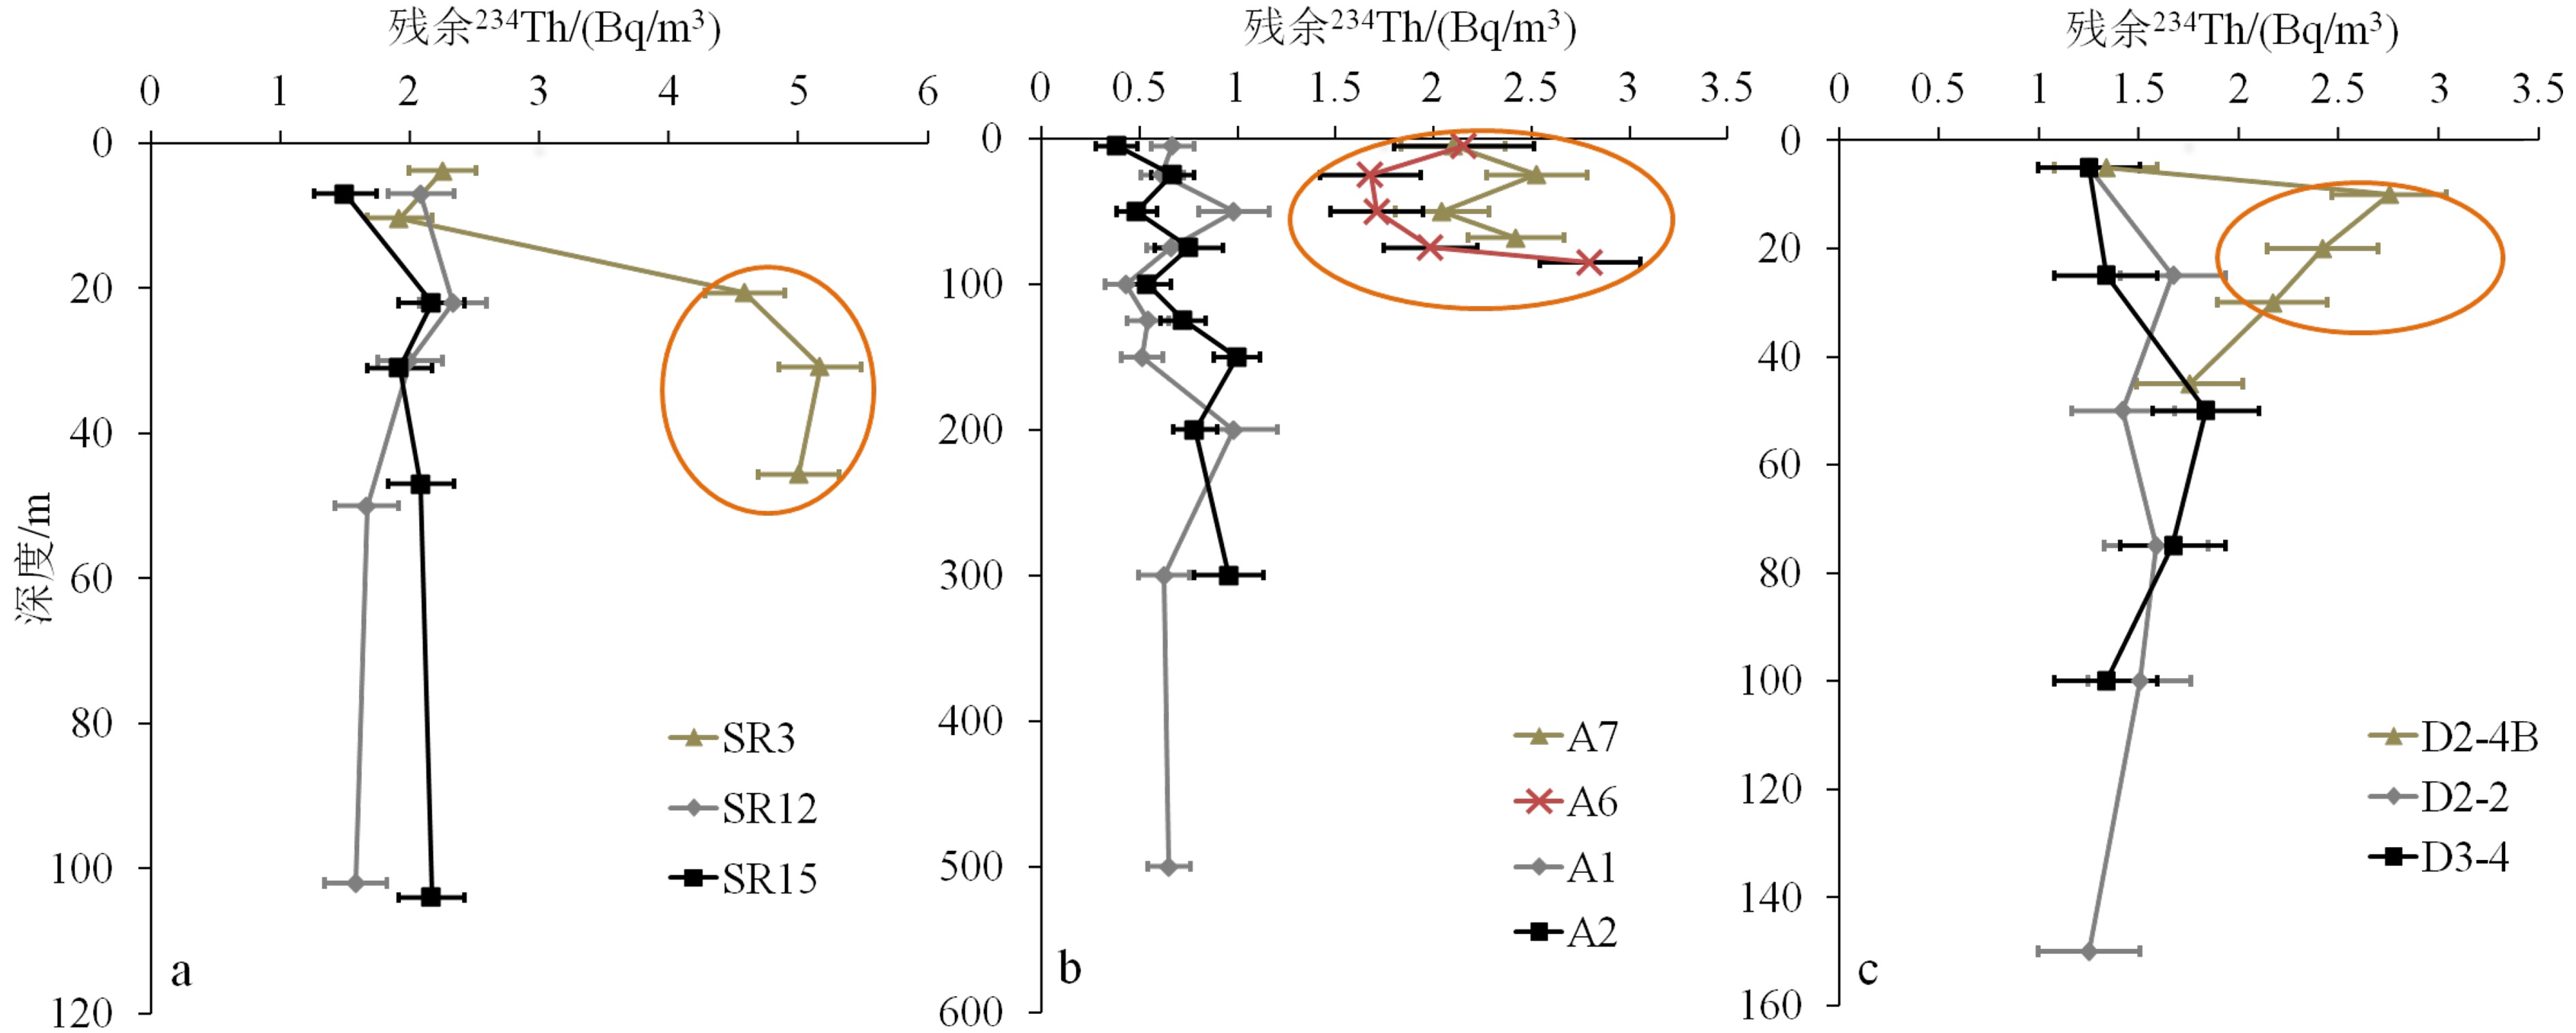
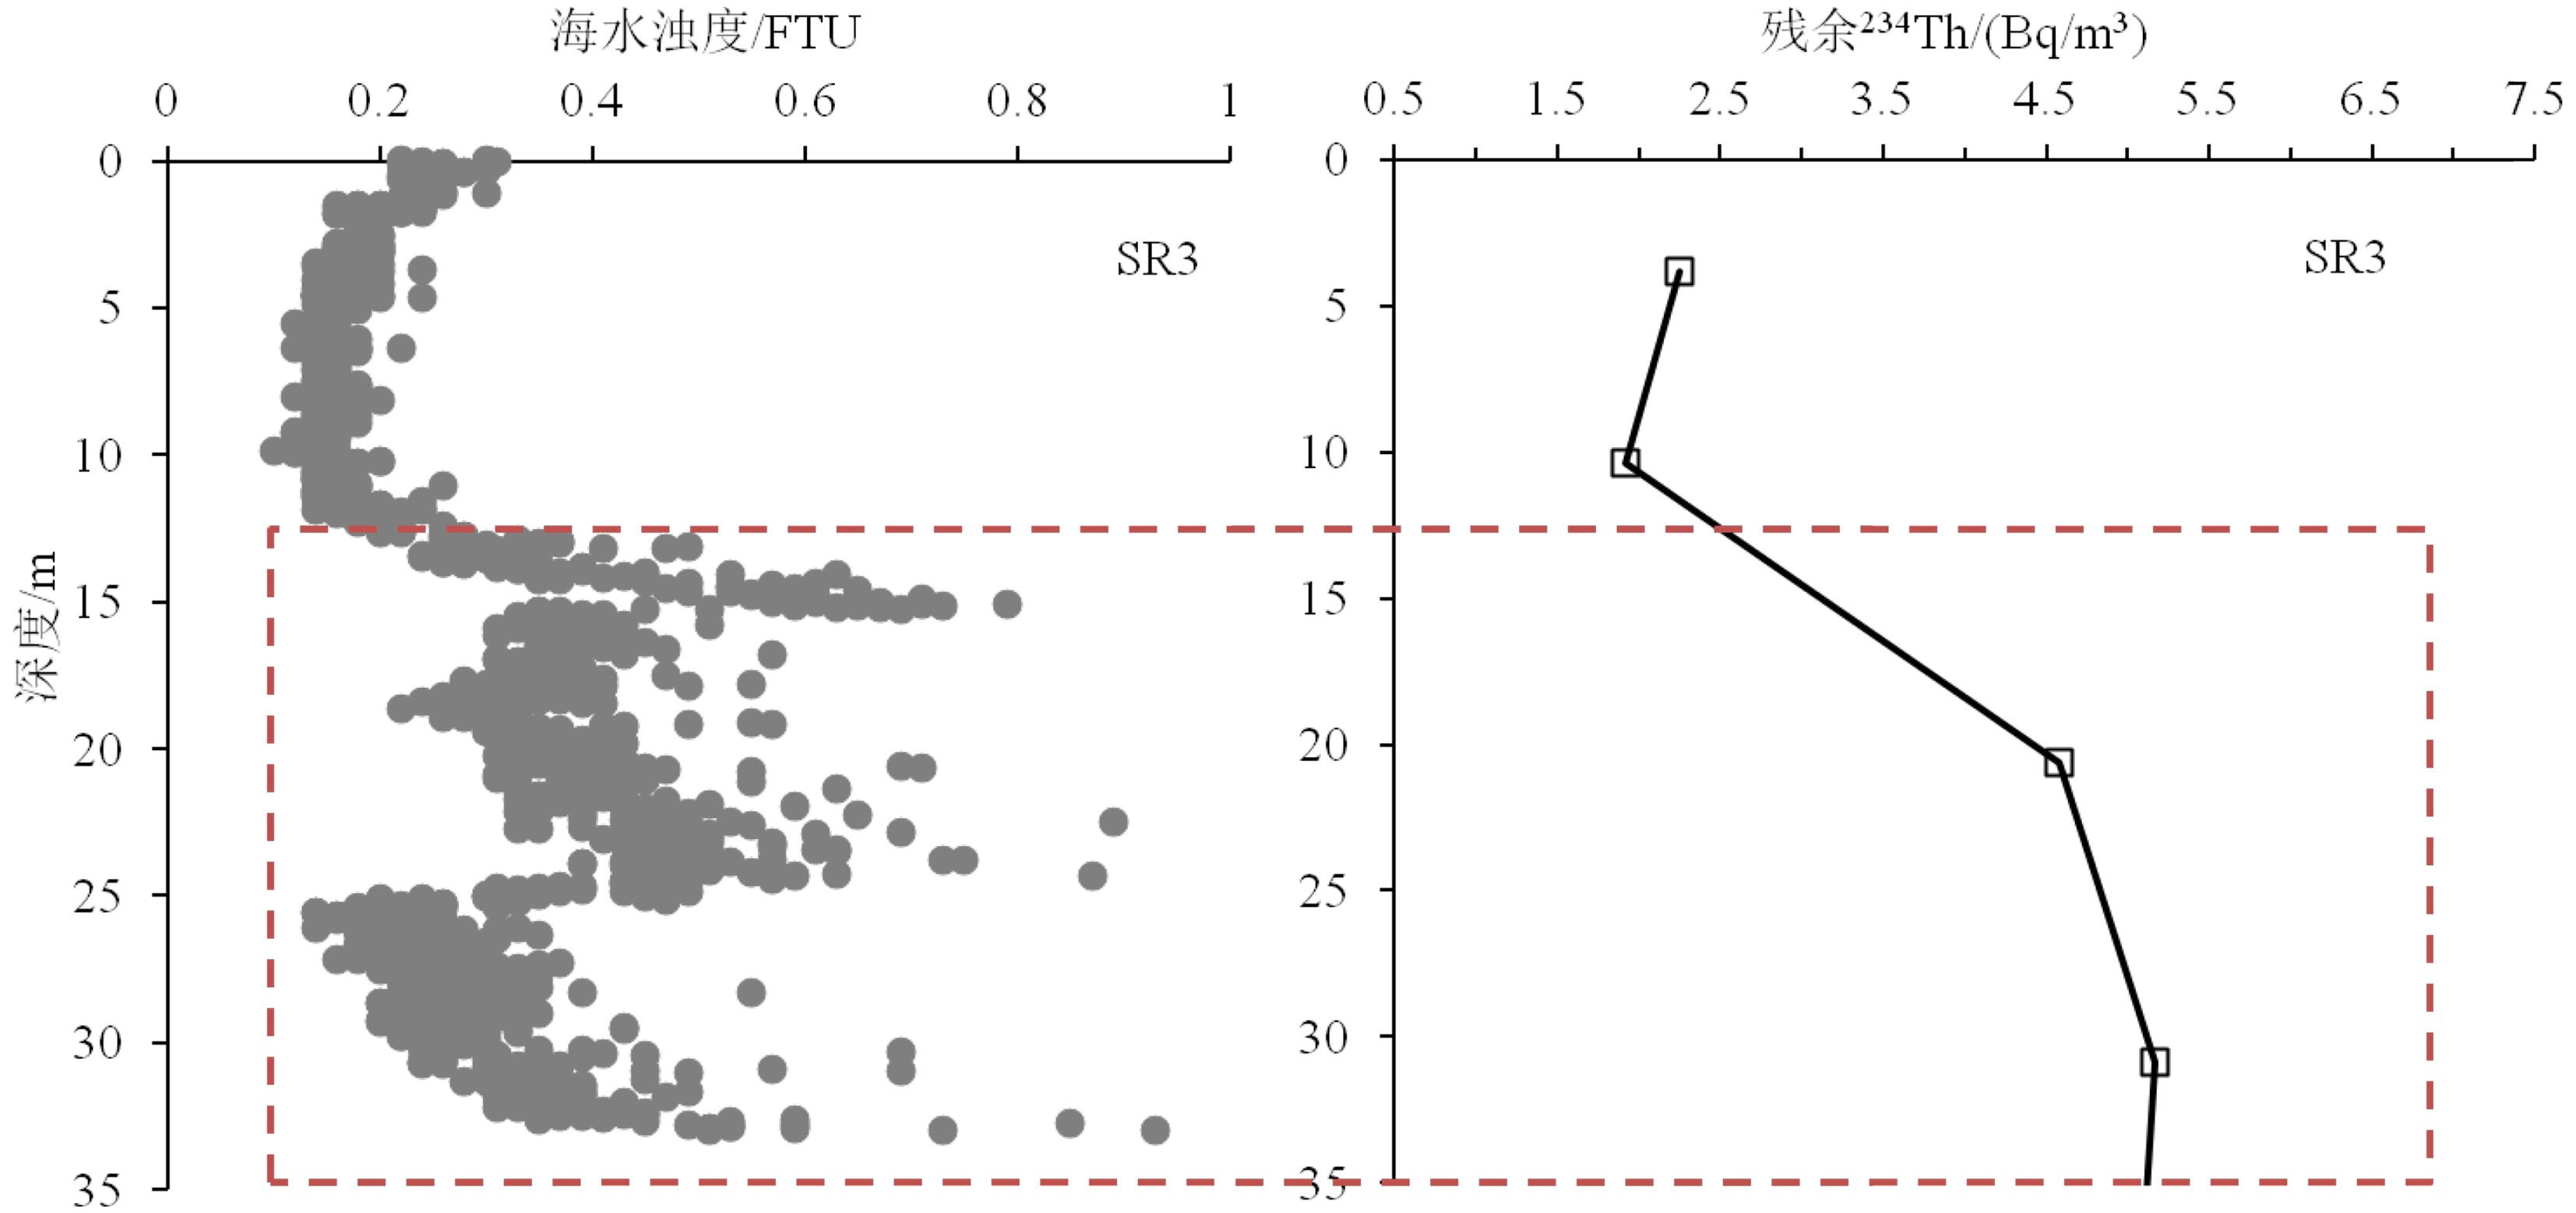
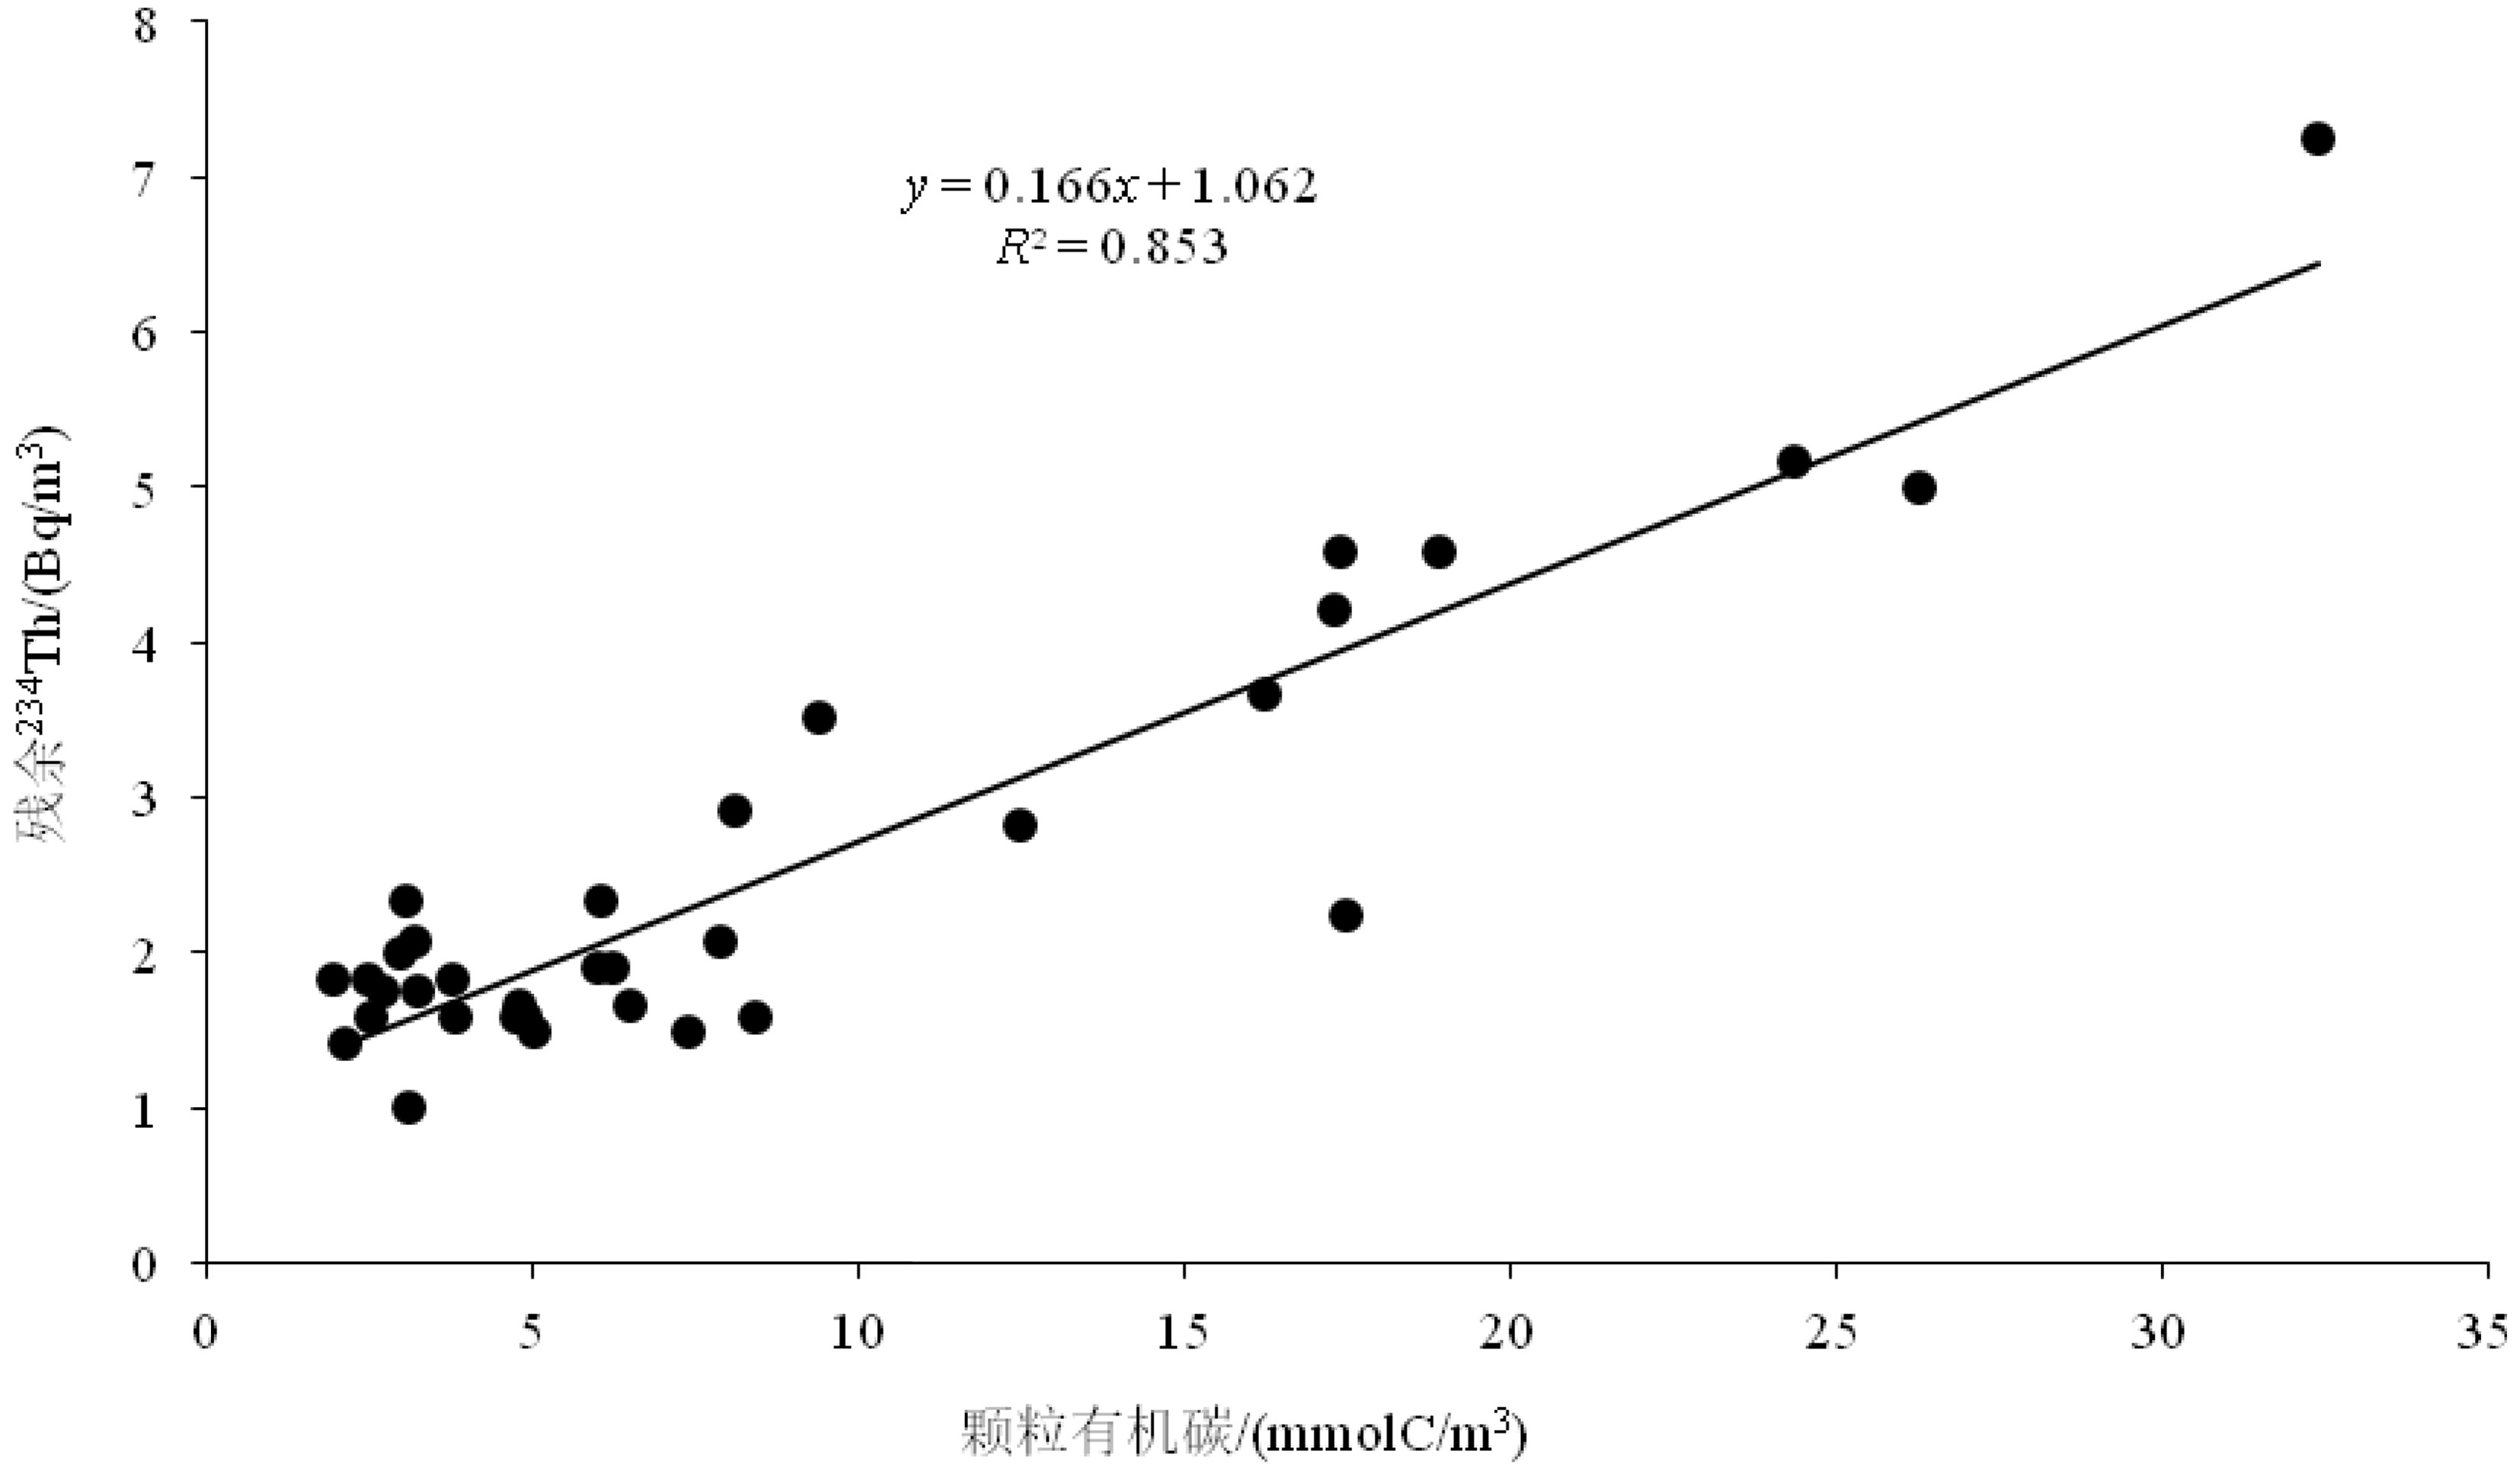
摘要: 放射性核素示踪技术被广泛应用于海洋学研究。海洋沉积物是许多物质的归宿,海洋沉积过程的研究常关注3个关联问题:物质来源、沉积速率、再悬浮过程。针对这3个问题,在南海9个珊瑚礁区、北部湾涠洲岛海域、珠江口、北冰洋、南大洋等多个海区利用典型的铀系放射性核素(210Pb、226Ra、234Th、238U)示踪技术开展海洋沉积过程研究。物源识别方面,研究发现珊瑚礁区沉积物具有极低的226Ra/238U活度比值(<0.1),显著低于其他海区的226Ra/238U活度比值(0.5~1.0),该独特性质可以应用于珊瑚礁区的沉积物/悬浮物来源示踪,是其他传统元素地球化学方法(Al、Ti、稀土元素)的补充。沉积速率方面,基于210Pb的恒定通量恒定沉积速率(Constant Flux Constant Sedimentation Model, CFCS)模式,定量计算了广西涠洲岛珊瑚礁区沉积柱样的沉积速率(3.7±0.6 mm/a),该结果低于中国多个近岸海域的沉积速率(5~96 mm/a)。沉积物再悬浮方面,提出利用“残余234Th”(不同于过剩234Th)示踪海洋沉积物再悬浮过程,并成功应用于北冰洋、南海、南大洋。Abstract: Radionuclides are widely used as tracers in oceanography. As the final fate of many substances, marine sediment is mainly concerned from three perspectives: source identification, sedimentation rate, and sediment resuspension. In the present study, uranium-series radionuclides (210Pb, 226Ra, 234Th, and 238U) are applied in several sea regions such as the nine typical coral reefs in the South China Sea, the Weizhou Island, the Pearl River Estuary, the Arctic Ocean, and the Southern Ocean, to study the sediment source, sedimentation rate, and sediment resuspension. Firstly, activity ratio of 226Ra to 238U was found extremely low (<0.1) in the marine sediment of coral reef regions comparing to the activity ratios (0.5~1.0) in other marine sediments and therefore, it could be used as the tool to identify the sources of marine sediments from coral reef regions in addition to other geochemical tools (Al, Ti, and REE). Secondly, the sedimentation rate (3.7±0.6 mm/a) was calculated for a sediment core taking from the coral reefs near the Weizhou Island via excess 210Pb (Constant Flux Constant Sedimentation Model, CFCS model in brief) which was lower than most figures (5 mm/a~96 mm/a) in other coastal areas of China. Finally, residual β activity of particulate 234Th (RAP234) was proposed for tracking marine sediment resuspension. The RAP234 was successfully applied in the Arctic Ocean, South China Sea, and Southern Ocean. In conclusion, the successful applications of these radioactive tracers have provided potential tools used for tracing marine sedimentary processes in addition to the ongoing toolbox.
-
Keywords:
- radionuclides /
- sediment /
- tracer /
- coral reefs /
- residual β activity of particulate 234Th
-
稀土元素(REE)作为一组紧密共生的元素族,由于其化学性质的特殊性使其被广泛用于海洋科学、地球化学以及工业等领域中[1-5]。稀土元素不仅为海洋物质来源、循环及海洋动力学过程的研究提供了有力的证据[6-11],也成为探索各种地球化学过程的有效指标[12-15]。目前,稀土元素在现代工业需求中占有非常重要的地位[5,16],但是由于资源短缺的问题,使得人们把稀土资源的开发利用转向深海富稀土泥中[17-20],虽然利用矿物学、地球化学等方法在深海稀土元素的来源与富集机制方面的研究取得了一定的进展,但也存在争议。海水中稀土元素最主要的来源是河流输送和大气沉降[21-24],但是在河口低盐度区域,因为胶体的吸附作用导致稀土元素被大量的清除,且有机物质对稀土元素的清除表现为轻稀土(LREE)>中稀土(MREE)>重稀土(HREE),这最终导致海水中的稀土元素呈现出中重稀土富集的趋势[25-27]。随后,Kim等发现地下水会将大量的稀土元素输入到海洋中,并认为这是海水中稀土元素的另一个重要来源[28];同时Chen等的研究证明了浅海及大陆架区域再矿化的孔隙水向海洋中输入稀土元素的量可达到河流的10倍以上[24],而深海斜坡沉积物相也可以通过孔隙水向海水中释放大量的稀土元素,并将沉积物孔隙水释放出的稀土元素视为海水稀土元素新的重要组成部分[25,29]。
孔隙水作为联系海水和沉积物的介质,是痕量元素在固相-液相间相互运移的重要场所,也是痕量元素经过海洋循环的关键过程之一[30-31]。虽然过去的几十年间对湖泊[32]、近海[33]以及部分开阔大洋[13]沉积物孔隙水中的稀土元素的生物地球化学循环过程有了较大的研究进展[23,25,29],但是对于开阔大洋沉积物孔隙水中稀土元素的迁移和循环分析工作仍较为匮乏,深入开展深海沉积物孔隙水中稀土元素的研究可为海洋中稀土元素的来源以及探讨深海富稀土沉积物的成因机制提供关键佐证[34-39]。因此,本文对菲律宾海九州-帕劳海脊东、西两侧钻孔沉积物中的孔隙水进行了采样分析,探讨了孔隙水中主、微量元素以及稀土元素的地球化学特征,并通过与底层海水中稀土元素特征的比较,旨在探讨不同沉积环境中稀土元素的迁移转化规律,以及影响孔隙水中稀土元素分布的因素,为探索深海孔隙水中稀土元素的生物地球化学循环过程及富稀土沉积物的来源和机制奠定研究基础。
1. 样品与分析方法
1.1 采样背景
研究区域位于菲律宾海九州-帕劳海脊附近(图1),2018年8月通过搭载“张謇号”科考船对研究区域开展了详细的地质调查,本文选取了XTZZ40(九州-帕劳海脊东侧,14°54.72’N、133°45.06’E,水深4 590 m)和XTZZb4(九州-帕劳海脊西侧,15°51.78’N、135°49’E,水深4 887 m)两个站位进行了孔隙水中稀土元素地球化学过程研究。两个柱状沉积物取样深度均为顶部100 cm,为深海红黏土,上下均一,孔隙水中Mn离子的含量普遍较低(0.003~0.045 μm),并未达到Mn离子在次还原环境达到的浓度值(>20 μm)[40-41],表明沉积物基本处于氧化环境。
1.2 孔隙水样品的采集和保存
对两个站位0~100 cm深度沉积物中的孔隙水样品进行高精度负压采集(荷兰Rhizosphere公司,型号为Rhizon 19.21.23F,取样头长5 cm,孔径0.2 μm),采样深度分别为:2.5、7.5、10、15、17.5、20、22.5、25、27.5、30、32.5、35、40、45、47.5、50、60、65、70、75、80、90、95、100 cm,然后将采集的样品装入PEDF材质的样品瓶中(收集孔隙水的样品瓶预先在2%的王水中浸泡24 h,然后再浸泡在2%的HCl中24 h,之后用Milli Q水冲洗至中性,洁净实验室内晾干,备用),加入超纯浓盐酸(Merck),调节pH<2,4 ℃保存。
1.3 样品的分析方法
本研究对两个站位共计36个孔隙水样品中的主、微量元素(K、Ca、Mn、Co、Cu、Zn、Sr、Mo)及稀土元素(La-Lu)进行了测定。
(1)样品中的主、微量元素测定方法:准确量取0.1 mL孔隙水样品,加2%硝酸溶液稀释到10 mL;采用美国热电 IRIS Intrepid XSP II ICP-OES 测试常量元素(K、Ca);采用美国瓦里安 820MS 测试Mn、Co、Cu、Zn、Sr、Mo元素。
(2)样品中阴离子测定方法:采用美国戴安 ICS-600-DX 测定SO42−。
(3)孔隙水中稀土元素的测定方法[13]:准确量取4 mL孔隙水样品,加0.2 mL 10 mg/L的Ga标准溶液,充分混匀;采用2 M NH4OH(电子纯)调节pH到9.0,充分摇匀,有白色絮状沉淀;离心机3 000 r/min离心,取沉淀物,并用高纯水润湿;用5% HNO3溶解沉淀物后将其转移到5 mL离心管内,准确定容到4 mL并进行测定。
样品中的主、微量元素及稀土元素的测定均在中科院海洋研究所完成,使用PE公司 DRC II型 ICP-MS 电感耦合等离子质谱仪(ICP-MS)进行测试,加标回收率为93%~103%,其中稀土元素的含量采用澳大利亚后太古代页岩(PAAS)进行标准化[42];Ce/Ce*,Eu/Eu*和MREE/MREE*的计算参照以下公式:
Ce/Ce*=3×Ce/2(La+Nd)
Eu/Eu*=3×Eu/2(Sm+Tb)
MREE/MREE*=2×MREE/(LREE+HREE)。
2. 结果
孔隙水样品中主量元素,微量元素及稀土元素的分析结果见表1和表2。两个站位孔隙水中的主、微量元素的分布特征存在较大的差异(表1),但平均浓度的大小均表现为:K>Ca>Sr>Mo>Zn>Mn>Cu>Co。其中在XTZZb4站位孔隙水中Mn、Co,Cu,Ca,Sr,Mo元素的高含量区域主要集中在浅层(<10 cm),对于XTZZ40站位,Cu和Zn元素的高含量区除了表层以外,40~50 cm层也是其主要的高浓度集中层。两根柱子中Mo元素的剖面分布也略有不同(图2L),XTZZ40站位随着深度的增加,Mo元素浓度有逐渐升高的趋势,但XTZZb4站位样品中除表层和深层外(>80 cm),Mo元素随深度的增加没有明显的变化。另外,Ca元素在XTZZ40站位随着深度的增加,浓度的变化相对平稳,但在XTZZb4站位则波动较大,且两根样品柱Ca元素之间的浓度存在约1.2倍的差异(图2I)。
表 1 孔隙水中主量元素和微量元素的分析结果Table 1. Concentrations of major and trace elements in the pore-water站位 深度/cm Ca/(mg/L) K/(mg/L) Mn/(ng/L) Co/(ng/L) Cu/(ng/L) Zn/(ng/L) Sr/(μg/L) Mo/(μg/L) XTZZ40 2.5 259 367 796 5.5 108 2 574 6 561 9.17 7.5 259 363 428 2.3 50 1 713 6 663 6.78 10 259 392 414 3.1 52 2 137 6 593 10.4 25 258 394 346 3.4 65 1 449 6 432 9.34 42.5 259 425 390 6.5 135 2 984 6 386 11.1 45 259 433 445 5.1 253 3 955 6 465 11.4 55 255 431 445 4.0 60 958 6 409 12.9 60 265 441 421 4.5 73 947 6 929 12.4 65 261 450 664 6.3 111 2 758 6 648 12.3 75 267 433 397 3.7 52 1 634 6 154 11.8 95 263 405 376 5.7 59 927 6 379 13.6 100 305 457 233 2.9 106 1 116 6 510 16.2 XTZZ64 2.5 311 403 184 2.6 70 1 098 6 858 14.7 7.5 315 421 389 4.8 41 1 311 6 845 9.02 10 323 447 2 451 28.4 372 1 983 6 976 8.25 15 267 411 586 6.6 126 2 164 6 238 4.17 17.5 285 439 771 4.7 102 1 748 6 560 9.07 20 288 446 649 6.1 113 2 965 6 584 9.71 22.5 302 454 493 4.5 185 2 573 6 667 9.81 25 305 443 601 4.0 90 1 806 6 564 8.20 27.5 319 453 480 5.6 109 1 477 6 738 9.65 30 282 408 1 219 10.3 142 1 731 6 307 9.38 32.5 301 434 330 3.4 107 1 406 6 074 8.19 35 313 452 215 5.6 72 1 536 6 754 10.1 40 303 444 379 4.0 79 1 067 6 605 7.03 45 300 446 313 3.2 57 1 025 6 588 8.48 47.5 301 441 749 12.1 101 1 215 6 660 9.48 50 300 434 521 8.8 68 1 178 6 570 7.18 60 290 445 290 3.3 63 1 609 6 604 9.59 65 313 465 191 2.8 48 1 044 6 563 7.82 70 303 449 600 5.4 124 2 062 6 481 8.60 75 303 450 480 4.2 114 5 675 6 476 8.85 80 314 461 436 4.7 64 1 873 6 350 9.04 90 303 514 820 7.8 160 1 953 6 425 15.7 95 330 488 451 3.9 174 1 671 6 808 14.7 100 326 483 936 6.3 96 1 590 6 491 13.0 表 2 孔隙水中稀土元素的分析结果Table 2. Concentration of REEs in the pore-waterpmol/kg 站位 深度/cm La Ce Pr Nd Sm Eu Gd Tb Dy Ho Er Tm Yb Lu XTZZ40 2.5 46.39 27.47 1.85 7.48 1.28 0.13 1.14 0.01 0.61 0.04 1.54 0.17 0.63 7.5 21.11 32.86 1.85 7.69 1.54 0.24 1.55 0.14 0.86 0.07 2.13 0.18 0.79 0.04 10 12.23 20.50 1.13 5.00 0.93 0.05 0.84 0.04 0.40 0.01 1.47 0.15 0.22 0.05 25 69.26 96.41 8.15 31.97 5.57 1.26 5.53 1.02 5.27 1.10 6.96 0.71 3.10 0.50 42.5 49.76 26.83 7.04 30.59 6.06 1.27 6.93 1.00 5.42 1.15 4.66 0.74 3.82 0.48 45 67.64 94.41 6.95 27.25 5.24 0.99 5.49 0.53 3.75 0.89 6.71 0.48 2.97 0.43 55 116.28 90.07 9.16 39.21 7.99 1.03 8.33 1.12 6.90 1.12 6.38 0.86 4.42 0.53 60 47.02 53.73 5.35 22.91 4.12 0.84 5.92 0.72 4.41 1.01 4.93 0.49 3.33 0.47 65 11.24 29.78 1.82 7.55 1.84 0.18 1.38 0.05 1.11 0.05 2.31 0.20 1.07 0.05 75 33.66 50.47 7.27 35.83 6.16 1.66 7.31 1.03 6.08 0.98 4.40 0.65 3.16 0.53 95 29.43 36.14 4.60 20.31 4.59 1.01 3.83 0.51 3.76 0.57 2.31 0.45 1.87 0.22 100 20.63 25.49 3.36 15.52 3.00 0.64 3.01 0.52 3.19 0.60 2.16 0.49 2.45 0.32 XTZZ64 2.5 44.87 38.31 6.10 24.79 3.96 1.22 8.05 0.97 5.62 1.39 5.44 0.71 3.54 0.55 7.5 50.60 24.61 3.92 19.45 3.76 0.72 4.29 0.47 4.99 0.82 3.61 0.49 2.66 0.37 10 45.50 27.82 4.82 21.61 3.33 0.51 4.76 0.69 4.38 1.03 3.43 0.53 2.53 0.32 15 40.60 29.18 4.54 21.50 2.92 0.49 4.37 0.52 3.37 0.66 2.74 0.48 2.14 0.26 17.5 48.26 47.08 4.54 20.05 3.58 0.48 4.53 0.53 4.80 0.80 4.14 0.46 2.36 0.34 20 39.60 49.56 4.60 20.62 3.72 2.17 4.53 0.65 3.86 0.82 4.37 0.54 2.29 0.46 22.5 37.32 47.22 4.31 21.54 4.25 0.68 5.03 0.54 3.96 0.90 4.85 0.38 3.01 0.46 25 36.51 35.31 4.11 18.31 4.74 0.57 4.89 0.56 3.61 1.00 3.53 0.39 2.23 0.32 27.5 35.82 36.06 3.70 17.56 2.94 0.15 3.74 0.57 3.20 0.43 3.48 0.47 2.36 0.23 30 42.04 52.90 4.26 20.66 3.32 0.44 3.88 0.59 3.03 0.72 4.92 0.37 2.47 0.25 32.5 34.90 31.23 4.34 17.10 4.03 0.61 4.11 0.53 3.33 0.83 2.80 0.52 2.07 0.33 35 42.45 48.02 4.09 19.71 3.54 0.74 4.56 0.57 3.64 0.72 4.31 0.53 2.54 0.29 40 42.13 36.63 6.21 29.64 6.45 1.39 7.82 0.96 6.17 1.28 5.14 0.75 3.57 0.72 45 40.92 41.99 4.00 18.25 3.51 0.64 4.37 0.46 3.45 0.77 4.30 0.48 2.55 0.26 47.5 34.90 43.08 4.38 21.82 3.60 0.54 4.51 0.53 3.37 0.96 3.17 0.52 1.99 0.26 50 40.03 42.99 4.88 20.79 4.80 0.80 5.97 0.96 4.31 1.07 4.75 0.71 3.64 0.69 60 34.30 36.40 4.16 20.40 3.10 0.51 3.68 0.56 3.40 0.81 3.57 0.39 2.77 0.34 65 28.47 37.17 3.62 14.79 2.44 0.61 4.36 0.48 3.65 0.86 3.81 0.40 2.25 0.33 70 30.87 37.43 4.11 18.45 2.28 0.53 3.89 0.48 4.07 0.92 3.65 0.48 2.46 0.35 75 33.55 40.68 4.41 19.66 3.25 0.63 4.38 0.56 4.15 0.71 4.21 0.45 2.65 0.36 80 36.05 51.44 4.86 20.51 2.91 0.70 4.72 0.58 4.30 0.93 4.05 0.61 3.31 0.34 90 35.91 34.89 4.70 20.10 3.27 0.81 4.21 0.47 3.56 0.74 2.95 0.47 2.80 0.33 95 33.35 42.42 3.67 17.19 3.63 0.56 3.38 0.45 2.98 0.59 3.74 0.39 2.09 0.27 100 30.61 49.24 4.17 19.18 2.78 0.48 5.27 0.28 2.97 0.78 4.15 0.42 2.65 0.31 ![]() 图 2 孔隙水中部分主量元素、微量元素和稀土元素随深度的变化Figure 2. Variations of major elements, trace elements and rare earth elements in the pore-water
图 2 孔隙水中部分主量元素、微量元素和稀土元素随深度的变化Figure 2. Variations of major elements, trace elements and rare earth elements in the pore-water柱状沉积物XTZZ40(海脊东侧,图1)孔隙水中总稀土浓度(ΣREE)范围波动较大(图2F):为43~293 pmol/kg,平均值为138 pmol/kg(n=12),且高浓度的稀土元素主要集中在25~60 cm层;位于海脊西侧的柱状沉积物XTZZb4孔隙水中ΣREE随柱深的增加变化范围较小,为106~148 pmol/kg,平均值为124 pmol/kg(n=24),高浓度的稀土元素主要集中在表层(图2F)。总体上来说,两个站位25~60 cm柱深的孔隙水中,XTZZ40站位稀土元素的平均浓度约为XTZZb4站位的2倍。
采用NdN/YbN、NdN/SmN和 SmN/YbN的比值分别代表轻稀土、中稀土和重稀土之间的比值关系,其中XTZZ40站位孔隙水中的NdN/YbN、NdN/SmN和 SmN/YbN的平均比值分比为0.75(n=12, 0.44~1.57)、0.81(n=12, 0.64~0.92)、0.92(n=12, 0.54~1.87),而XTZZb4站位孔隙水中的NdN/YbN、NdN/SmN和 SmN/YbN的平均比值分别为0.54(n=24, 0.40~0.76)、0.91(n=24, 0.61~1.27)、0.62(n=24, 0.39~0.94)(图2A、B、C)。两个站位样品中REE的配分模式均表现为轻微的向左倾斜,并且重稀土与轻稀土的比值(HREE/LREE)均大于1(图2E),表明两个站位均呈现出轻微的重稀土富集的特征。研究站位XTZZ40站位中稀土富集度(MREE/MREE*)在0~25 cm以浅的沉积物孔隙水中呈现出逐渐升高的趋势,而在25~60 cm的沉积物孔隙水中趋于稳定,随后随着深度的增加又出现波动(65~100 cm);相对而言,XTZZb4站位中稀土富集度从表层至深层基本保持稳定(图2D)。
两个站位孔隙水中的Eu/Eu*平均值分别为0.91(n=12,XTZZ40)和0.94(n=24,XTZZb4)。强烈的Eu正异常值出现在XTZZb4站位20 cm层(Eu/Eu*=2.72),虽然两个站位75~95 cm层均有轻微Eu正异常值的出现,但是在XTZZ40站位的其余层位中均未呈现出Eu异常值(图2H)。另外,XTZZ40和XTZZb4两个站位孔隙水中Ce/Ce*的平均值分别为0.72(n=12)和 0.59(n=24)(图2G),但XTZZ40站位65 cm层的孔隙水中呈现出明显的Ce正异常现象(Ce/Ce*=1.38),其余站位均为负异常。
3. 讨论
3.1 稀土元素的配分模式
底层海水和孔隙水是海底水-沉积物界面主要的物质运输载体,在底层海水与孔隙水相互作用的过程中,底层海水对孔隙水中的稀土元素分布会有一定的影响,从而导致孔隙水中REE的组成相对底层海水有一定的延展性,但是通过本研究结果发现,两个站位孔隙水中的稀土元素浓度均明显低于底层海水(表2)(其中5~3 500 m水深稀土元素的分布数据引自Wu等[43],位于菲律宾海中部,水深3 500 m,位置16°30’N、130°00’E,采样时间为2010年12月;4 500~5 000 m水深稀土元素为本实验室未发表数据,位置14°6’N、133°8’E)。这是因为在以氧化性为主的沉积环境孔隙水中,由于沉积物中的Mn氧化物、磷灰石等会捕获孔隙水中的稀土元素,使其重新被固定在沉积物固相中,最终表现出孔隙水中REE的浓度要低于底层海水[44]。但是在还原性沉积物中,其结果则截然相反,首先还原性沉积物中FeS的形成会减弱颗粒物吸附周围环境中稀土元素的能力,导致还原性孔隙水中的REE会呈现出相对底层海水富集的现象;其次,氧化环境中沉积物稀土会以氧化物形态吸附在Fe-Mn微粒,磷灰石等矿物里,而在还原环境中氧化物分解,从而导致孔隙水中REE相对富集[45-46]。
本研究中稀土元素的配分曲线主要以平坦型和轻微的重稀土富集型为主要特征(图3),这是两种普遍存在于孔隙水中的稀土配分模式。虽然前期的研究结果认为平坦型(Linear),重稀土富集型(HREE enriched)和中稀土富集型(MREE bulge)是孔隙水中常见的3种配分模式[25],但是Haley等通过对陆架沉积物孔隙水中REE的分布研究发现[25],当孔隙水中Fe元素富集时,才会呈现出明显的中稀土富集的模式。然而本研究两根样品柱中Mn的分布有明显不同(图2K),但两个站位均未测得Fe,由此可见,虽然Mn氧化物和Fe氧化物常被视为“混合氧化物”用于分析吸附解吸过程,但是在研究Fe-Mn氧化物与微量元素之间的相互作用过程中,有必要对Fe氧化物和Mn氧化物进行明确的区分。
3.2 孔隙水中稀土元素的迁移和分馏
本文分别通过Nd/Yb、Nd/Sm、Sm/Yb比值来表示轻、中、重稀土的分异程度。两个CTD站位底层海水中Nd/Yb、Nd/Sm、Sm/Yb值分别为0.24(0.25)、0.84(0.75)、0.29(0.34)(括号中数据代表4 500~5 000 m未发表数据),呈现出明显的重稀土富集的特征(图3)。在0~2.5 cm海水-沉积物界面中,孔隙水中Nd/Yb和Sm/Yb值在XTZZ40和XTZZb4两个站位中分别为0.83和0.49以及0.90和0.49,均明显高于底层海水,并且两个站位中Nd/Sm值(0.92和0.98)也略高于底层海水,这说明在表层沉积物孔隙水中的轻稀土和中稀土的含量呈现出了明显的增加(图4),这种现象普遍存在于太平洋其他区域的孔隙水中[13,34]。轻稀土和中稀土是相对于重稀土活性更强的稀土元素[25,45],当沉积物中有机质降解时,轻稀土和中稀土元素会优先于重稀土被释放从而迁移到孔隙水中[24-25],从而导致海水-沉积物界面孔隙水中的轻稀土和中稀土含量的相对增加。
![]() 图 4 海水和孔隙水中稀土元素的分异特征Figure 4. Differentiation characteristics of rare earth elements in seawater and pore-water
图 4 海水和孔隙水中稀土元素的分异特征Figure 4. Differentiation characteristics of rare earth elements in seawater and pore-water在2.5~20 cm的沉积物孔隙水中,Nd/Yb和Sm/Yb在XTZZ40(0.95和1.09)站位中的比值约为XTZZb4(0.57和0.66)站位的1.7倍,Nd/Sm值基本一致,分别为0.86和0.89,表明在20 cm以浅的沉积物孔隙水中XTZZ40站位比XTZZb4富集了含量更高的轻稀土元素,同时,本研究发现XTZZb4站位孔隙水中总稀土含量略高于XTZZ40(图2F),并且XTZZb4站位孔隙水中更高的HREE/LREE的比值意味着重稀土的富集度更高(图2E),这也从一定程度上反应出在XTZZb4站位有机物的降解程度可能低于XTZZ40站位。
随着深度的增加(25~60 cm),XTZZ40和XTZZb4站位孔隙水中Nd/Yb(0.55和0.54)和Sm/Yb(0.72和0.64)值相对于浅层明显减小,表明孔隙水中的重稀土元素开始增加,此时稀土元素的分馏可能与吸附作用有关。沉积剖面向下,携带轻稀土的有机物或Mn氧化物在氧化环境中发生氧化分解或重结晶作用,减弱了轻稀土的分解[47-50],或许导致重稀土元素在深层沉积物中的浓度有所增加。另外,XTZZ40站位孔隙水中ΣREE的浓度明显高于XTZZb4站位(图2F),且Mn和Co、Ni、Cu在XTZZb4站位呈现出了明显的正相关关系(R2>0.7)(图5)。这可能是因为XTZZb4站位沉积物中Mn微粒不仅对上述微量元素进行了吸附[51-52],同时也吸附了孔隙水中的稀土元素,最终导致XTZZb4站位孔隙水中ΣREE的浓度偏低。另外,有研究表明在含有沸石和沸石质黏土的沉积物中REE的浓度明显偏高,这是因为钙氟磷灰石会从周围的环境中摄取REE元素固定在晶格中[20],本研究XTZZb4站位中Ca离子的含量是XTZZ40站位的1.2倍,这有可能是另一个引起两个站位总稀土浓度相差较大的因素。
![]() 图 5 孔隙水中Mn与金属元素的相关关系Figure 5. The relationship between Mn and trace metals in pore-water
图 5 孔隙水中Mn与金属元素的相关关系Figure 5. The relationship between Mn and trace metals in pore-water两个站位深层(65~100 cm)孔隙水中ΣREE的浓度基本一致,分别为116(XTZZ40)和119 pmol/kg(XTZZb4),均明显低于25~60 cm层。尤其是XTZZ40站位65 cm层孔隙水中ΣREE的浓度急剧降低,同时又伴随着Ce正异常的出现。海洋中的Ce异常是用于判定氧化还原环境的有效指标,在强氧化环境中孔隙水中的Ce3+会被氧化成Ce4+,被Mn氧化物吸附后沉淀于结核中,会呈现出Ce的正异常[44,53],但是海底热液和陆源碎屑的稀释作用也会对Ce/Ce*的值产生干扰,同时影响ΣREE的含量。
XTZZ40站位孔隙水中稀土的富集程度(MREE/MREE*)随深度有明显的增加(1.3~2.0)(图2D),或许是受到磷酸盐的影响,因为磷酸盐可以通过吸附和晶格置换作用形成中稀土相对富集的现象[24-25,54],我们会在后续的工作中对其进行深入的探讨和研究。另外,XTZZb4站位随着深度的增加持续降低的ΣREE的含量、Nd/Yb(0.51)和Sm/Yb(0.51)比值,意味着该站位深层孔隙水中稀土元素的分馏继续受到吸附作用的影响。
总体上来说,本研究中孔隙水中稀土元素的迁移和分馏主要受到了锰(氢)氧化物的吸附和分解,Ca离子浓度和沉积环境等综合因素的影响。由于浅层有机物和锰氧化物的分解,使得底层水与沉积物界面以及浅层孔隙水(2.5~20 cm)中相对富集轻稀土和中稀土,而中、深层沉积物中的吸附作用最终导致重稀土元素的相对富集。
3.3 深海稀土元素的循环及指示意义
沉积物的氧化还原环境对于稀土元素的吸附解析过程有重要的影响,包括稀土元素的再分配过程,以及稀土元素在早期成岩过程中的吸附作用。菲律宾海沉积物孔隙水中的稀土元素含量要明显低于底层海水,且配分模式也与底层海水存在较大差异(图6)。虽然除河流、大气沉降、热液活动和地下水的输送外[17,20-22,24,28],孔隙流体也被认为是海水中稀土元素的主要来源之一[24]。但在不同海域,不同水深沉积物孔隙水中稀土元素的浓度有明显的不同,不仅存在数量级的变化(图7)[25,29,34,44],而且配分模式也有显著差异。Abbott等计算出每年由陆架海域孔隙水向海洋中释放钕(Nd)的通量为(18~110)×106 mol[29],另外,Chen等也计算出浅海和陆坡区域由孔隙水向海洋中贡献稀土元素的总量是河流的10倍[24],这些结果不仅证明了孔隙流体是海洋中稀土元素的一个重要来源,也为解释海洋中稀土元素的“源-汇”问题提供了重要的理论依据。但是,本研究并未发现孔隙水向海洋中输入大量的稀土元素。通过对上覆海水与海脊东、西两个站位孔隙水中轻、中、重稀土之间的比值研究,发现底层海水-沉积物界面(2.5 cm)以及25 cm以浅的沉积物孔隙水中轻、中稀土明显富集,而在中深层沉积物孔隙水(>25 cm)中则表现为中、重稀土的富集,在太平洋深海盆地也得出了相似的研究结果[34],说明孔隙流体作为海水中稀土元素的来源并不是普遍存在于所有海域,可能主要集中于浅海及大陆架区域。造成这种现象的原因可能是:①在浅海区域,沉积物的氧化带更浅,并且受到大量陆源有机物在氧化环境中分解作用的影响,向海洋中释放了更多的稀土元素[25,29];②沉积物Fe-Mn氧化物的吸附解吸过程使得稀土元素重新分配到孔隙水和海水中,尤其是在还原环境中,Fe-Mn氧化物会选择性的释放出MREE并进入沉积物孔隙水中并最终贡献到海洋[25,55-56]。
![]()
![]()
深海富稀土泥是指稀土含量大于400 μg/g的一类沉积物[20,57],其普遍存在于世界各大洋中,其中主要的分布区域在西北太平洋、东南太平洋、东印度洋深海盆地,大西洋深海盆地等[20,54,58-61]。目前认为富稀土沉积物的成因主要是受到沉积物中矿物组成[52,62]、沉积速率[20,58,62],Fe-Mn氧化物吸附解吸等过程的综合影响[1,25]。而孔隙水作为连接固相和液相之间的介质,在黏土矿物、有机物质以及铁锰氧化物所吸附的稀土元素的再分配过程中起到了至关重要的作用。虽然目前的研究认为海底存在的次氧化环境更有利于稀土元素从孔隙水中迁移到沉积物中[46],并且认可了孔隙水在早期成岩过程中的重要地位,但是在研究深海富稀土沉积物中稀土元素的来源和形成机制过程中,孔隙水的作用有待于进一步的探索。
4. 结论
(1)九州-帕劳海脊东、西两个站位孔隙水中的稀土元素浓度均明显低于底层海水,稀土元素的配分曲线主要以平坦型和轻微的重稀土富集型为主。
(2)海水-沉积物界面和浅层沉积物孔隙水中稀土元素的分馏主要受到了有机物和锰(氢)氧化物的分解作用的影响,中、深层沉积物孔隙水中稀土元素的分馏则受到了吸附作用的影响。
(3)海脊两侧沉积物均以氧化环境为主,其中元素含量、陆源物质输入和锰微粒是影响两个站位中稀土元素的浓度和分异程度的主要因素。
(4)对于不同的海域,孔隙水中的稀土元素浓度差异很大。研究区域海脊东、西两侧沉积物孔隙水中稀土配分模式与上覆海水有很大的区别,这意味着孔隙流体作为海洋中稀土元素的来源并不是普遍存在于所有海域。
致谢:感谢中国科学院海洋研究所在样品分析和测试过程中的帮助;感谢吴琼老师给予的数据支持;感谢“张謇号”科考船的全体工作人员在样品采集过程中给予的热心帮助。
-
![]()
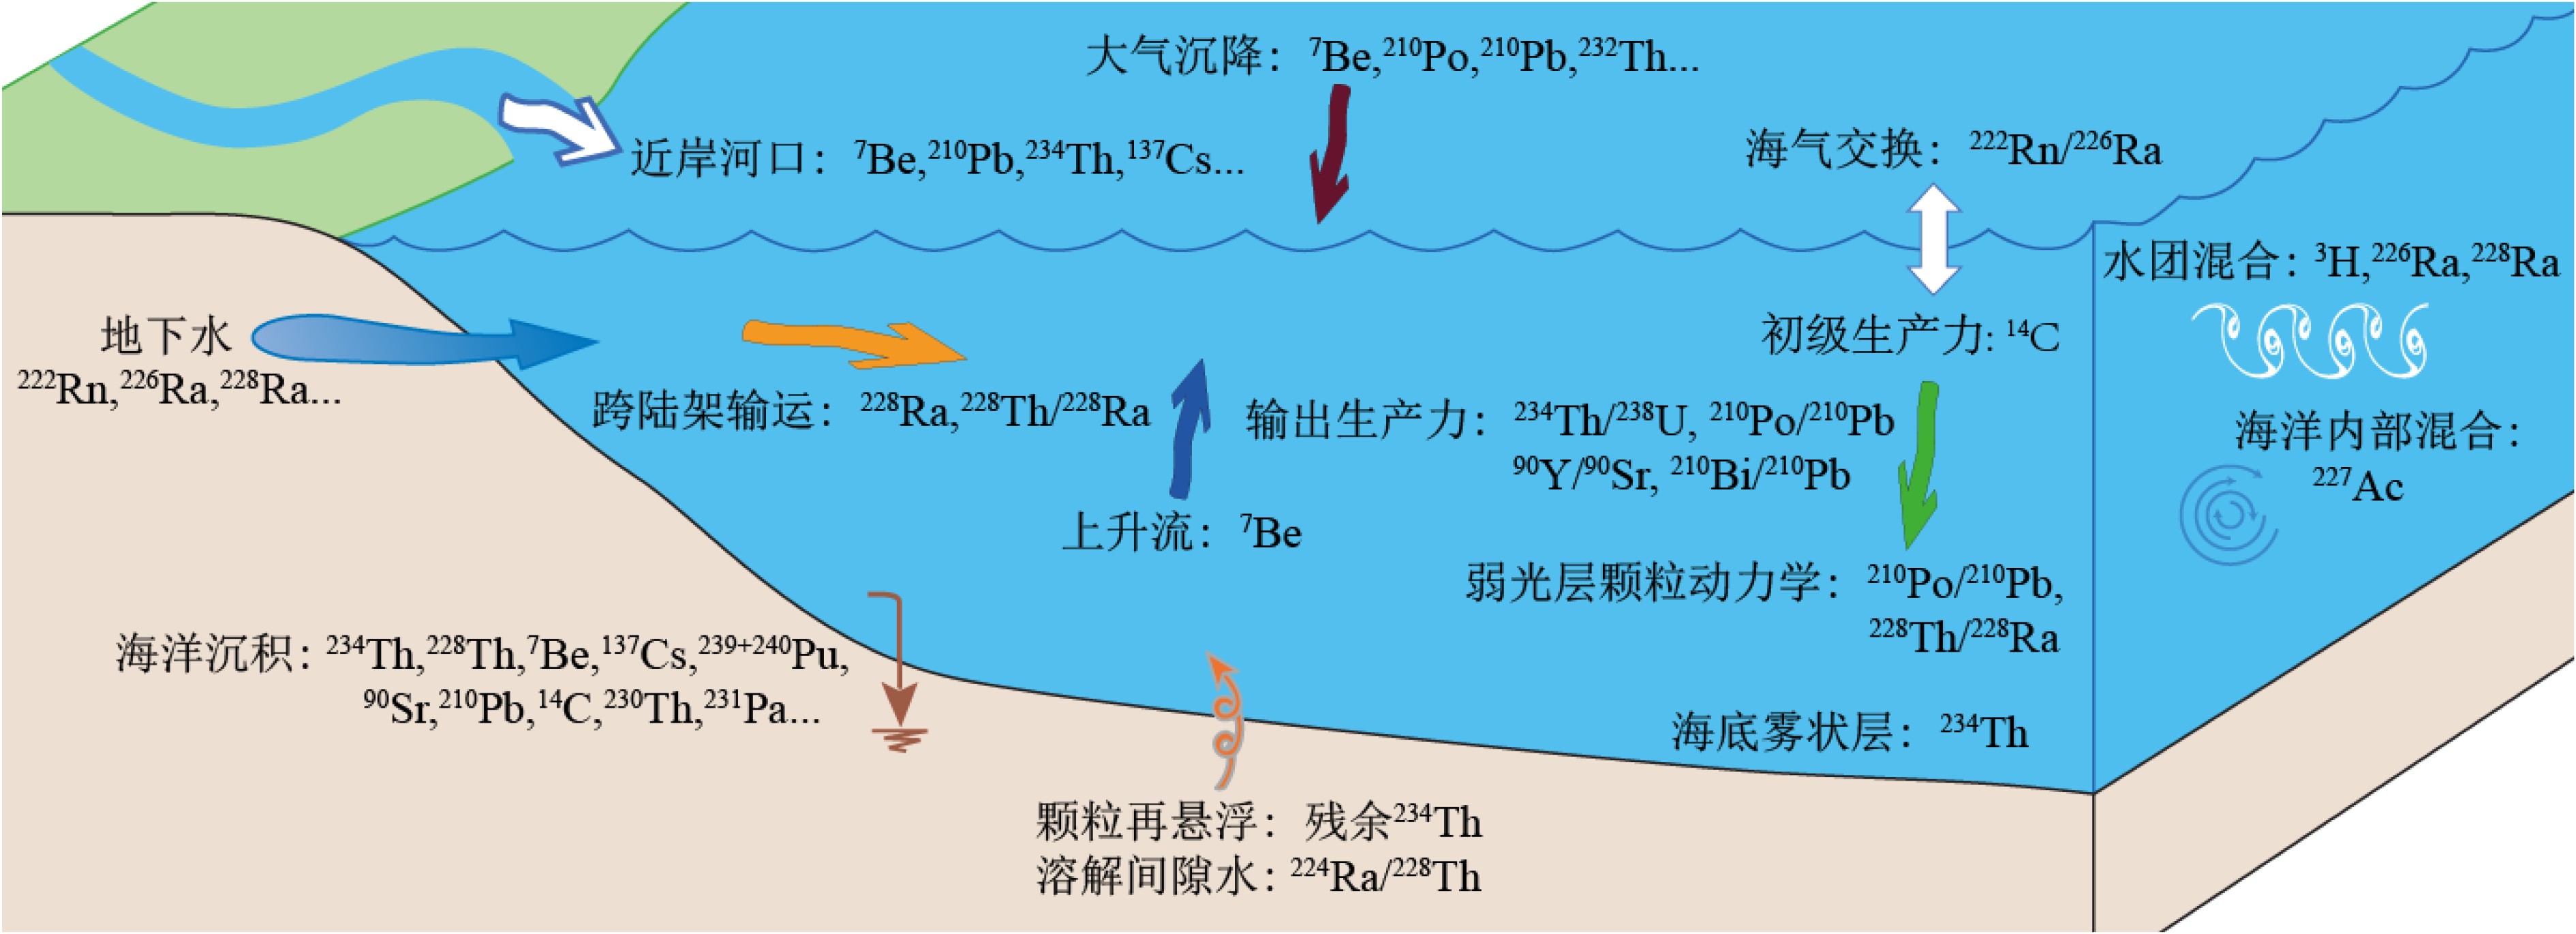
图 1 放射性核素示踪技术在海洋过程研究中的典型应用
Figure 1. Typical application of radionuclides to tracing marine processes
![]()
图 2 海洋沉积物采样站位分布和对应的沉积物中226Ra和238U活度
k值代表226Ra/238U的活度比值。绿色椭圆表示环礁的226Ra/238U活度比值(<0.1)。长方形代表岸礁的沉积物226Ra/238U活度比值。紫色椭圆代表其他海区的沉积物226Ra/238U的活度比值(0.5~1)。
Figure 2. Sampling station map of China for marine sediments and their associated 226Ra and 238U activities
k means activity ratio of 226Ra to 238U. The green ellipse indicates marine sediments from the atoll reefs with k values <0.1. The black rectangle shows marine sediments from the fringing reefs. The purple ellipse represents marine sediments excluding coral reefs with k values of 0.5~1.0.
![]()
图 3 广西涠洲岛珊瑚礁区沉积物柱状样的站位图与过剩210Pb活度自然对数计算后的垂直分布
Figure 3. Location map of the sediment core collected from the Weizhou Island, Guangxi Province and vertical profile of excess 210Pb activity with Napierian Logarithm transformation
![]()
图 4 北冰洋陆架区(a)、南海珠江口陆架区(b)、南大洋陆架区(c)不同站位的残余234Th(RAP234)剖面图
黄色椭圆形代表沉积物再悬浮过程引起RAP234异常高值。
Figure 4. Vertical profiles of RAP234 in Arctic Ocean (a), South China Sea (b), and Southern Ocean (c)
Abnormal high RAP234 activity is indicated by yellow ellipses.
![]()
图 5 北冰洋SR3站位的海水浊度与残余234Th剖面图对比
Figure 5. Vertical profies of seawater turbidity and RAP234 at station SR3 in the Arctic Ocean
-
[1] 林武辉. 高纬度边缘海海洋生物泵的多同位素示踪研究[D]. 清华大学博士学位论文, 2015: 126. LIN Wuhui. Marine biological carbon pumps and their tracing using multi-isotope in the high latitude marginal seas[D]. Doctor Dissertation of Tsinghua University, 2015: 126.
[2] 林武辉, 陈立奇, 余雯, 等. 白令海和楚科奇海陆架区的生源物质埋藏通量研究[J]. 极地研究, 2016, 28(2):194-202. [LIN Wuhui, CHEN Liqi, YU Wen, et al. Burial fluxes of biogenic materials in the Bering Sea and Chukchi Sea [J]. Chinese Journal of Polar Research, 2016, 28(2): 194-202. [3] Lin W H, Chen L Q, Zeng S, et al. Residual β activity of particulate 234Th as a novel proxy for tracking sediment resuspension in the ocean [J]. Scientific Reports, 2016, 6: 27069. doi: 10.1038/srep27069
[4] 黄奕普, 陈敏. 海洋同位素示踪技术研究进展[J]. 厦门大学学报: 自然科学版, 2001, 40(2):512-523. [HUANG Yipu, CHEN Min. Progress in the isotope tracer technique for marine science [J]. Journal of Xiamen University: Natural Science, 2001, 40(2): 512-523. [5] 毕倩倩, 杜金洲. 海洋环境中放射性分析及其应用[J]. 核化学与放射化学, 2015, 37(4):193-206. [BI Qianqian, DU Jinzhou. Radio-analysis and its application in the marine environment [J]. Journal of Nuclear and Radiochemistry, 2015, 37(4): 193-206. doi: 10.7538/hhx.2015.37.04.0193 [6] Hong G H, Hamilton T F, Baskaran M, et al. Applications of anthropogenic radionuclides as tracers to investigate marine environmental processes[M]//Baskaran M. Handbook of Environmental Isotope Geochemistry. Berlin, Heidelberg: Springer, 2012: 367-394.
[7] Rutgers Van Der Loeff M M. Uranium-Thorium decay series in the oceans overview[M]//Steele J H. Encyclopedia of Ocean Sciences. San Diego: Academic Press, 2001: 3135-3145.
[8] 刘广山. 同位素海洋学[M]. 郑州: 郑州大学出版社, 2010. LIU Guangshan. Isotopic Oceanography[M]. Zhengzhou: Zhengzhou University Press, 2010.
[9] Loose B, Kelly R P, Bigdeli A, et al. How well does wind speed predict air‐sea gas transfer in the sea ice zone? A synthesis of radon deficit profiles in the upper water column of the Arctic Ocean [J]. Journal of Geophysical Research: Oceans, 2017, 122(5): 3696-3714. doi: 10.1002/2016JC012460
[10] Hayes C T, Anderson R F, Fleisher M Q, et al. Quantifying lithogenic inputs to the North Pacific Ocean using the long-lived thorium isotopes [J]. Earth and Planetary Science Letters, 2013, 383: 16-25. doi: 10.1016/j.jpgl.2013.09.025
[11] Kadko D, Landing W M, Shelley R U. A novel tracer technique to quantify the atmospheric flux of trace elements to remote ocean regions [J]. Journal of Geophysical Research: Oceans, 2015, 120(2): 848-858. doi: 10.1002/2014JC010314
[12] Baskaran M. Po-210 and Pb-210 as atmospheric tracers and global atmospheric Pb-210 fallout: a review [J]. Journal of Environmental Radioactivity, 2011, 102(5): 500-513. doi: 10.1016/j.jenvrad.2010.10.007
[13] Du J, Du J Z, Baskaran M, et al. Temporal variations of atmospheric depositional fluxes of 7Be and 210Pb over 8?years (2006-2013) at Shanghai, China, and synthesis of global fallout data [J]. Journal of Geophysical Research: Atmospheres, 2015, 120(9): 4323-4339. doi: 10.1002/2014JD022807
[14] Regaudie-de-Gioux A, Lasternas S, Agustí S, et al. Comparing marine primary production estimates through different methods and development of conversion equations [J]. Frontiers in Marine Science, 2014, 1: 19.
[15] Yu W, He J, Li Y, et al. Particulate organic carbon export fluxes and validation of steady state model of 234Th export in the Chukchi Sea [J]. Deep Sea Research Part II: Topical Studies in Oceanography, 2012, 81-84: 63-71. doi: 10.1016/j.dsr2.2012.03.003
[16] He J H, Yu W, Lin W H, et al. Particulate organic carbon export fluxes on Chukchi Shelf, western Arctic Ocean, derived from 210Po/210Pb disequilibrium [J]. Chinese Journal of Oceanology and Limnology, 2015, 33(3): 741-747. doi: 10.1007/s00343-015-3357-x
[17] Lin W H, Ma H, Chen L Q, et al. Decay/ingrowth uncertainty correction of 210Po/210Pb in seawater [J]. Journal of Environmental Radioactivity, 2014, 137: 22-30. doi: 10.1016/j.jenvrad.2014.06.005
[18] Cai P H, Zhao D C, Wang L, et al. Role of particle stock and phytoplankton community structure in regulating particulate organic carbon export in a large marginal sea [J]. Journal of Geophysical Research: Oceans, 2015, 120(3): 2063-2095. doi: 10.1002/2014JC010432
[19] Kadko D, Johns W. Inferring upwelling rates in the equatorial Atlantic using 7Be measurements in the upper ocean [J]. Deep Sea Research Part I: Oceanographic Research Papers, 2011, 58(6): 647-657. doi: 10.1016/j.dsr.2011.03.004
[20] Geibert W, Rutgers Van Der Loeff M M, Hanfland C, et al. Actinium-227 as a deep-sea tracer: sources, distribution and applications [J]. Earth and Planetary Science Letters, 2002, 198(1-2): 147-165. doi: 10.1016/S0012-821X(02)00512-5
[21] Ma H Y, Yang W F, Zhang L H, et al. Utilizing 210Po deficit to constrain particle dynamics in mesopelagic water, western South China Sea [J]. Geochemistry, Geophysics, Geosystems, 2017, 18(4): 1594-1607. doi: 10.1002/2017GC006899
[22] Rutgers Van Der Loeff M, Meyer R, Rudels B, et al. Resuspension and particle transport in the benthic nepheloid layer in and near Fram Strait in relation to faunal abundances and 234Th depletion [J]. Deep Sea Research Part I: Oceanographic Research Papers, 2002, 49(11): 1941-1958. doi: 10.1016/S0967-0637(02)00113-9
[23] Cai P H, Shi X M, Moore W S, et al. 224Ra: 228Th disequilibrium in coastal sediments: Implications for solute transfer across the sediment–water interface [J]. Geochimica et Cosmochimica Acta, 2014, 125: 68-84. doi: 10.1016/j.gca.2013.09.029
[24] Du J Z, Zhang J, Baskaran M. Applications of short-lived radionuclides (7Be, 210Pb, 210Po, 137Cs and 234Th) to trace the sources, transport pathways and deposition of particles/sediments in rivers, estuaries and coasts[M]//Baskaran M. Handbook of Environmental Isotope Geochemistry. Berlin, Heidelberg: Springer, 2012: 305-329.
[25] Huang D K, Du J Z, Moore W S, et al. Particle dynamics of the Changjiang Estuary and adjacent coastal region determined by natural particle-reactive radionuclides (7Be, 210Pb, and 234Th) [J]. Journal of Geophysical Research: Oceans, 2013, 118(4): 1736-1748. doi: 10.1002/jgrc.20148
[26] Wang J L, Du J Z, Baskaran M, et al. Mobile mud dynamics in the East China Sea elucidated using 210Pb, 137Cs, 7Be, and 234Th as tracers [J]. Journal of Geophysical Research: Oceans, 2016, 121(1): 224-239. doi: 10.1002/2015JC011300
[27] Moore W S. The effect of submarine groundwater discharge on the ocean [J]. Annual Review of Marine Science, 2010, 2: 59-88. doi: 10.1146/annurev-marine-120308-081019
[28] Wang G Z, Wang Z Y, Zhai W D, et al. Net subterranean estuarine export fluxes of dissolved inorganic C, N, P, Si, and total alkalinity into the Jiulong River estuary, China [J]. Geochimica et Cosmochimica Acta, 2015, 149: 103-114. doi: 10.1016/j.gca.2014.11.001
[29] Rutgers Van Der Loeff M, Cai P, Stimac I, et al. Shelf-basin exchange times of Arctic surface waters estimated from 228Th/228Ra disequilibrium [J]. Journal of Geophysical Research: Oceans, 2012, 117(C3): C03024.
[30] Charette M A, Breier C F, Henderson P B, et al. Radium-based estimates of cesium isotope transport and total direct ocean discharges from the Fukushima Nuclear Power Plant accident [J]. Biogeosciences, 2013, 10(3): 2159-2167. doi: 10.5194/bg-10-2159-2013
[31] Charette M A, Morris P J, Henderson P B, et al. Radium isotope distributions during the US GEOTRACES North Atlantic cruises [J]. Marine Chemistry, 2015, 177: 184-195. doi: 10.1016/j.marchem.2015.01.001
[32] 杨守业. 一沙一世界——藏于海底的地球环境变迁史[J]. 自然杂志, 2017, 39(5):313-319. [YANG Shouye. To see a world in a grain of sand: Environment changes recorded in global seafloor [J]. Chinese Journal of Nature, 2017, 39(5): 313-319. doi: 10.3969/j.issn.0253-9608.2017.05.001 [33] Burdige D J. Geochemistry of Marine Sediments[M]. Princeton: Princeton University Press, 2006.
[34] Liu Z F, Zhao Y L, Colin C, et al. Source-to-Sink transport processes of fluvial sediments in the South China Sea [J]. Earth-Science Reviews, 2016, 153: 238-273. doi: 10.1016/j.earscirev.2015.08.005
[35] Qiao S Q, Shi X F, Wang G Q, et al. Sediment accumulation and budget in the Bohai Sea, Yellow Sea and East China Sea [J]. Marine Geology, 2017, 390: 270-281. doi: 10.1016/j.margeo.2017.06.004
[36] 林武辉, 余克服, 王英辉, 等. 罕见的地表低辐射水平区域: 珊瑚礁区[J]. 辐射防护, 2018, 38(4):287-292. [LIN Wuhui, YU Kefu, WANG Yinghui, et al. Unusual low radiation area on the surface of the earth: coral reefs [J]. Radiation Protection, 2018, 38(4): 287-292. [37] 林武辉, 余克服, 王英辉, 等. 珊瑚礁区沉积物的极低放射性水平特征与成因[J]. 科学通报, 2018, 63(21):2173-2183. [LIN Wuhui, YU Kefu, WANG Yinghui, et al. Extremely low radioactivity in marine sediment of coral reefs and its mechanism [J]. Chinese Science Bulletin, 2018, 63(21): 2173-2183. [38] Liu X M, Lin W H. Natural radioactivity in the beach sand and soil along the coastline of Guangxi Province, China [J]. Marine Pollution Bulletin, 2018, 135: 446-450. doi: 10.1016/j.marpolbul.2018.07.057
[39] 毛远意, 林静, 黄德坤, 等. 北部湾白龙半岛邻近海域沉积物中放射性核素含量水平[J]. 应用海洋学学报, 2018, 37(2):194-202. [MAO Yuanyi, LIN Jing, HUANG Dekun, et al. Radionuclides in the surface sediments along the coast of Bailong Peninsula in Beibu Gulf [J]. Journal of Applied Oceanography, 2018, 37(2): 194-202. doi: 10.3969/J.ISSN.2095-4972.2018.02.006 [40] 杜金秋, 关道明, 姚子伟, 等. 大连近海沉积物中放射性核素分布及环境指示[J]. 中国环境科学, 2017, 37(5):1889-1895. [DU Jinqiu, GUAN Daoming, YAO Ziwei, et al. Distribution and environmental significances of radionuclides in sediments of Dalian coastal area [J]. China Environmental Science, 2017, 37(5): 1889-1895. doi: 10.3969/j.issn.1000-6923.2017.05.036 [41] Sanchez-Cabeza J A, Ruiz-Fernández A C. 210Pb sediment radiochronology: An integrated formulation and classification of dating models [J]. Geochimica et Cosmochimica Acta, 2012, 82: 183-200. doi: 10.1016/j.gca.2010.12.024
[42] Aller R C, Cochran J K. 234Th/238U disequilibrium in near-shore sediment: particle reworking and diagenetic time scales [J]. Earth and Planetary Science Letters, 1976, 29(1): 37-50. doi: 10.1016/0012-821X(76)90024-8
[43] Corbett D R, Mckee B, Duncan D. An evaluation of mobile mud dynamics in the Mississippi River deltaic region [J]. Marine Geology, 2004, 209(1-4): 91-112. doi: 10.1016/j.margeo.2004.05.028
[44] Moberg F, Folke C. Ecological goods and services of coral reef ecosystems [J]. Ecological Economics, 1999, 29(2): 215-233. doi: 10.1016/S0921-8009(99)00009-9
[45] Hughes T P, Barnes M L, Bellwood D R, et al. Coral reefs in the Anthropocene [J]. Nature, 2017, 546(7656): 82-90. doi: 10.1038/nature22901
[46] McCulloch M, Fallon S, Wyndham T, et al. Coral record of increased sediment flux to the inner Great Barrier Reef since European settlement [J]. Nature, 2003, 421(6924): 727-730. doi: 10.1038/nature01361
[47] Jones R, Bessell-Browne P, Fisher R, et al. Assessing the impacts of sediments from dredging on corals [J]. Marine Pollution Bulletin, 2016, 102(1): 9-29. doi: 10.1016/j.marpolbul.2015.10.049
[48] Wang J L, Du J Z, Bi Q Q. Natural radioactivity assessment of surface sediments in the Yangtze Estuary [J]. Marine Pollution Bulletin, 2017, 114(1): 602-608. doi: 10.1016/j.marpolbul.2016.09.040
[49] Huang D K, Du J Z, Deng B, et al. Distribution patterns of particle-reactive radionuclides in sediments off eastern Hainan Island, China: implications for source and transport pathways [J]. Continental Shelf Research, 2013, 57: 10-17. doi: 10.1016/j.csr.2012.04.019
[50] Wang Q D, Song J M, Li X G, et al. Environmental radionuclides in a coastal wetland of the Southern Laizhou Bay, China [J]. Marine Pollution Bulletin, 2015, 97(1-2): 506-511. doi: 10.1016/j.marpolbul.2015.05.035
[51] Zhou P, Li D M, Li H T, et al. Distribution of radionuclides in a marine sediment core off the waterspout of the nuclear power plants in Daya Bay, northeastern South China Sea [J]. Journal of Environmental Radioactivity, 2015, 145: 102-112. doi: 10.1016/j.jenvrad.2015.03.018
[52] Yu K N, Guan Z J, Stokes M J, et al. Natural and artificial radionuclides in seabed sediments of Hong Kong [J]. The International Journal of Radiation Applications and Instrumentation. Part E: Nuclear Geophysics, 1994, 8(1): 45-48.
[53] 赵峰, 吴梅桂, 周鹏, 等. 黄茅海—广海湾及其邻近海域表层沉积物中γ放射性核素含量水平[J]. 热带海洋学报, 2015, 34(4):77-82. [ZHAO Feng, WU Meigui, ZHOU Peng, et al. Radionuclides in surface sediments from the Huangmaohai Estuary-Guanghai Bay and its adjacent sea area of the South China Sea [J]. Journal of Tropical Oceanography, 2015, 34(4): 77-82. doi: 10.3969/j.issn.1009-5470.2015.04.011 [54] 林武辉, 陈立奇, 马豪, 等. 日本福岛核事故后的海洋放射性监测进展[J]. 中国环境科学, 2015, 35(1):269-276. [LIN Wuhui, CHEN Liqi, MA Hao, et al. Review on monitoring marine radioactivity since the Fukushima Nuclear Accident [J]. China Environmental Science, 2015, 35(1): 269-276. [55] Baskaran M. Dating of biogenic and inorganic carbonates using 210Pb-226Ra disequilibrium method: a review[M]//Baskaran M. Handbook of Environmental Isotope Geochemistry. Berlin, Heidelberg: Springer, 2012: 789-809.
[56] Saha N, Webb G E, Zhao J X. Coral skeletal geochemistry as a monitor of inshore water quality [J]. Science of the Total Environment, 2016, 566-567: 652-684. doi: 10.1016/j.scitotenv.2016.05.066
[57] Hart D E, Kench P S. Carbonate production of an emergent reef platform, Warraber Island, Torres Strait, Australia [J]. Coral Reefs, 2007, 26(1): 53-68. doi: 10.1007/s00338-006-0168-8
[58] Łącka M, Pawłowska J, Zajączkowski M. New methods in the reconstruction of Arctic marine palaeoenvironments[M]//Zielinski T, Weslawski M, Kuliński K. Impact of Climate Changes on Marine Environments. Cham: Springer, 2015: 127-148.
[59] Oguri K, Harada N, Tadai O. Excess 210Pb and 137Cs concentrations, mass accumulation rates, and sedimentary processes on the Bering Sea continental shelf [J]. Deep Sea Research Part II: Topical Studies in Oceanography, 2012, 61-64: 193-204. doi: 10.1016/j.dsr2.2011.03.007
[60] Kuzyk Z Z A, Gobeil C, Macdonald R W. 210Pb and 137Cs in margin sediments of the Arctic Ocean: controls on boundary scavenging [J]. Global Biogeochemical Cycles, 2013, 27(2): 422-439. doi: 10.1002/gbc.20041
[61] 曾文义, 程汉良, 曾宪章, 等. 厦门港的淤积现状及防淤建议[J]. 海洋通报, 1991, 10(1):45-49. [ZENG Wenyi, CHENG Hanliang, ZENG Xianzhang, et al. Situation of modern sedimentation and propositions of preventing siltation in Xiamen Harbour [J]. Marine Science Bulletin, 1991, 10(1): 45-49. [62] 刘广山. 210Pb过剩法与中国海的现代沉积物测年[M]//刘广山. 海洋放射年代学. 厦门: 厦门大学出版社, 2016: 106-136. LIU Guangshan. 210Pb excess method and modern sediment dating in the China Sea[M]//LIU Guangshan. Marine Radiological Chronology. Xiamen: Xiamen University Press, 2016: 106-136.]
[63] 潘少明, 王雪瑜, SMITH J N. 海南岛洋浦港现代沉积速率[J]. 沉积学报, 1994, 12(2):86-93. [PAN Shaoming, WANG Xueyu, SMITH J N. Recent sedimentation rates in Yangpu Harbour on Hainan Island [J]. Acta Sedimentologica Sinica, 1994, 12(2): 86-93. [64] 潘少明, 施晓东, SMITH J N. 海南岛三亚港现代沉积速率的研究[J]. 海洋与湖沼, 1995, 26(2):132-137. [PAN Shaoming, SHI Xiaodong, SMITH J N. Determination of recent sedimentation rates in Sanya Harbour, Hainan Island [J]. Oceanologia et Limnologia Sinica, 1995, 26(2): 132-137. doi: 10.3321/j.issn:0029-814X.1995.02.003 [65] 刘志勇, 潘少明, 程功弼, 等. 珠江口沉积物210Pb分布特征及环境意义[J]. 沉积学报, 2010, 28(1):166-175. [LIU Zhiyong, PAN Shaoming, CHENG Gongbi, et al. 210Pb characteristic in the sediment cores from the Pearl River Mouth and its environmental implication [J]. Acta Sedimentologica Sinica, 2010, 28(1): 166-175. [66] Li P Y, Wang Y H, Huang W Y, et al. Sixty-Year sedimentary record of DDTs, HCHs, CHLs and Endosulfan from emerging development gulfs: a case study in the Beibu Gulf, South China Sea [J]. Bulletin of Environmental Contamination and Toxicology, 2014, 92(1): 23-29. doi: 10.1007/s00128-013-1130-4
[67] McCave I N. Local and global aspects of the bottom nepheloid layers in the world ocean [J]. Netherlands Journal of Sea Research, 1986, 20(2-3): 167-181. doi: 10.1016/0077-7579(86)90040-2
[68] Boudreau B P. A one-dimensional model for bed-boundary layer particle exchange [J]. Journal of Marine Systems, 1997, 11(3-4): 279-303. doi: 10.1016/S0924-7963(96)00127-3
[69] Middag R, Van Hulten M M P, Van Aken H M, et al. Dissolved aluminium in the ocean conveyor of the West Atlantic Ocean: effects of the biological cycle, scavenging, sediment resuspension and hydrography [J]. Marine Chemistry, 2015, 177: 69-86. doi: 10.1016/j.marchem.2015.02.015
[70] Hall I R, Schmidt S, McCave I N, et al. Particulate matter distribution and 234Th/238U disequilibrium along the Northern Iberian Margin: implications for particulate organic carbon export [J]. Deep Sea Research Part I: Oceanographic Research Papers, 2000, 47(4): 557-582. doi: 10.1016/S0967-0637(99)00065-5
[71] Rutgers Van Der Loeff M M, Boudreau B P. The effect of resuspension on chemical exchanges at the sediment-water interface in the deep sea — A modelling and natural radiotracer approach [J]. Journal of Marine Systems, 1997, 11(3-4): 305-342. doi: 10.1016/S0924-7963(96)00128-5
[72] Turley C. Bacteria in the cold deep-sea benthic boundary layer and sediment-water interface of the NE Atlantic [J]. FEMS Microbiology Ecology, 2000, 33(2): 89-99.
[73] 汪卫国, 方建勇, 陈莉莉, 等. 楚科奇海悬浮体含量分布及其颗粒组分特征[J]. 极地研究, 2014, 26(1):79-88. [WANG Weiguo, FANG Jianyong, CHEN Lili, et al. The distribution and composition of suspended particles in the Chukchi Sea [J]. Chinese Journal of Polar Research, 2014, 26(1): 79-88. [74] Woodgate R A, Aagaard K, Weingartner T J. A year in the physical oceanography of the Chukchi Sea: Moored measurements from autumn 1990-1991 [J]. Deep Sea Research Part II: Topical Studies in Oceanography, 2005, 52(24-26): 3116-3149. doi: 10.1016/j.dsr2.2005.10.016
[75] White W M. Geochemistry[M]. Chichester, West Sussex Hoboken: John Wiley & Sons, 2013.

 下载:
下载:


计量
- 文章访问数: 3386
- HTML全文浏览量: 773
- PDF下载量: 85