The geochemical characteristics of the surface sediments in the New Britain Trench of the Western Pacific Ocean and their implications for provenance
-
摘要: 海沟通常拥有全球最深的区域——深渊,由于地理位置、地形地貌和气候等差异,海沟沉积物可能有不同的物质来源。因此,为进一步了解海沟深渊区的物质组成与来源,选取近陆的新不列颠海沟作为研究对象,通过分析其海底表层沉积物的地球化学特征,追踪新不列颠海沟不同水深与区域的沉积物来源。研究发现不论位于半深海、深海,乃至深渊区域,新不列颠“八字型”海沟的表层沉积物主要来自于周边岛屿的火山物质,但“八字型”海沟的西支和东支有差异,西支主要为新不列颠岛东部Rabaul火山和北部火山群及所罗门群岛的火山物质,其中在西支的最北站位新不列颠岛北部火山物质的比例最高。与西支相比,东支还受到了更多来源于TLTF(Tabar、Lihir、Tanga和Feni火山)火山链物质的影响,海沟东西支物源的差异与该地区复杂的洋流密切相关。此外,西支海沟轴部(最底端)站位更多来源于岛屿河流沉积物,受火山物质影响相对较小。Abstract: Most of the world trenches belongs to the hadal zone, the deepest part of the earth. The sources of sediments in the trenches are always different due to the difference in geographic location, topography, climate and others. In order to further understand the composition and sources of sediments in hadal trenches, the New British Trench, which is close to land, is chosen as the research object of this paper. By analyzing the geochemical characteristics of the bottom sediments of the trench, we studied the sources of sediments in different depths and regions of the trench. It is found that the bottom sediments of the New Britain Trench shaped like a reversed V are mainly derived from the surrounding volcanogenic materials, no matter they are located in the bathyal zone, abyssal zone, or even hadal zone. However, the materials in the western part of the reversed V shaped trench are rather different from those in its east. The western part of the New British Trench is mainly affected by volcanogenic materials from the Rabaul Volcano in the east of the New Britain Island, the northern part volcanoes of the New Britain Island, and the Solomon Islands, and the proportion of volcanogenic materials is the highest in the northeast stations from the northern part volcanoes of the New Britain Island. Compared to the western part, the eastern part of the New British Trench is more strongly affected by the TLTF volcanic chain (volcanoes Tabar-Lihir-Tanga-Feni). It is believed that the different sources of the New British Trench are related to the complex ocean currents between the western part and the eastern part of the trench. Furthermore, the bottom (the deepest) of the western part of the trench is dominated by river sediments but less influenced by volcanogenic materials.
-
Keywords:
- New Britain Trench /
- major elements /
- trace elements /
- rare earth elements /
- sediment provenances
-
铁是地壳中丰度第四高的元素,也是海洋中重要的生源要素,可以通过影响海洋初级生产力来改变气候,因此,低温铁和碳的生物地球化学循环及其环境效应是当前全球变化研究的热点。海洋沉积物中Fe的不同化学相态具有不同的生物地球化学循环特征和环境效应,因此,其化学相态分析有助于更好地了解铁循环、早期成岩作用、古氧化还原条件和古气候变化[1-4]。铁的化学相态分析主要经历了三步提取法和七步提取法的发展,如Canfield[5]早期采用三步提取法获得高活性Fe(FeHR)、弱活性Fe(FePR)以及不活性Fe(FeU),研究海洋沉积物中Fe的反应性对孔隙水化学性质的影响;在此基础上,Poulton和Canfield[6]针对海洋沉积物提出了一套更为综合的活性铁七步化学相态分析流程,将高活性Fe组分的提取分成了5步,涵盖了碳酸盐结合态铁和磁铁矿的分析。近十几年,铁的化学相态分析在物源示踪、沉积相氧化还原环境识别、全球颗粒态铁循环、海洋沉积有机碳保存等表生地球化学研究中得到了广泛的应用[2,7-10],特别是高活性Fe的化学反应性和生物可利用性较高,与地表环境和生物地球化学过程结合紧密[10-11],也是本研究关注的重点。
河流输入是大洋中铁的重要来源之一,而河口-陆架区域铁的地球化学过程将直接影响海洋铁的储库和循环、海洋初级生产力。长江是世界上径流量和输沙量最大的河流之一,也是陆源物质向东海陆架和邻近海域输入的主要河流之一。长江口-东海陆架铁的化学相态研究发现,表层沉积物FeT和FeHR含量的变化与陆源含铁铝硅酸盐矿物密切相关,表现在黏土矿物对其有较强的控制作用[[12-13];在河流输入占主导且存在强烈人类活动影响的大陆边缘,颗粒态Fe向陆架的输送过程及机制复杂,涉及物源、沉积环境、河口絮凝/聚集及化学风化作用等[12-14]。因此,河流细粒沉积物可能更富含Fe(或FeHR),而细粒沉积物(如黏土)中Fe的化学相态变化特征及其从河口到陆架的输送过程和控制因素,仍需进一步研究。
本研究以长江口-东海陆架表层沉积物为研究对象,采用6步提取法分析全样及其黏土组分中Fe的化学相态,结合水文参数、粒度、有机碳和铝含量等探讨沉积物中高活性Fe组成的主要控制因素,揭示黏土组分中高活性Fe的富集效应,并分析河口动力环境、沉积物来源、氧化还原条件对黏土组分中高活性Fe分布的影响机制。本研究结果是对长江口-东海陆架黏土组分Fe相态数据的补充,对深入理解河口-陆架颗粒态Fe的地球化学行为及其源汇过程有重要参考价值。
1. 区域概况与样品采集
长江入海泥沙为东海陆架与邻近海域沉积物的主要来源。长江口是世界超大河口之一,口内为非正规浅海半日潮,口外为正规半日潮,属于中等强度的潮汐河口[15-16]。长江口外水流复杂,沿岸受到台湾暖流、闽浙沿岸流和苏北沿岸流等多股水团影响[17]。根据水体的盐度分布,可以将长江口水体从口内向口外划分为长江径流水(盐度<1‰)、长江河口水(盐度1‰~5‰)、长江冲淡水(盐度5‰~31‰)和外海水(盐度>31‰)。
样品采集依托于同济大学海洋地质国家重点实验室于2020年8月22—30日期间组织的“关键元素及同位素在河口—陆架多界面过程的循环”(KECES-2020)航次。调查区域位于长江口外30°~32°N、121°~125°E,水深范围6~58 m。本研究聚焦于长江口南支-南港-南槽的C断面(图1),共计17个站位的表层沉积物样品(包括C1至C3、C5至C6、C6-1、C7至C16、C18站位)。表层沉积物样品采用不锈钢抓斗取样器采集,存放于干净的聚乙烯自封袋中,并于−20℃冰箱中进行冷冻保存。每个观测站位均使用CTD剖面仪(SBE 911 plus, Seabird,USA)进行现场测定,以获取盐度、温度和水深等数据。溶解氧(DO)、pH值等数据由“KECES-2020”共享航次提供。
![]() 图 1 长江口-东海陆架表层沉积物采样站位图(C断面)Figure 1. Sampling locations of surface sediments in the Changjiang River estuary and East China Sea along the C transect
图 1 长江口-东海陆架表层沉积物采样站位图(C断面)Figure 1. Sampling locations of surface sediments in the Changjiang River estuary and East China Sea along the C transect2. 分析方法
本研究样品为C断面表层沉积物全样及其黏土组分。黏土组分(<2 μm)提取方法如下:首先,根据全样样品的砂泥比例,称取全样样品约3~6 g(C1和C3站位约60 g),放置于2 L玻璃烧杯中,加入200 mL去离子水,经过63 μm筛分,将<63 μm组分收集于另一洁净玻璃烧杯中,经过多次离心和去除上层清液的步骤,将悬浮液收集于100 mL离心管中。随后向离心管中加入去离子水至100 mL,充分搅拌,超声20 min,静置4 h。根据斯托克斯(Stocks)沉降定理,采用沉降虹吸分离法提取上层5 cm水层的悬浮液。剩余样品重复上述步骤,直至静置4 h后上层液清澈。提取的上层悬浮液置于50 mL离心管中,经多次离心后倒掉上层清水,最后进行40℃烘干待用。
采用Poulton和Canfield[6]提出的顺序提取法对上述全样和黏土组分样品进行Fe的化学相态分析。该方法将沉积物中的Fe分为6个相态:碳酸盐结合态铁(Fecarb)、易还原态铁氧化物(Feox1)、可还原态铁氧化物(Feox2)、磁铁矿(Femag)、弱活性铁(FePR)以及不活性铁(FeU),其中Fecarb、Feox1、Feox2和Femag的总和称为高活性铁(FeHR)。实验流程如图2所示。总体而言,实验步骤包括首先从冷库中取出样品,进行解冻、均质化后烘干,然后准确称取约100 mg样品置于50 mL离心管中进行顺序提取。每次提取加入10 mL实验试剂,待反应完成后,离心(
4500 转)10 min并过滤(0.22 μm),收集上清液。在进行下一步提取实验之前,用超纯水清洗前一步的残留沉积物3遍,离心过滤收集第一遍清洗液,将所有收集的上清液蒸干换介质后,用2% 的HNO3稀释到适当浓度,待测。采用HF-HNO3混合酸高温高压消解最终残渣态(即不活性铁,FeU)和另一份相对应站位的全样样品(验证流程回收率)。消解操作如下:将适量残渣态和全样样品烘干研磨至200目以下,在马弗炉中600℃灼烧2 h, 去除有机质,计算烧失率(loss on ignition,LOI)。称取约50 mg样品至Teflon消解罐中, 加入1 mL 浓HNO3和1 mL HF混合酸,置于烘箱中195℃加热48 h, 冷却蒸干后加入1 mL 浓HNO3再次蒸干,随后加入2 mL 30%的 HNO3,再次放入烘箱中195℃加热12 h。待冷却后将消解完毕的溶液转移至PFA溶样罐中,取一定量溶液并加入2%的 HNO3稀释至适当浓度,最后运用ICP-OES(IRIS Advantage)测试所有样品的主量元素含量,包括Fe和Al元素含量,总铁(FeT)= Fecarb+ Feox1+ Feox2+ Femag+ FePR+FeU。![]()
实验过程中使用的HNO3、HF和HCl均为优级纯酸经过二次蒸馏所得, 实验试剂除柠檬酸钠为优级纯外,其余均为分析纯,实验用水均为Milli-Q超纯水。Fe相态分析过程中,对C13站位全样和黏土样品分别进行重复样分析,测试相对误差在5%左右。测试过程中选用玄武岩标样BHVO-2、JB-1b、JB-3,安山岩标样JA-1、JA-2、JA-3,以及水系沉积物标样GSD-9作为标准样品,仪器测试精度在5%左右。本研究中所有样品前处理与测试均在同济大学海洋地质国家重点实验室完成。此外,表层沉积物的总有机碳(TOC)和粒度数据(包括平均粒径、黏土<2 μm含量)来自Liang等[18]的研究。
3. 结果
3.1 底层水和表层沉积物的物理化学性质
受长江淡水和海水混合的强烈影响,研究区C断面底层水体的物理化学性质(包括盐度、温度、DO、pH)呈现较大变化(图3a、b)。根据盐度和温度的变化,将采样站位划分为3个主要区域:低盐度区域(站位C1至C6,受长江径流水控制,盐度<1‰,温度>29℃)、中盐度区域(站位C6-1至C13,受长江冲淡水控制,盐度5‰~31‰,温度23~29℃),以及高盐度区域(站位C14至C18,受外海水控制,盐度>31‰,温度低至20℃)。底层水体的DO变化范围为1.83~6.55 mg/L,平均为4.71±1.35 mg/L,从C1至C18站位逐渐降低。值得注意的是,C13站位的DO仅为1.83 mg/L,表明该站位处于夏季缺氧区内。此外,底层水体的pH值变化范围为7.84~8.10,沿断面波动变化较大,C6-1和C13站位的pH值均达到最低值7.84。
![]() 图 3 底层水体物理化学性质(a、b)、表层沉积物的粒径组成和平均粒径(c)以及烧失量(LOI)和总有机碳(TOC)含量(d)的空间变化Figure 3. Spatial variations of bottom water physicochemical properties (a-b), grain size composition and mean grain size (c), and LOI and TOC content (d) of the surface sediments
图 3 底层水体物理化学性质(a、b)、表层沉积物的粒径组成和平均粒径(c)以及烧失量(LOI)和总有机碳(TOC)含量(d)的空间变化Figure 3. Spatial variations of bottom water physicochemical properties (a-b), grain size composition and mean grain size (c), and LOI and TOC content (d) of the surface sediments与底层水体理化性质的变化相对应,表层沉积物的粒径、烧失量(LOI)和总有机碳(TOC)含量的空间分布也存在较大差异(图3c、d)。河口低盐度区域,沉积物以砂质为主,平均粒径为203±18.4 μm;在中盐度区域,沉积物以粉砂为主,但黏土含量也较高,平均粒径为23.0±7.99 μm;在高盐度区域,沉积物以砂质为主,平均粒径为207±20.9 μm。总体而言,LOI和TOC几乎都呈现“倒U型”分布,而平均粒径则呈“U型”分布,这与有机质倾向于富集在细粒组分中的特征相一致[19-20]。值得注意的是,黏土组分的LOI在空间上的变化相对稳定,平均为11.9%±0.64%。刘梦佳等[21]报道了研究区C断面悬浮颗粒物的重矿物组成,检出的铁质金属矿物包括赤铁矿/磁铁矿、钛铁矿、铬铁矿等,而长江口外悬浮物中赤铁矿/磁铁矿相对富集。
3.2 沉积物全样Fe相态组成
Fe相态分析结果如表1和图4所示,全样中Fe元素的回收率95%~110%。FeT含量为2.20%~5.15%,平均为3.51%;FeHR含量为1.02%~2.37%,平均为1.64%;FePR含量为0.67%~1.97%,平均为1.22%;FeU含量为0.41%~2.09%,平均为0.64%。三个相态含量大小排序FeHR>FePR>FeU(图4a)。研究区FeT含量位于文献报道的范围之内[12-14],但是Fe的不同相态含量排序不同,FeHR/FeT比值均高于文献报道的结果。全球河流悬浮颗粒物Fe的三个相态含量大小遵循FeHR>FeU>FePR[2-3],而大陆边缘沉积物表现为FeU>FeHR>FePR[1],即FeHR/FeT比值在河流颗粒物(0.43)和陆架沉积物(0.28)之间存在明显差异(表1)。长江南京段干流悬浮颗粒物Fe的三个相态含量大小遵循FeHR>FeU>FePR[22],而东海陆架沉积物表现为FePR>FeHR>FeU[12-14]。可见,与许多其他陆架沉积物一样,东海陆架沉积物中FeHR/FeT比值(0.30)低于其长江源入海颗粒物(0.45)(表1)。
表 1 长江口-东海陆架表层沉积物全样及黏土组分Fe相态分析结果Table 1. Fe speciation analyses results of bulk sample and clay fraction of surface sediments in the Changjiang River estuary and East China Sea样品名称 位置 水深
/m全样 黏土 东经 北纬 FeHR
/%FePR
/%FeU
/%FeT
/%Al
/%FeHR/FeT FeT/Al FeHR
/%FePR
/%FeU
/%FeT
/%Al
/%FeHR/FeT FeT/Al C1 121.10° 31.77° 12.5 2.03 1.03 2.09 5.15 5.01 0.39 1.03 5.07 1.01 1.45 7.54 12.8 0.67 0.59 C2 121.31° 31.61° 18.5 1.34 0.80 0.49 2.64 5.91 0.51 0.45 4.62 1.48 0.84 6.94 13.2 0.67 0.53 C3 121.57° 31.40° 8.0 1.10 0.67 0.42 2.20 5.30 0.50 0.41 5.09 1.73 0.86 7.69 12.3 0.66 0.63 C5 121.75° 31.29° 16.8 1.88 1.97 0.62 4.47 9.50 0.42 0.47 3.25 2.00 0.82 6.07 12.6 0.53 0.48 C6 121.95° 31.12° 8.5 2.07 1.43 0.66 4.16 8.68 0.50 0.48 3.55 1.90 0.84 6.29 12.9 0.56 0.49 C6-1 122.04° 31.07° 6.0 2.08 1.37 0.79 4.25 8.68 0.49 0.49 3.64 1.75 0.73 6.11 12.7 0.59 0.48 C7 122.16° 31.03° 8.7 2.37 1.38 0.78 4.53 9.68 0.52 0.47 3.40 1.33 1.37 6.11 12.8 0.56 0.48 C8 122.25° 31.02° 8.5 1.92 1.40 0.59 3.91 8.56 0.49 0.46 3.81 1.74 0.78 6.32 12.7 0.60 0.50 C9 122.37° 31.00° 10.7 1.88 1.29 0.52 3.69 8.11 0.51 0.46 3.69 1.52 0.95 6.16 12.7 0.60 0.48 C10 122.45° 30.97° 12.0 1.61 1.25 0.55 3.41 7.62 0.47 0.45 3.44 1.03 1.67 6.14 12.6 0.56 0.49 C11 122.62° 30.92° 20.0 1.67 1.41 0.60 3.68 8.09 0.45 0.46 3.36 1.46 1.44 6.26 12.3 0.54 0.51 C12 122.74° 30.94° 22.2 1.95 1.69 0.45 4.09 9.08 0.48 0.45 3.40 1.76 0.83 5.99 12.3 0.57 0.49 C13 122.89° 30.80° 32.7 1.79 1.47 0.55 3.81 8.53 0.47 0.45 3.27 1.82 0.75 5.83 12.2 0.56 0.48 C14 123.26° 30.67° 58.4 1.12 0.88 0.41 2.40 5.84 0.47 0.41 3.06 1.08 1.69 5.83 12.4 0.53 0.47 C15 123.50° 30.51° 56.6 1.09 0.88 0.45 2.42 5.53 0.45 0.44 3.01 1.12 1.51 5.64 12.3 0.53 0.46 C16 124.00° 30.29° 50.0 1.02 0.89 0.48 2.40 5.57 0.43 0.43 2.79 1.87 0.68 5.35 12.1 0.52 0.44 C18 124.49° 30.08° 53.2 1.04 0.86 0.50 2.39 5.79 0.43 0.41 2.93 1.72 0.86 5.51 11.9 0.53 0.46 本研究平均值 – – – 1.64 1.22 0.64 3.51 7.38 0.47 0.48 3.61 1.55 1.06 6.22 12.5 0.58 0.50 标准偏差 – – – 0.44 0.35 0.39 0.92 1.65 0.04 0.14 0.69 0.33 0.36 0.63 0.33 0.05 0.05 长江悬浮物[22] – – – 2.30 0.93 1.92 5.15 9.83 0.45 0.52 – – – – – – – 标准偏差 – – – 0.21 0.20 0.09 0.16 0.92 0.03 0.05 – – – – – – – 全球河流颗粒物[2-3] – – – 2.09 1.21 1.49 4.81 5.82 0.43 0.61 – – – – – – – 标准偏差 – – – 0.08 0.05 0.06 0.19 2.79 0.03 0.17 – – – – – – – 东海陆架沉积物[12-14] 0.99 1.37 0.86 3.23 – 0.30 0.61 标准偏差 0.39 0.29 0.29 0.72 – 0.07 0.10 大陆边缘沉积物[1] – – – 1.03 0.84 1.83 3.69 – 0.28 – – – – – – – – 标准偏差 – – – 0.40 0.26 0.53 0.91 – 0.06 – – – – – – – – 注:“–”代表无数据。 ![]() 图 4 沉积物全样(a)及黏土组分中(b)FeT含量以及FeHR、FePR和FeU贡献比例Figure 4. Partitioning of FeT, FeHR, FePR, and FeU in the bulk sample (a) and clay fraction (b) of the surface sediments
图 4 沉积物全样(a)及黏土组分中(b)FeT含量以及FeHR、FePR和FeU贡献比例Figure 4. Partitioning of FeT, FeHR, FePR, and FeU in the bulk sample (a) and clay fraction (b) of the surface sediments本研究中长江口沉积物Fe的相态分布特征显然反映河口样品主要受长江陆源碎屑的影响,具有较高的FeHR含量特征。而Zhu等[12]和Wei等[14]的研究样品多来自陆架沉积物,具有较高的FePR含量特征;Li等[13]采用三步提取法,第一步直接提取出FeHR,相比于本研究采用四步提取出FeHR,可能会缺失部分Fe的矿物相(如磁铁矿)。
3.3 黏土组分Fe相态组成
Fe相态分析结果显示,黏土组分中Fe元素的回收率88%~100%。FeT含量5.35%~7.69%,平均为6.22%,均高于全样;FeHR含量2.79%~5.09%,平均为3.61%;FePR含量1.01%~2.00%,平均为1.55%;FeU含量0.68%~1.69%,平均为1.06%。三个相态含量大小排序遵循FeHR>FePR>FeU(图4b),这与全样的排序相同。
4. 讨论
4.1 沉积物全样高活性Fe组成的主要控制因素
沉积物中Fe的化学相态与沉积物组成,如平均粒径、黏土含量、TOC和Al含量密切相关[2-3,12-13]。在本研究中,表层沉积物的平均粒径、黏土含量、TOC和Al含量之间存在显著差异,在低盐度和高盐度区域,这些参数值明显不同于中盐度区域。具体表现为在低盐度和高盐度区域的平均粒径较高,而黏土含量、TOC和Al含量较低;相反,在中盐度区域,平均粒径较低,而黏土含量、TOC和Al含量较高,这表明有机物与细粒沉积物结合的亲和力更高[19-20],而细粒沉积物中更富含铝硅酸盐黏土矿物。
相关性分析表明,虽然FeT和FeHR与Mz和黏土含量的相关性较差,但总体上可以将数据划分成两组。在低盐度和高盐度区域,沉积物平均粒径较高,黏土含量较低,FeT和FeHR含量也较低;相反,在中盐度区域,沉积物平均粒径较低,黏土含量较高,FeT和FeHR含量也较高(图5a、b),表明FeT和FeHR倾向于富集在细粒(黏土组分)沉积物中。同时,TOC含量与FeT(r2=0.83)和FeHR(r2=0.83)均具有显著正相关关系(图5c), 表明FeT和FeHR与富含有机物的细粒(黏土组分)沉积物有关。由于铁氧化物与有机物的结合主要通过吸附和共沉淀的方式,这两种方式提供了更多的铁氧化物与有机物结合机会和交互机制,导致有机质与铁氧化物的相互作用增加[23];且在河口三角洲区域,由于复杂的氧化还原条件,铁氧化物优先与陆源有机碳结合,因此,FeT与TOC之间的正相关性可能指示了河口地区陆源有机碳随细粒沉积物的输运过程。此外,Al含量也与FeT(r2=0.87)和FeHR(r2=0.92)呈显著正相关(图5d),表明含铁铝硅酸盐(黏土)矿物是细粒沉积物中FeT和FeHR的主要载体[12-13],这是由于铝硅酸盐(黏土)矿物表面通常具有较多活性位点,这些位点能够与铁氧化物形成吸附、表面结晶或沉淀,从而影响沉积物中铁的分布和形态。因此,FeHR与粒度、黏土含量、TOC和Al含量高度相关均指示富含有机质的铝硅酸盐黏土矿物更易于富集高活性铁。
![]() 图 5 沉积物全样总Fe(FeT)和高活性Fe(FeHR)含量与平均粒径、黏土含量、TOC以及Al含量之间的相关关系虚线圆代表低盐度和高盐度区域(站位C1至C6、C14至C18),圆外为中盐度区域(站位C6-1至C13),d图中的拟合曲线不包括C1站位。Figure 5. Comparison of FeT and FeHR content with mean grain size (a), content of clay (b), TOC (c), and Al (d) of the bulk sedimentsThe dashed ellipses in the figure represent low salinity and high salinity zones (stations C1 to C6 and C14 to C18), while the others represent medium salinity zone (stations C6-1 to C13), and the fitting curve in panel (d) does not include the station C1.
图 5 沉积物全样总Fe(FeT)和高活性Fe(FeHR)含量与平均粒径、黏土含量、TOC以及Al含量之间的相关关系虚线圆代表低盐度和高盐度区域(站位C1至C6、C14至C18),圆外为中盐度区域(站位C6-1至C13),d图中的拟合曲线不包括C1站位。Figure 5. Comparison of FeT and FeHR content with mean grain size (a), content of clay (b), TOC (c), and Al (d) of the bulk sedimentsThe dashed ellipses in the figure represent low salinity and high salinity zones (stations C1 to C6 and C14 to C18), while the others represent medium salinity zone (stations C6-1 to C13), and the fitting curve in panel (d) does not include the station C1.4.2 黏土组分高活性Fe的富集效应
沉积物全样和黏土组分中FeHR和FePR与Al含量的相关分析表明(图6a、b),黏土组分的Al含量相对集中,而且Al及FeHR含量是全样的接近两倍,而黏土组分的FePR含量与全样基本相当。全样和黏土组分中FeHR/FeT与FeT之间总体呈现正相关性(图6c),黏土组分的FeHR/FeT比值变化范围为0.52~0.67,明显高于全样的0.39~0.52(增加10%)。我们推测FeHR与黏土矿物的结合更紧密,这也与全样中FeHR和Al含量之间的正相关性结果相一致(图5d,图6a),反映黏土中FeHR的富集效应与铁氧化物在铝硅酸盐黏土矿物表面结晶或沉积等过程密切相关。换言之,黏土矿物具有高比表面积、丰富的表面官能团以及微观孔隙结构等特点,对FeHR的吸附能力更强,从而导致FeHR的富集。
![]() 图 6 沉积物全样和黏土组分中FeHR(a)和FePR(b)与Al含量的相关关系,以及FeHR/FeT(c)和FePR/FeT(d)与FeT含量的相关关系Figure 6. The correlation between FeHR (a) and FePR (b) with Al content, and between FeHR/FeT (c) and FePR/FeT (d) with FeT in both bulk and clay fraction of the surface sediments
图 6 沉积物全样和黏土组分中FeHR(a)和FePR(b)与Al含量的相关关系,以及FeHR/FeT(c)和FePR/FeT(d)与FeT含量的相关关系Figure 6. The correlation between FeHR (a) and FePR (b) with Al content, and between FeHR/FeT (c) and FePR/FeT (d) with FeT in both bulk and clay fraction of the surface sediments值得注意的是,虽然全样FePR和Al含量之间也具有正相关性(图6b),但是全样和黏土组分中FePR/FeT与FeT之间呈现负相关性(图6d)。黏土组分的FePR/FeT比值变化范围为0.13~0.35,这明显低于全样的0.2~0.44(降低10%),说明细粒铝硅酸盐矿物可能不是FePR的主要载体。由于FePR在生物地球化学过程中的反应性相对较低[2],相关研究也较少,FePR/FeT可能指示陆架沉积物中富铁自生黏土矿物的形成[12],如海绿石的形成对海洋环境中反风化作用发生程度的指示[24],都需要更深入的研究。
与已发表的表层沉积物全样数据[12-14]比较发现,虽然Fe相态分析方法有所不同,但是图7显示FeT和FeHR与Al含量之间都具有显著正相关性。FeT与Al显著相关(r2=0.83),这一趋势与全球河流颗粒物的趋势线有所不同[3],指示了FeT部分受陆源输入的控制。FeHR与Al含量之间也呈线性相关(r2=0.74),与全球河流颗粒物的趋势线非常接近[3],表明FeHR与陆源含铁铝硅酸盐矿物密切相关。同时,全样数据的投点都低于长江悬浮颗粒物[22],体现出富含FeHR的河流颗粒物可能主要被截留在河口地区。
![]() 图 7 长江口-东海陆架表层沉积物FeT(a)和FeHR(b)与Al含量的相关关系全球河流颗粒物的拟合线来自Poulton和Raiswell[3].Figure 7. Correlation plot of FeT vs. Al (a) and FeHR vs. Al (b) for the surface sediments in the Changjiang River estuary and East China Sea
图 7 长江口-东海陆架表层沉积物FeT(a)和FeHR(b)与Al含量的相关关系全球河流颗粒物的拟合线来自Poulton和Raiswell[3].Figure 7. Correlation plot of FeT vs. Al (a) and FeHR vs. Al (b) for the surface sediments in the Changjiang River estuary and East China Sea相对而言,本研究中黏土Al含量相对集中,远高于长江口-东海陆架沉积物以及长江悬浮颗粒物,并逐渐偏离全样趋势线,说明黏土组分可以消除粒度效应,具有FeT(或FeHR)的富集效应。因此,黏土矿物是FeHR的重要载体,其在流域-河口-陆架的迁移可能主导了高活性Fe在陆海界面的分布和循环过程。
4.3 河口-陆架沉积物断面高活性Fe变化特征及其控制因素
河流水体中的Fe3+在河口处与海水混合时,由于pH升高形成Fe(OH)3胶体,Fe(OH)3胶体随盐度增加发生絮凝、沉淀作用,将Fe固定到河口沉积物中,这构成了“河口过滤器”效应的基本模式[25-27]。类似地,研究发现河流和海洋沉积物之间Fe相态的差异主要源于河口的“捕获作用”,即河流颗粒物中富含FeHR的物质被截留在河口地区[2,26,28],导致河流入海颗粒物中FeHR/FeT比值明显高于海洋沉积物。
本研究表层沉积物全样中FeT和FeHR沿断面的变化表现出相似的分布模式(图8a、b),呈现“倒U型”变化趋势,C1站位FeT和FeHR含量接近长江悬浮颗粒物组成 [22],指示了富含FeHR的长江物质的输入,且从C1至C3站位,含量快速下降;而在最大浑浊带(TMZ)附近的C5至C10站位,FeT和FeHR含量升高至较高水平,表明水动力分选影响了颗粒态Fe的分布,主要与细颗粒物在最大浑浊带的絮凝沉降有关;在外海水控制的C14至C18站位,FeT和FeHR含量明显下降,且接近东海陆架沉积物组成[12-14],表明受到来自贫FeHR的陆架物质的影响,如古长江残留砂[29]。特别值得注意的是,黏土组分中FeT和FeHR含量明显高于全样,且与全样类似“倒U型”变化趋势有较大差异。在低盐度区域,从C1至C5站位,FeT和FeHR含量分别降低了21%和36%;在中盐度区域,从C6至C13站位(覆盖最大浑浊带),含量基本保持稳定,表明黏土组分较大程度消除了粒度效应的影响,尤其在最大浑浊带附近,水动力条件变化引起的细颗粒沉积物的絮凝沉降和再悬浮对其影响较小,颗粒态Fe的分布更为均匀;在高盐度区域,从C14至C18站位,含量小幅下降8%。
![]() 图 8 沉积物全样和黏土组分中FeT(a)、FeHR(b)、FeHR/FeT(c)和FeT/Al(d)沿C断面变化特征沉积物平均粒径和底层水溶解氧(DO)含量分别绘于图(a、b)和图(c、d)中,蓝色五角星代表长江悬浮物平均值,红色五角星代表东海陆架沉积物平均值,其Fe相态数据来源见表1,灰色区域为最大浑浊带(TMZ),图c中虚线为有氧条件下海洋沉积物FeHR/FeT的上限阈值(0.38)[1,31],图d中虚线为有氧条件下现代海洋沉积物FeT/Al的范围0.55±0.11(1σ)[32],蓝色区域为陆源碎屑物质FeT/Al的范围0.47±0.05(1σ)[33]。Figure 8. Spatial variations of FeT, FeHR, FeHR/FeT, and FeT/Al in both bulk and clay fraction of the surface sediments along the C transectThe mean grain size of sediment is plotted in panel (a) and (b). The dissolved oxygen content (DO) in the bottom water is plotted in panel (c) and (d). The blue star represents suspended sediment of the Changjiang River, and the red star represents East China Sea shelf sediment. The data source of Fe speciation is shown in Table 1. The gray area is turbidity maximum zone (TMZ). The dashed line in panel (c) represents the upper threshold FeHR/FeT ratio of marine sediments under oxic water column conditions (0.38)[1,31],The dashed line in panel (d) is the range in FeT/Al for average oxic modern marine sediments, 0.55±0.11 (1σ)[32]. The blue area is the range in FeT/Al for terrestrial materials, 0.47±0.05 (1σ)[33].
图 8 沉积物全样和黏土组分中FeT(a)、FeHR(b)、FeHR/FeT(c)和FeT/Al(d)沿C断面变化特征沉积物平均粒径和底层水溶解氧(DO)含量分别绘于图(a、b)和图(c、d)中,蓝色五角星代表长江悬浮物平均值,红色五角星代表东海陆架沉积物平均值,其Fe相态数据来源见表1,灰色区域为最大浑浊带(TMZ),图c中虚线为有氧条件下海洋沉积物FeHR/FeT的上限阈值(0.38)[1,31],图d中虚线为有氧条件下现代海洋沉积物FeT/Al的范围0.55±0.11(1σ)[32],蓝色区域为陆源碎屑物质FeT/Al的范围0.47±0.05(1σ)[33]。Figure 8. Spatial variations of FeT, FeHR, FeHR/FeT, and FeT/Al in both bulk and clay fraction of the surface sediments along the C transectThe mean grain size of sediment is plotted in panel (a) and (b). The dissolved oxygen content (DO) in the bottom water is plotted in panel (c) and (d). The blue star represents suspended sediment of the Changjiang River, and the red star represents East China Sea shelf sediment. The data source of Fe speciation is shown in Table 1. The gray area is turbidity maximum zone (TMZ). The dashed line in panel (c) represents the upper threshold FeHR/FeT ratio of marine sediments under oxic water column conditions (0.38)[1,31],The dashed line in panel (d) is the range in FeT/Al for average oxic modern marine sediments, 0.55±0.11 (1σ)[32]. The blue area is the range in FeT/Al for terrestrial materials, 0.47±0.05 (1σ)[33].这里采用FeHR/FeT比值能够在一定程度上消除粒度效应,且其不受FeT含量及贫铁相(如生物成因碳酸盐和有机质)稀释作用的影响[2,12]。全样中FeHR/FeT比值在低盐度区域波动较大(图8c),在中高盐度区域逐渐下降,指示Fe的来源相对稳定。黏土组分中FeHR/FeT比值在低盐度区域降低了21%,表明FeT(或FeHR)被截留在河口低盐度区域,这一过程主要发生在长江口最大浑浊带前缘;在中高盐度区域FeHR/FeT小幅下降,反映黏土组分中Fe的来源相对稳定,这与全样的结果相一致,主要为富FeHR的长江源和贫FeHR的陆架源沉积物混合。
在缺氧水体中和沉积物-水界面之下,Fe元素在水柱中的迁移和沉淀往往导致缺氧水体沉积物中富集FeHR,因此FeHR/FeT比值可以作为(古)氧化还原条件指标,FeHR/FeT<0.22指示有氧条件,而FeHR/FeT>0.38则指示缺氧条件[1,30-31]。本研究中,全样和黏土组分中FeHR/FeT变化范围分别为0.39~0.52和0.52~0.67,均明显高于缺氧阈值0.38(指示缺氧条件),而仅C13站位处于夏季缺氧区内(底层水DO<2 mg/L),且并未观察到其具有比其他站位更高的FeHR/FeT比值。这里可以结合FeT/Al比值,其通常用于反映海洋沉积环境,有氧条件下现代海洋沉积物FeT/Al的变化范围为0.55±0.11(1σ)[32],本研究中大多数样品都处于这一区间范围(指示有氧条件,图8d)。全样和黏土组分中FeT/Al沿断面的分布特征与FeT基本一致(C1站位除外),其平均值0.49±0.10(1σ)更接近于陆源碎屑物质的平均组成0.47±0.05(1σ)[33]。结果表明研究区表层沉积物的FeHR/FeT不能快速响应或记录季节性的缺氧环境,更多反映了陆源物质的影响。Li等[13]研究也指出从长江口到缺氧区,表层沉积物的FeHR/FeT变化相对稳定(平均值为0.31±0.03),由于长江口属于季节性缺氧,该区域的大多数沉积物可能不是在缺氧环境下沉积的,因此,FeHR/FeT不会记录明显的缺氧信号。综上,沉积物中Fe的来源以及河口动力环境(水动力分选)共同控制了长江口-东海陆架沉积物断面高活性Fe的变化特征,有助于深入理解河口到陆架的关键元素循环与界面过程。
5. 结论
(1)长江口-东海陆架不同粒级沉积物中铁化学相态组成特征显示,全样中FeT和FeHR含量与平均粒径、黏土、有机碳和铝含量之间都存在一定相关关系;同时,黏土组分中FeHR/FeT比值与全样相比增加了10%,而FePR/FeT比值相较于全样则降低了10%,指示富含有机质的铝硅酸盐黏土矿物更易于富集FeHR,即黏土组分具有FeHR的富集效应。
(2)长江口-东海陆架沉积物断面高活性的Fe变化特征主要受控于沉积物来源以及河口水动力分选(粒度效应)。数据表明,黏土组分能够较大程度地消除粒度效应的影响,在低盐度区域(最大浑浊带前缘),FeHR被大量截留;在中高盐度区域,表现为富FeHR的长江源和贫FeHR的陆架源沉积物的混合,氧化还原条件对沉积物FeHR变化的影响较小。未来基于大河流域-高浊度河口-宽陆架沉积物中黏土组分高活性铁行为的深入研究,有助于更全面地理解海洋中铁和碳的生物地球化学循环及其源汇效应。
致谢:本研究航次调查由“浙渔科2号”科考船实施,对全体船员及科考人员在样品采集中给予的帮助,在此一并致谢。
致谢: 沉积物样品由上海海洋大学上海深渊科学工程技术研究中心“张謇号”科考船采集获得,感谢全体船员与同行在样品采集过程中的帮助,同时感谢中国科学院地球化学研究所漆亮研究员在常量、微量及稀土元素测试方面的帮助。 -
![]()
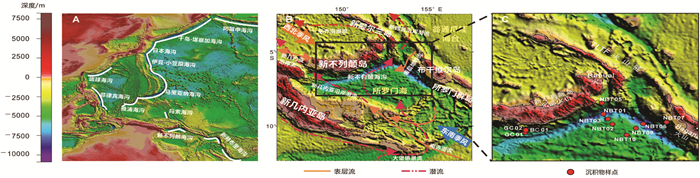
图 1 新不列颠海沟表层沉积物站位位置及其附近区域自然环境背景
A.西太平洋深渊海沟分布;B.新不列颠海沟环境背景;C.表层沉积物站位位置
Figure 1. Environmental setting and location of study sites in the New Britain Trench and adjacent area
A.The distribution of Hadal Trench in the west Pacific Ocean; B. Environmental setting in the New Britain Trench; C. The location of surface sediments sampling sites
![]()
![]()
![]()
![]()
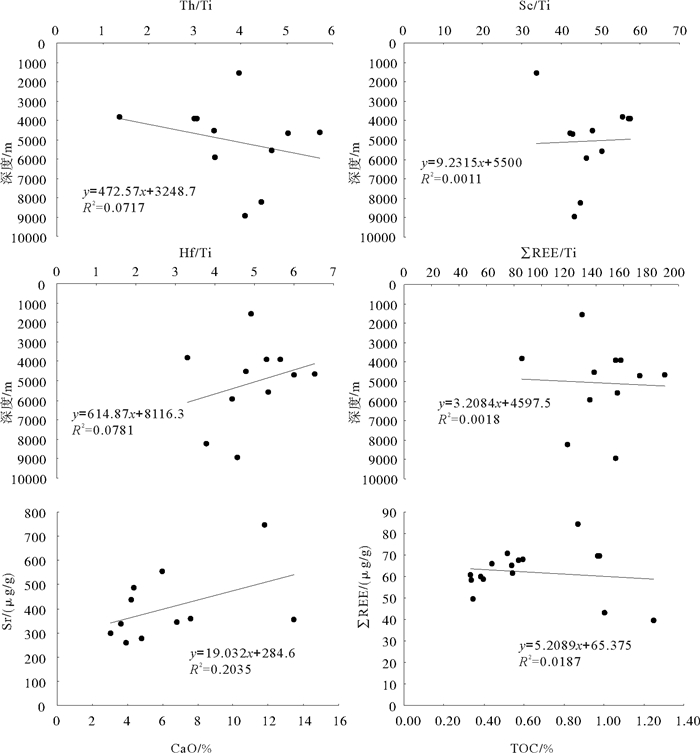
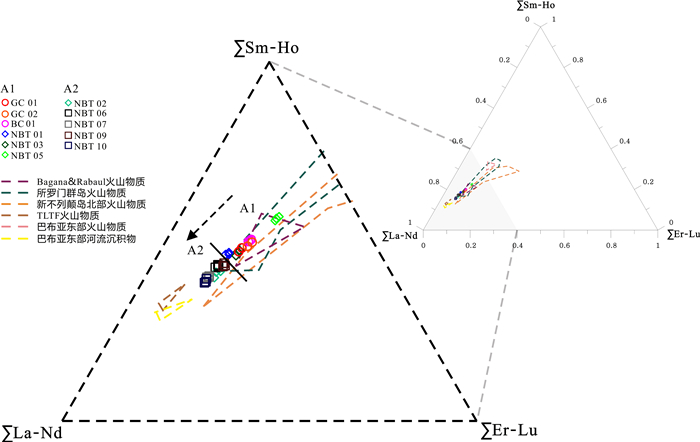
图 5 新不列颠海沟表层沉积物元素比值与深度及稀土元素与有机质关系图
Figure 5. Relationship between element ratios and water depth, ∑REE and organic matter of surface sediments in the New Britain Trench
![]()
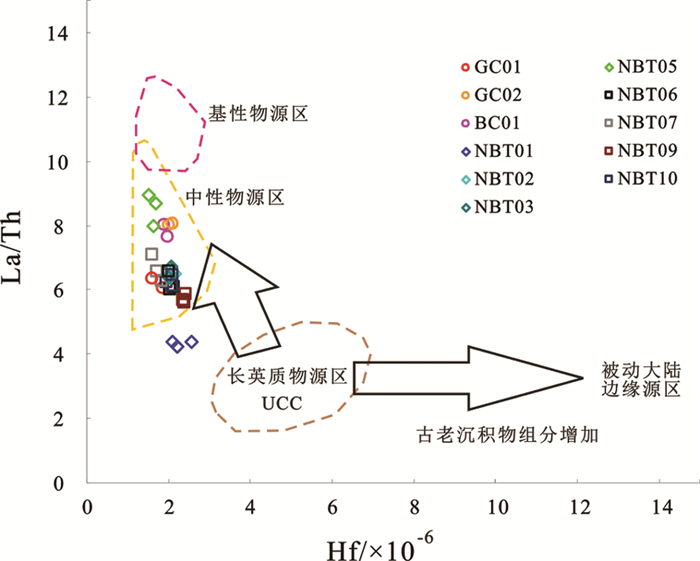
图 6 新不列颠海沟表层沉积物Hf-La/Th物质判别图
Figure 6. The Hf-La/Th for provenance study for surface sediments in the New Britain Trench
![]()
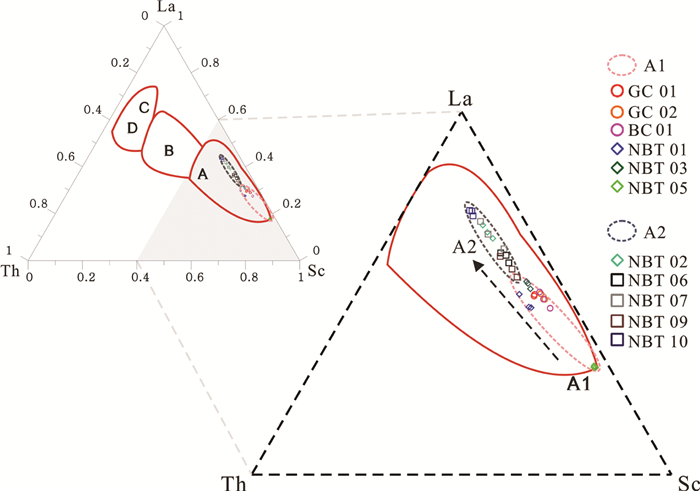
图 7 新不列颠海沟表层沉积物构造环境三角图
A.大洋岛弧,B.大陆岛弧,C.活动大陆边缘,D.被动大陆边缘
Figure 7. Triangular diagram of tectonic environment study of surface sediments in the New Britain Trench
A. Oceanic Island arc, B. Continental Island arc, C. Active continental margin, D. Passive continental margin
![]()
表 1 新不列颠海沟表层沉积物站位信息
Table 1 Locations of surface sediment samples in the New Britain Trench
站位 经度 纬度 水深/m 位置 时间 GC01 149°45.53′E 6°40.84′S 4524 西支岛坡 2016 GC02 149°45.46′E 6°36.89′S 3908 西支岛坡 2016 BC01 149°45.48′E 6°36.83′S 3900 西支岛坡 2016 NBT01 152°24.67′E 5°53.08′S 8225 西支海沟轴部 2017 NBT02 152°43.01′E 6°19.99′S 4675 西支洋坡 2017 NBT03 152°33.89′E 6°06.10′S 5925 西支洋坡 2017 NBT05 152°21.17′E 5°24.06′S 3826 西支岛坡 2017 NBT06 153°44.79′E 6°19.21′S 8931 东支海沟轴部 2017 NBT07 154°32.29′E 6°14.49′S 1553 东支岛坡 2017 NBT09 153°30.15′E 6°30.17′S 5653 东支洋坡 2017 NBT10 153°11.54′E 6°48.40′S 4639 东支洋坡 2017  下载: 导出CSV
表 2 新不列颠海沟各区域的表层沉积物主量元素值
Table 2 The major element contents for surface sediments in the New Britain Trench
% 样品编号 Na2O MgO Al2O3 P2O5 K2O CaO TiO2 MnO Fe2O3 GC01-1 2.26 3.08 16.47 0.21 1.20 4.77 0.78 0.24 8.27 GC01-3 1.84 3.16 16.24 0.16 1.23 6.87 0.80 0.15 8.57 GC02-1 4.04 2.29 14.54 0.17 1.20 6.78 0.62 0.37 6.43 GC02-3 4.91 2.36 14.45 0.16 1.23 6.62 0.60 0.35 6.39 BC01-1 5.13 2.53 14.18 0.17 1.15 7.56 0.62 0.26 6.84 BC01-2 4.95 2.48 14.38 0.18 1.14 7.74 0.62 0.24 6.69 BC01-5 4.48 2.38 14.47 0.17 1.16 7.61 0.62 0.28 6.67 NBT01-1 4.17 5.68 15.17 0.20 1.73 3.92 0.98 0.21 10.06 NBT01-2 4.34 5.68 15.10 0.20 1.70 3.44 0.98 0.16 10.02 NBT01-3 3.71 5.33 15.09 0.20 1.61 4.37 0.98 0.15 9.59 NBT02-1 4.93 2.40 15.78 0.22 1.95 4.20 0.57 0.21 5.64 NBT02-2 4.61 2.46 15.88 0.22 1.88 4.17 0.59 0.21 5.92 NBT02-3 4.37 2.58 15.95 0.23 1.81 4.17 0.61 0.23 6.13 NBT03-1 4.54 3.16 16.33 0.22 1.53 3.64 0.76 0.31 7.88 NBT03-2 4.25 3.16 16.27 0.22 1.54 3.61 0.77 0.33 7.95 NBT03-3 3.99 3.08 16.57 0.21 1.55 3.49 0.78 0.33 7.88 NBT05-1 3.58 2.93 13.35 0.15 0.82 13.45 0.77 0.23 7.44 NBT05-2 3.19 3.11 14.11 0.16 0.88 11.90 0.83 0.36 7.90 NBT05-3 3.22 3.27 15.68 0.17 0.92 10.25 0.87 0.61 8.67 NBT06-1 4.72 3.30 16.06 0.26 1.95 5.98 0.73 0.21 7.34 NBT06-2 4.79 3.31 16.34 0.25 1.99 5.86 0.76 0.22 7.27 NBT06-3 4.81 3.49 16.48 0.25 1.95 4.80 0.77 0.21 7.74 NBT07-1 4.07 2.46 14.62 0.24 1.47 11.79 0.62 0.14 6.62 NBT07-2 4.55 2.31 14.38 0.23 1.56 11.85 0.56 0.14 5.68 NBT07-3 3.96 2.19 14.15 0.24 1.54 11.92 0.54 0.13 5.57 NBT09-1 4.69 3.09 16.31 0.23 1.81 2.78 0.76 0.36 7.68 NBT09-2 4.39 3.06 16.23 0.23 1.81 2.81 0.77 0.27 7.78 NBT09-3 4.21 2.98 16.50 0.20 1.74 3.01 0.74 0.35 7.81 NBT10-1 4.93 2.43 15.62 0.24 2.04 4.36 0.53 0.20 5.48 NBT10-2 4.92 2.33 15.76 0.23 2.13 3.96 0.53 0.21 5.47 NBT10-3 4.53 2.23 14.89 0.20 1.95 3.83 0.50 0.18 4.88
下载: 导出CSV
表 3 新不列颠海沟各区域的表层沉积物微量元素值
Table 3 The trace element contents for surface sediments in the New Britain Trench 10-6
编号 Cs Rb Ba Th U Ta Nb Pb Sr Zr Hf Y Sc GC01-1 1.35 25.1 333 1.60 0.96 0.19 2.56 26.0 277 81.0 2.25 22.0 22.5 GC01-3 1.51 25.9 377 1.86 1.06 0.20 2.92 13.3 327 88.5 2.43 24.1 25.1 GC02-1 1.01 21.9 313 1.14 0.80 0.14 1.98 8.97 346 79.1 2.10 21.3 21.3 GC02-3 0.95 20.6 308 1.10 0.78 0.21 1.83 8.28 335 75.1 2.00 20.6 19.5 BC01-1 0.96 18.7 309 1.12 0.80 0.26 1.93 8.20 357 72.5 1.98 20.6 21.5 BC01-2 0.90 18.2 298 1.12 0.78 0.12 1.77 8.06 359 71.2 1.91 20.7 19.8 BC01-5 0.90 18.5 309 1.17 0.76 0.13 1.90 7.58 359 71.6 1.98 21.0 20.8 NBT01-1 2.21 39.6 197 2.61 0.87 0.28 4.01 8.85 258 85.4 2.22 21.2 26.3 NBT01-2 2.63 47.4 241 3.06 0.93 0.34 5.02 10.1 301 98.9 2.57 25.4 28.4 NBT01-3 2.04 38.5 197 2.45 0.89 0.28 4.06 8.10 267 83.9 2.10 21.4 25.8 NBT02-1 0.83 32.9 371 1.71 0.84 0.32 4.28 7.83 438 76.5 2.05 16.6 14.6 NBT02-2 0.83 30.4 366 1.73 0.84 0.30 4.00 8.12 420 73.4 2.04 17.9 14.3 NBT02-3 0.94 32.5 377 1.72 0.86 0.30 4.16 8.61 399 79.2 2.14 17.9 15.7 NBT03-1 0.95 27.5 272 1.57 0.84 0.24 3.33 9.49 337 77.6 2.02 20.2 21.1 NBT03-2 0.90 25.5 266 1.51 0.88 0.23 3.11 9.55 327 74.2 2.02 20.9 20.4 NBT03-3 1.10 29.0 297 1.61 0.91 0.26 3.70 9.59 347 83.5 2.06 21.6 21.5 NBT05-1 0.60 15.2 156 0.63 0.86 0.10 1.39 6.06 355 62.3 1.52 16.8 25.7 NBT05-2 0.56 15.1 154 0.66 0.78 0.10 1.40 5.58 340 65.5 1.68 17.9 25.7 NBT05-3 0.59 16.3 162 0.74 0.74 0.12 1.57 5.91 305 67.0 1.63 17.9 26.6 NBT06-1 1.03 31.6 257 1.79 0.92 0.28 4.13 9.09 554 79.5 2.00 19.0 18.9 NBT06-2 1.12 32.6 260 1.88 1.01 0.30 4.44 9.21 554 81.5 2.04 18.7 17.7 NBT06-3 1.16 31.7 248 1.85 1.01 0.29 4.10 8.61 508 78.7 2.12 19.5 19.1 NBT07-1 0.54 28.2 335 1.48 0.79 0.34 4.60 6.27 746 67.9 1.84 13.9 12.6 NBT07-2 0.54 27.3 343 1.44 0.78 0.33 4.50 5.97 762 68.2 1.71 13.7 11.7 NBT07-3 0.48 25.6 318 1.34 0.72 0.30 4.59 5.73 749 63.2 1.59 14.2 14.6 NBT09-1 1.41 34.3 341 2.07 1.01 0.34 4.64 11.1 297 93.7 2.37 21.2 20.0 NBT09-2 1.49 36.8 343 2.24 1.09 0.37 4.97 12.0 307 91.3 2.38 22.4 23.1 NBT09-3 1.43 34.7 347 2.22 1.08 0.34 4.58 12.3 304 89.9 2.40 23.1 22.3 NBT10-1 0.98 38.3 418 1.83 0.84 0.38 4.99 9.12 487 74.2 2.09 16.5 13.5 NBT10-2 1.00 40.1 432 1.95 0.89 0.40 5.25 9.10 456 76.0 2.09 16.5 14.1 NBT10-3 0.94 36.8 414 1.84 0.86 0.36 4.94 8.26 460 66.4 1.94 15.9 13.0
下载: 导出CSV
表 4 新不列颠海沟各区域的表层沉积物稀土元素平均值(×10-6)及相关参数
Table 4 The average rare earth element contents and related parameters for surface sediments in the different areas of the new Britain Trench (×10-6)
 下载: 导出CSV
表 5 新不列颠海沟表层沉积物地球化学元素因子分析与相关性分析
Table 5 The results factor and correlation analysis for surface sediments from the New Britain Trench
元素 F1 F2 F3 P2O5 K2O CaO Ta Nb Sr ΣREE Na2O 0.044 0.382 -0.302 Na2O 0.41 0.53 -0.27 0.46 0.34 0.26 0.10 MgO 0.384 0.121 0.885 MgO -0.05 0.08 -0.29 0.04 0.15 -0.42 0.53 Al2O3 0.467 0.525 0.015 Al2O3 0.51 0.55 -0.74 0.38 0.44 -0.22 0.64 P2O5 -0.119 0.936 -0.111 P2O5 1.00 0.82 -0.32 0.74 0.80 0.59 0.29 K2O 0.274 0.911 -0.170 K2O 0.82 1.00 -0.65 0.88 0.90 0.28 0.55 CaO -0.822 -0.407 0.071 CaO -0.32 -0.65 1.00 -0.49 -0.48 0.48 -0.83 TiO2 0.304 -0.098 0.921 TiO2 -0.21 -0.20 -0.16 -0.24 -0.12 -0.55 0.39 MnO 0.043 -0.449 0.095 MnO -0.42 -0.42 -0.02 -0.48 -0.52 -0.50 -0.20 Fe2O3 0.379 -0.155 0.871 Fe2O3 -0.26 -0.24 -0.18 -0.26 -0.16 -0.58 0.44 Cs 0.783 0.159 0.521 Cs -0.02 0.27 -0.60 0.26 0.31 -0.53 0.84 Rb 0.500 0.778 0.136 Rb 0.59 0.85 -0.68 0.84 0.89 0.02 0.73 Ba 0.265 0.357 -0.847 Ba 0.36 0.51 -0.37 0.59 0.50 0.27 0.21 Th 0.653 0.637 0.284 Th 0.45 0.71 -0.71 0.70 0.77 -0.14 0.87 U 0.607 0.387 0.141 U 0.27 0.43 -0.59 0.37 0.42 -0.29 0.75 Ta 0.222 0.870 -0.208 Ta 0.74 0.88 -0.49 1.00 0.95 0.37 0.47 Nb 0.190 0.932 -0.072 Nb 0.80 0.90 -0.48 0.95 1.00 0.40 0.51 Pb 0.539 -0.003 -0.100 Pb 0.06 0.04 -0.45 0.04 0.05 -0.38 0.50 Sr -0.688 0.500 -0.280 Sr 0.59 0.28 0.48 0.37 0.40 1.00 -0.37 Zr 0.852 0.276 0.279 Zr 0.15 0.38 -0.72 0.35 0.40 -0.47 0.92 Hf 0.926 0.253 0.042 Hf 0.14 0.43 -0.80 0.40 0.41 -0.47 0.93 Y 0.840 -0.296 0.320 Y -0.35 -0.14 -0.54 -0.20 -0.18 -0.78 0.73 ΣREE 0.861 0.402 0.184 ΣREE 0.29 0.55 -0.83 0.47 0.51 -0.37 1.00 方差贡献 43.4 27.62 10.23 累积方差贡献 43.4 71.02 81.25
下载: 导出CSV
-
[1] Wolff T. The concept of the hadal or ultra-abyssal fauna[J]. Deep Sea Research and Oceanographic Abstracts, 1970, 17(6): 983-1003. doi: 10.1016/0011-7471(70)90049-5
[2] Jamieson A J, Fujii T, Mayor D J, et al. Hadal trenches: the ecology of the deepest places on Earth[J]. Trends in Ecology & Evolution, 2010, 25 (3): 190-197. http://cn.bing.com/academic/profile?id=1ec891356117ac6244f7e1c49d5fd6ab&encoded=0&v=paper_preview&mkt=zh-cn
[3] Jamieson A J, Fujii T. Trench connection[J]. Biology Letters, 2011, 7(5): 641-643. doi: 10.1098/rsbl.2011.0231
[4] 肖春晖, 王永红, 林间.海沟沉积物研究进展[J].热带海洋学报, 2017, 36(6): 27-38. http://d.old.wanfangdata.com.cn/Periodical/rdhy201706004 XIAO Chunhui, WANG Yonghong, LIN Jian. Research progress on ocean trench sedimentation [J]. Journal of Tropical Oceanography, 2017, 36 (6): 27-38. http://d.old.wanfangdata.com.cn/Periodical/rdhy201706004
[5] Heuret A, Conrad C P, Funiciello F et al. Relation between subduction megathrust earthquakes, trench sediment thickness and upper plate strain[J]. Geophysical Research Letters, 2012, 39 (5): L05304. http://d.old.wanfangdata.com.cn/NSTLQK/NSTL_QKJJ0226367761/
[6] Smith G L, Mcneilll C, Wang Kelin, et al. Thermal structure and megathrust seismogenic potential of the Makran subduction zone[J]. Geophysical Research Letters, 2013, 40 (8): 1528-1533. doi: 10.1002/grl.50374
[7] 王汾连, 何高文, 王海峰, 等.马里亚纳海沟柱状沉积物稀土地球化学特征及其指示意义[J].海洋地质与第四纪地质, 2016, 36(4): 67-75. http://www.wanfangdata.com.cn/details/detail.do?_type=perio&id=hydzydsjdz201604008 WANG Fenlian, HE Gaowen, WANG Haifeng et al. Geochemistry of rare earth elements in a core from mariana trench and its significance [J]. Marine Geology & Quaternary Geology, 2016, 36 (4): 67-75. http://www.wanfangdata.com.cn/details/detail.do?_type=perio&id=hydzydsjdz201604008
[8] Turnewitsch R, Falahat S, Stehlikova J, et al. Recent sediment dynamics in hadal trenches: Evidence for the influence of higher-frequency (tidal, near-inertial) fluid dynamics[J]. Deep Sea Research Part I: Oceanographic Research Papers, 2014, 90: 125-138. doi: 10.1016/j.dsr.2014.05.005
[9] Luo M, Thomas J A, Tong H P et al. More reducing bottom-water redox conditions during the Last Glacial Maximum in the southern Challenger Deep (Mariana Trench, western Pacific) driven by enhanced productivity[J]. Deep-Sea Research Ⅱ, 2017, doi: 10.1016/j.dsr2.2017.01.006.
[10] 李克让, 周春平, 沙万英.西太平洋暖池基本特征及其对气候的影响[J].地理学报, 1998, 53(6): 511-519. doi: 10.3321/j.issn:0375-5444.1998.06.006 LI Kerang, ZHOU Chunping, SHA Wanying. Basic features of the warm pool in the western pacific and its impact on climate [J]. Acta Geographica Sinica, 1998, 53(6): 511-519. doi: 10.3321/j.issn:0375-5444.1998.06.006
[11] Lea D W, Pak D K, Spero H J. Climate impact of late quaternary equatorial Pacific sea surface temperature variations[J]. Science, 2000, 289:1719-1724. doi: 10.1126/science.289.5485.1719
[12] Howell D G, Murray R W. A budget for continental growth and denudation[J]. Science, 1986, 233 (4762): 446-449. doi: 10.1126/science.233.4762.446
[13] Hay W W, Sloan J L, Wold C N. Mass/age distribution and composition of sediments on the ocean floor and the global rate of sediment subduction[J]. Journal of Geophysical Research: Solid Earth (1978-2012), 1998, 93 (B12):14933-14940. http://www.wanfangdata.com.cn/details/detail.do?_type=perio&id=10.1029/JB093iB12p14933
[14] 颜文, 陈木宏, 李春娣, 等.西太平洋暖池近3万年来的沉积序列及其环境特征—WP92-3柱样的REE记录[J].矿物学报, 2006, 26(1): 22-28. doi: 10.3321/j.issn:1000-4734.2006.01.004 YAN Wen, CHEN Muhong, LI Chundi, et al. The sedimentary sequences during last 30 ka revealed by REE records in core WP92-3 from West Pacific Warm Pool and their environmental implications [J]. Acta Mineralogica Sinica, 2006, 26 (1): 22-38. doi: 10.3321/j.issn:1000-4734.2006.01.004
[15] 路波, 李铁刚, 于心科, 等.赤道西太平洋翁通爪哇海台西南部25万年以来的火山活动:来自沉积物元素地球化学的证据[J].地球科学——中国地质大学学报, 2012, 37: 125-133. http://d.old.wanfangdata.com.cn/Periodical/dqkx2012z1012 LU Bo, LI Tiegang, YU Xinke, et al. Past 250 ka volcanic activities in southwest Ontong Java Plateau, West Equatorial Pacific: Evidences from element geochemistry [J]. Earth Science—Journal of China University of Geosciences, 2012, 37: 125-133. http://d.old.wanfangdata.com.cn/Periodical/dqkx2012z1012
[16] 吴家望, 刘志飞, 周超.西太平洋暖池晚第四纪黏土矿物的冰期旋回和岁差周期[J].科学通报, 2012, 57(23): 2145-2157. http://www.wanfangdata.com.cn/details/detail.do?_type=perio&id=kxtb201223001 WU Jiawang, LIU Zhifei, ZHOU Chao. Late Quaternary glacial cycle and precessional period of clay mineral assemblages in the Western Pacific Warm Pool [J]. Chinese Science Bulletin, 2012, 57 (23): 2145-2157. http://www.wanfangdata.com.cn/details/detail.do?_type=perio&id=kxtb201223001
[17] Cullers R L. The controls on the major and trace element variation of shales, siltstones and sandstones of Pennsylvanian-Permian age, from uplifted continental block in Colorado to platform sediment in Kansas, USA[J]. Geochimica et Cosmochimica Acta, 1994, 55: 4955-4972.
[18] Munksgaard N C, Lim K, Parry D L. Rare earth elements as provenance indicators in North Australian estuarine and coastal marine sediments[J]. Estuarine, Coastal and Shelf Science. 2003, 57(3): 399-409. doi: 10.1016/S0272-7714(02)00368-2
[19] 徐兆凯, 李安春, 李铁刚, 等.东菲律宾海表层沉积物常量元素组成及地质意义[J].海洋地质与第四纪地质, 2010, 30(6): 43-48. http://www.wanfangdata.com.cn/details/detail.do?_type=perio&id=hydzydsjdz201006006 XU Zhaokai, LI Anchun, LI Tiegang, et al. Major element compositions of surface sediments in the east Philippine Sea and its geological implication [J]. Marine Geology & Quaternary Geology, 2010, 30 (6): 43-48. http://www.wanfangdata.com.cn/details/detail.do?_type=perio&id=hydzydsjdz201006006
[20] Cooper P, Taylor B. Seismotectonics of New Guinea: A model for arc reversal following arc-continent collision[J]. Tectonics, 1987, 6 (1): 53-67. http://cn.bing.com/academic/profile?id=9147dba73e876cfc7e79f55402feeafe&encoded=0&v=paper_preview&mkt=zh-cn
[21] Johnson R. Geotectonics and volcanism in Papua New Guinea: a review of the late Cainozoic[J]. BMR Journal of Australian Geology and Geophysics, 1979, 4: 181-207. http://cn.bing.com/academic/profile?id=8c8b23f7ce57cdb53eb7c70b51470d18&encoded=0&v=paper_preview&mkt=zh-cn
[22] Davies H L, Price R C. Basalts from the Solomon and Bismarck Seas[J]. Geo-Marine Letters, 1987, 6 (4): 193-202. http://cn.bing.com/academic/profile?id=de6174a147377deab9b7e2052d92253b&encoded=0&v=paper_preview&mkt=zh-cn
[23] Kamenov G D, Perfit M R, Mueller P A, et al. Controls on magmatism in an island arc environment: study of lavas and sub-arc xenoliths from the Tabar-Lihir-Tanga-Feni island chain, Papua New Guinea[J]. Contributions to Mineralogy and Petrology, 2008, 155 (5): 635-656. doi: 10.1007/s00410-007-0262-0
[24] Hall R. Cenozoic geological and plate tectonic evolution of SE Asia and the SW Pacific: computer-based reconstructions, model and animations[J]. Journal of Asian Earth Sciences, 2002, 20 (4): 353-431. doi: 10.1016/S1367-9120(01)00069-4
[25] Commission for the Geological Map of the World. Geological World Atlas, Scale 1:10000000[M]. Paris: United Nations Educational, Scientific and Cultural Organization, 1975.
[26] Kaars S V D, Kershaw P, Wang X, et al. A Late Quaternary palaeoecological record from the Banda Sea, Indonesia: Patterns of vegetation, climate and biomass burning in Indonesia and northern Australia[J]. Palaeogeography Palaeoclimatology Palaeoecology, 2000, 155: 135-153. doi: 10.1016/S0031-0182(99)00098-X
[27] Mackey D J, O'Sullivan J E O, Watson R J. Iron in the western Pacific: A riverine or hydrothermal source for iron in the Equatorial Undercurrent[J]. Deep-Sea Research Part I, 2002, 49: 877-893. doi: 10.1016/S0967-0637(01)00075-9
[28] Kershaw A P, Kaars S V D, Moss P T. Late Quaternary Milankovitch-scale climatic change and variability and its impact on monsoonal Australasia[J]. Marine Geology, 2003, 201: 81-95. doi: 10.1016/S0025-3227(03)00210-X
[29] Lindstrom E, Lukas R, Fine R, et al. The Western Equatorial Pacific Ocean Circulation study[J]. Nature, 1987, 330: 533-537. doi: 10.1038/330533a0
[30] Tsuchiya M, Lukas R, Fine R, et al. Source waters of the Pacific Equatorial Undercurrent[J]. Progress Oceanography, 1989, 23: 101-147. doi: 10.1016/0079-6611(89)90012-8
[31] Butt J, Lindstrom E. Currents off the East coast of New Ireland, Papua New Guinea, and their relevance to Regional Undercurrents in the Western Equatorial Pacific Ocean[J]. Journal of Geophysical Research Oceans, 1994, 99: 12503-12514. doi: 10.1029/94JC00399
[32] Fine R A, Lukas R, Bingham F M, et al. The Western Equatorial Pacific: A water mass crossroads[J]. Journal of Geophysical Research Oceans, 1994, 99: 25063-25080. doi: 10.1029/94JC02277
[33] Cresswell G R. Coastal currents of northern Papua New Guinea, and the Sepik River outflow[J]. Marine & Freshwater Research, 2000, 51: 553-564. http://www.wanfangdata.com.cn/details/detail.do?_type=perio&id=848e94a7e0c76a9d4637afc3c0b29b1d
[34] Cravatte S, Ganachaud A, Duong Q P, et al. Observed circulation in the Solomon Sea from SADCP data[J]. Progress in Oceanography, 2011, 88: 116-130. doi: 10.1016/j.pocean.2010.12.015
[35] William V Boynton. Cosmochemistry of the Rare Earth Elements: Meteorite Studies[J]. Developments in Geochemistry, 1984, 2: 63-114. doi: 10.1016/B978-0-444-42148-7.50008-3
[36] Taylor S R, McLennan S M. The Continental Crust: Its Composition and Evolution[M]. Blackwell, Malden, 1985:312.
[37] Taylor S R, Mclennan S M. The geochemical evolution of the continental-crust[J]. Reviews of Geophysics, 1995, 33: 241-265. doi: 10.1029/95RG00262
[38] Whitmore G P, Crook K A W, Johnson D P. Grain size control of mineralogy and geochemistry in modern river sediment, New Guinea collision, Papua New Guinea[J]. Sedimentary Geology, 2004, 171: 129-157. doi: 10.1016/j.sedgeo.2004.03.011
[39] Hettler J, Irion G, Lehmann B. Environmental impact of mining waste disposal on a tropical lowland river system: a case study on the Ok Tedi Mine, Papua New Guinea[J]. Mineralium Deposita, 1997, 32: 280-291. doi: 10.1007/s001260050093
[40] Woodhead J D, Johnson R W. Isotopic and trace-element profiles across the New Britain island arc, Papua New Guinea[J]. Contributions to Mineralogy & Petrology, 1993, 113: 479-491. http://cn.bing.com/academic/profile?id=e44ee0a01d9289eb7c96b9fc8724e9e9&encoded=0&v=paper_preview&mkt=zh-cn
[41] Bultitude R J, Johnson R W, Chappell B W. Andesites of Bagana Volcano, Papua New Guinea: Chemical stratigraphy, and a reference andesite composition[J]. Journal of Biomolecular Nmr, 2001, 21 (2). http://cn.bing.com/academic/profile?id=0b81be5f35de9e81a7891c0c5500710d&encoded=0&v=paper_preview&mkt=zh-cn
[42] Wallace D A, Johnson R W, Chappell B W, et al. Cainozoic volcanism of the Tabar, Lihir, Tanga and Feni Islands, Papua New Guinea: Geology, whole-rock analyses, and rock-forming mineral compositions[M]. Bureau Mineral Resources Report 243, Australian Government Publishing Service, 1983: 62.
[43] Kennedy A K, Grove T L, Johnson R W. Experimental and major element constraints on the evolution of lavas from Lihir Island, Papua New Guinea[J]. Contributions to Mineralogy & Petrology, 1990a, 104: 722-734. http://cn.bing.com/academic/profile?id=c678a1d628ae9b01eb347744c2e11a2b&encoded=0&v=paper_preview&mkt=zh-cn
[44] Kennedy A K, Hart S R, Frey F A. Composition and isotopic constraints on the petrogenesis of alkaline arc lavas: Lihir Island, Papua New Guinea[J]. Journal of Geophysical Research Solid Earth, 1990b, 95: 6929-6942. doi: 10.1029/JB095iB05p06929
[45] Gill J B, Morris J D, Johnson R W. Timescale for producing the geochemical signature of island arc magmas: U-Th-Po and Be-B systematics in recent Papua New Guinea lavas[J]. Geochimica et Cosmochimica Acta, 1993, 57: 4269-4283. doi: 10.1016/0016-7037(93)90322-N
[46] Wood C P, Nairn I A, McKee C O, et al. Petrology of the Rabaul Caldera area, Papua New Guinea[J]. Journal of Volcanology and Geothermal Research, 1995, 69: 285-302. doi: 10.1016/0377-0273(95)00034-8
[47] Stracke A, Hegner E. Rifting-related volcanism in an oceanic post-collisional setting: The Tabar-Lihir-Tanga- Feni (TLTF) island chain, Papua New Guinea[J]. Lithos, 1998, 45: 545-560. doi: 10.1016/S0024-4937(98)00049-8
[48] Woodhead J D, Eggins S M, Johnson R W. Magma genesis in the New Britain island arc: Further insights into meltingand mass transfer processes[J]. Journal of Petrology, 1998, 39: 1641-1668. doi: 10.1093/petroj/39.9.1641
[49] Müller D, Franz L, Herzig P M, et al. Potassic igneous rocks from the vicinity of epithermal gold mineralization, Lihir Island, Papua New Guinea[J]. Lithos, 2001, 57: 163-186. doi: 10.1016/S0024-4937(01)00035-4
[50] Pearce, J.A., Parkinson, I.J., 1993. Trace element models for mantle melting: Application to volcanic arc petrogenesis[J]. Magmatic Processes and Plate Tectonics, 1993, 76: 373-403. doi: 10.1144-GSL.SP.1993.076.01.19/
[51] Herzig P, Hannington M, Stoffers P, et al. Volcanism, hydrothermal processes and biological communities at shallow submarine volcanoes of the New Ireland forearc (Papua New Guinea)[R]//Cruise Report SONNE-133, Technische Universitat Bergakademie Freiberg, 1998: 146.
[52] Chadwick J, Perfit M, McInnes B, et al. Arc lavas on both sides of a trench: Slab window effects at the Solomon Islands triple junction, SW Pacific[J]. Earth and Planetary Science Letters, 2009, 279: 293-302. doi: 10.1016/j.epsl.2009.01.001
[53] Heming R F, Rankin P C. Ce-anomalous lavas from Rabaul caldera, Papua New Guinea[J]. Geochimica et Comoschimica Acta, 1979, 43: 1351-1355. doi: 10.1016/0016-7037(79)90125-X
[54] Horz K H, Worthington T J, Winn K, et al. Late Quaternary tephra in the New Ireland Basin, Papua New Guinea[J]. Journal of Volcanology and Geothermal Research, 2004, 132: 73-95. doi: 10.1016/S0377-0273(03)00421-9
[55] Hannigan R E, Sholkovitz E R. The development of middle rare earth element enrichments in freshwaters: weathering of phosphate minerals[J]. Chemical Geology, 2001, 175: 495-508. doi: 10.1016/S0009-2541(00)00355-7
[56] Rollinson. Using Geochemical Data: Evaluation, Presentation Interpretation[M]. Longman Scientific Technical, 1993, 352.
[57] Condie K C, Dengate J, Cullers R L. Behavior of rare earth elements in a paleoweathering profile on granodiorite in the Front Range, Colorado, USA[J]. Geochimica Cosmochimica Acta, 1995, 59: 279-294. doi: 10.1016/0016-7037(94)00280-Y
[58] Sharma A, Rajamani V. Major element, REE and other trace element behavior in amphibolite weathering under semiarid conditions in Southern India[J]. Journal of Geology, 2000, 108: 487-496. doi: 10.1086/314409
[59] Wei G J, Liu Y, Li X H, et al. High-resolution elemental records from the South China Sea and their paleoproductivity implications[J]. Paleoceanography, 2003, 18: 1054-1065. doi: 10.1029-2002PA000826/
[60] Nesbitt H W, Markovics G. Weathering of granodioritic crust, long-term storage of elements in weathering profiles, and petrogenesis of siliciclastic sediments[J]. Geochimica Cosmochimica Acta, 1997, 61 (8): 1653-1670. doi: 10.1016/S0016-7037(97)00031-8
[61] Byrne R H, Kim K H. Rare earth element scavenging in seawater[J]. Geochimica Cosmochimica Acta, 1990, 54 (10): 2645-2656. doi: 10.1016/0016-7037(90)90002-3
[62] Freslon N, Bayon G, Toucanne S, et al. Rare earth elements and neodymium isotopes in sedimentary organic matter[J]. Geochimica Cosmochimica Acta, 2014, 140: 177-198. doi: 10.1016/j.gca.2014.05.016
[63] 吴梦霜, 邵磊, 庞雄等.南海北部深水区沉积物稀土元素特征及其物源指示意义[J].沉积学报, 2012, 30(4): 672-678. http://www.wanfangdata.com.cn/details/detail.do?_type=perio&id=cjxb201204008 WU Mengshuang, SHAO Lei, PANG Xiong, et al. REE geochemical characteristics of sediments and its implications in the deepwater area of the northern South China Sea [J]. Acta Sedimentologica Sinica, 2012, 30 (4): 672-678. http://www.wanfangdata.com.cn/details/detail.do?_type=perio&id=cjxb201204008
[64] Floyd P A, Leveridge B E. Tectonic environment of the Devonian Gramscatho basin, south Cornwall: framework mode and geochemical evidence from turbiditic Sandstones[J]. Journal of the geological society of London, 1987, 144: 531-542. doi: 10.1144/gsjgs.144.4.0531
[65] Nozaki Y, Ohta Y. Rapid and frequent trubidite accumulation in the bottom of Izu-Ogasawwara Trench: chemical and radiochemical evidence[J]. Earth and Planetary Science Letters, 1993, 120: 345-360. doi: 10.1016/0012-821X(93)90249-9
[66] Bhatia M R, Crook K A W. Trace element characteristics of graywackes and tectonic discrimination of sedimentary basins[J]. Contributions to Mineralogy & Petrology, 1986, 92, 181-193. http://cn.bing.com/academic/profile?id=726d14abef54a68355ab0a529dadc6c0&encoded=0&v=paper_preview&mkt=zh-cn
[67] Milliman J D, Syvitski J P M. Geomorphic/Tectonic control of sediment discharge to the ocean: The importance of small mountainous rivers[J]. Journal of Geology, 1992, 100: 525-544. doi: 10.1086/629606
-
期刊类型引用(5)
1. 梁劲,沙志彬,孟苗苗,王笑雪,徐梦婕,方允鑫. 神狐海域高饱和度天然气水合物储层特征及其分布. 地质学报. 2024(09): 2641-2653 .  百度学术
百度学术
2. 路允乾,孟大江,文鹏飞,张宝金. 琼东南盆地北部天然气水合物重点矿体预测及定量评价. 非常规油气. 2023(06): 18-26 . 百度学术
3. 张旭东,尹成,曾凡详,赵斌. 南海北部陆坡聚集流体活动系统及其对天然气水合物成藏的指示意义. 地质通报. 2021(Z1): 280-286 . 百度学术
4. 康玉柱. 中国南海地块天然气水合物成藏条件探讨. 油气藏评价与开发. 2021(05): 659-668 . 百度学术
5. 蔡峰,吴能友,闫桂京,李清,梁杰,孙运宝,董刚,骆迪,李昂,王星星. 海洋浅表层天然气水合物成藏特征. 海洋地质前沿. 2020(09): 73-78 . 百度学术
其他类型引用(1)


计量
- 文章访问数: 3087
- HTML全文浏览量: 735
- PDF下载量: 57
- 被引次数: 6