Holocene sedimentary environment and sea level significance of sedimentogenic Sr/Ba in Fujian tidal bays
-
摘要:
福建沿海多发育潮控型海湾,潮滩平坦宽广,海湾水深较浅,有孔虫等微体生物较为匮乏,且其化石在地层中保存相对较差,致使沉积微相辨识存在一定难度,从而限制了深入理解该区全新世海平面变化过程及沉积环境响应。本研究拟利用不受保存环境限制的沉积成因Sr/Ba指标,探索其在福建宁德三沙湾地区沉积微相的辨识潜力,并结合AMS 14C年龄,探讨该区全新世以来的沉积环境演化及区域海平面变化。结果表明:① 沉积成因Sr/Ba在三沙湾潮滩和海湾表层沉积物中平均值分别为9.06和20.43,具有显著差异。潮滩沉积物中的Sr/Ba明显高于长江等大河口地区(1~3),这是该区淡水输入量较少、潮滩盐度较高所致,这说明该指标辨识海陆过渡沉积相时需要考虑区域水文特点。② 晚第四纪NDGK2钻孔沉积物Sr/Ba自下而上可分为3层(Ⅰ—Ⅲ):层Ⅰ为杂色硬黏土,Sr/Ba比值全孔最低(均值5.29),但也高于淡水环境,推测为前期海相沉积物的暴露改造;层Ⅱ—Ⅲ均为深灰色黏土,其中层Ⅱ均值为10.77,接近潮滩相;层Ⅲ均值为全孔最高(13.44),接近海湾相。结合AMS 14C年龄可知,NDGK2钻孔的河漫滩-潮滩-海湾沉积相演化受控于全新世海平面上升过程,潮滩相形成于约8.9 cal.kaBP,当时该区海平面大约在−21.0±2.5 m,最大海泛面出现于约8.2 cal.kaBP,之后出现了长达6 ka的低沉积速率时期,直至约2.2 cal.kaBP海湾内加速沉积。③ 该区15个钻孔全新统底部Sr/Ba均显现出明显的潮滩相特征,这为重建区域全新世相对海平面提供了可行性。
Abstract:Tidal bays along the Fujian coast lack microorganisms (e.g., foraminifera) and poor fossil preservation, resulting from wide tidal flats and shallow waters. This makes it difficult to rely on the fossils to understand the Holocene sea-level variation course and the sedimentary environment responses in this region. Therefore, this study aims to use the sedimentogenic Sr/Ba ratio index to identify the sedimentary facies in the Sansha Bay, Ningde, Fujian. In addition, AMS 14C dating was done to explore the sedimentary environment evolution and regional sea-level change since the Holocene. The findings revealed that: 1) The mean value of sedimentogenic Sr/Ba ratio in the tidal flats sediments (9.06) is obviously lower than the surface sediments of Sansha Bay (20.43). However, the sedimentogenic Sr/Ba ratio in tidal flat sediments is significantly higher than those of large estuaries such as the Yangtze River estuary (1~3) where lower freshwater input and higher salinity in the tidal flat, suggesting that the regional hydrological characteristics shall be considered when applying the ratio index for examining the sedimentary facies in sea-land transition zones. 2) The sedimentogenic Sr/Ba ratio of Core NDGK2 sediment of the Late Quaternary could be divided into three layers (Ⅰ-Ⅲ). From the bottom, Layer Ⅰ is variegated hard clay, has a Sr/Ba mean value of 5.29, which is still greater than typical freshwater environments, indicating exposure and alteration of older sediments. Layers Ⅱ and Ⅲ consist of dark gray clay, of which Layer Ⅱ has a mean value of 10.77, similar to the tidal flats facies, while Layer Ⅲ has the greatest mean value of the entire core for 13.44, indicating the bay facies. The AMS 14C dates indicate the evolution of the fluvial-tidal flat-bay sedimentary facies in Core NDGK2 was controlled by the Holocene sea-level rise. The tidal flat facies was formed at ~8.9 cal.kaBP when the sea level was at 21.0±2.5 m. The maximum flooding surface appeared at ~8.2 cal.kaBP, followed by a long period of low sedimentation rate for 6 ka, and the sedimentation rate in the bay was accelerated again at ~2.2 cal.kaBP. 3) The sedimentogenic Sr/Ba ratios in all 15 cores at Pleistocene-Holocene boundary in the region show obvious tidal flat facies characteristics, indicating the applicability of sedimentogenic Sr/Ba ratio for reconstructing the Holocene relative sea-level change in the region.
-
Keywords:
- tidal bay /
- sedimentogenic Sr/Ba ratio /
- tidal flat facies /
- sedimentary environments /
- sea-level change /
- Holocene
-
由于全球变暖导致海水体积膨胀和冰盖消融,20世纪50年代以来全球平均海平面加速上升,至21世纪末将上升0.61~1.10 m[1]。由此引发的海岸侵蚀、盐水入侵、内涝等问题,将严重影响人口稠密的海岸带地区的可持续发展[2-4]。地质历史时期海平面变化特征以及海岸带地貌与环境响应,可以为海岸带地区可持续发展预案提供重要借鉴。
伴随第四纪冰期-间冰期气候旋回,全球海平面发生周期性升降变化,致使沿海地区发生大规模海侵与海退[5-6]。我国东南沿海地区最广泛的一期海侵发生在全新世,沿海地区普遍被海水淹没,发育了海相沉积地层[7-8]。20世纪90年代以来,学者利用具有潮位指示意义的海平面标志物(Sea Level Index Point,SLIP),如海滩岩、泥炭、牡蛎礁、贝壳堤等,重建了福建地区全新世相对海平面曲线以及变化特征[9-15]。然而,在早—中全新世全球海平面变化最快的时期,学者重建的福建地区相对海平面曲线之间存在显著差异,这是因为可用于海平面重建的SLIP数据点稀缺所致。福建沿海多为丘陵,地势落差较大,早—中全新世海平面快速上升期间,不易发育全新世基底泥炭[16]。此外,福建沿海多发育潮控型海湾,潮滩平坦宽广,海湾水深较浅,有孔虫等微体生物较为匮乏,且其化石在地层中保存相对较差,致使潮滩等沉积微相辨识存在一定难度[17-21]。SLIP的缺失或辨识难度使得重建的早—中全新世相对海平面变化特征存在很大的不确定性,从而限制了深入理解该区全新世海平面过程及沉积环境响应。
本研究拟选择不受生长与保存环境限制的沉积成因Sr/Ba指标,探索其对福建宁德三沙湾地区沉积微相的辨识潜力,并结合AMS 14C年龄,探讨典型钻孔NDGK2沉积成因Sr/Ba指示的该区全新世以来的沉积环境演化,并进一步检验该指标对于该区15个钻孔全新统底部潮滩相的辨识潜力,拟为重建区域早—中全新世相对海平面提供可行性。
1. 区域概况
宁德三沙湾(图1)地处福建东北部,东濒东海,陆域以丘陵、山地为主,地势起伏较大。年平均气温约20℃,年平均降水量约
1600 mm,属典型的亚热带季风气候[22]。境内发育交溪、霍童溪等短途山溪型河流,年平均径流量分别为40.57亿m3和25.55亿m3 [23-25]。邻近海域主要受到浙闽沿岸流与台湾暖流的影响[26-27]。![]()
三沙湾口小腹大,湾内水域面积714 km2,仅有东南侧东冲水道与外海相连(图1)[28-29]。湾内波浪作用较弱,以潮汐作用为主,平均潮差5.35 m,涨潮历时大于落潮历时,每日纳潮量27×108 m3左右,发育宽广的潮滩[30-31],属于典型的半封闭型强潮海湾。
宁德地区古风化壳之上覆盖着晚第四纪沉积物,为海陆交互沉积,其内发育了1~3层海相深灰色黏土层,分别为晚更新世和全新世高海面时期的产物[21,32-33]。其中,全新世海相地层发育最为广泛,几乎覆盖全域,呈现向海增厚趋势,区内最大沉积厚度可达30 m,其下普遍分布着末次冰盛期形成的杂色硬黏土层[32-33]。
2. 材料与方法
为了探索沉积成因Sr/Ba指标对于沉积微相的指示潜力,采集并收集了三沙湾表层沉积物47个,包括38个潮滩样品和9个海湾样品,同时现场测量了采样点的盐度以及水深(图1b-d)。其中2020年在宁德三沙湾内使用箱式采泥器(0.05 m2)采集并取顶部1 cm厚未受扰动的海湾沉积物样品2个,2024年大潮低潮位期间在宁德金蛇头村附近潮滩使用灰铲采集7.5 cm×7.5 cm表层1 cm厚潮滩沉积物样品31个,均装入透明自封袋,−18℃保存。此外,收集来自孙丹丹等[21]的7个潮滩样品和7个海湾样品相关数据用以补充。
2018年在宁德三沙湾内使用岩芯钻机采集大量第四纪钻孔岩芯样品,其均钻穿至基岩/硬黏土层,取芯率达90%以上,剖样、分样后于−18℃保存。本研究主要聚焦于全新世尺度,因此选取了15个钻孔岩芯中杂色硬黏土层及以上全新统地层作为研究对象,并以沉积厚度较大的NDGK2作为典型钻孔探讨全新世沉积环境演化。其中,NDGK2钻孔7.5~31.9 m段共计43个样品,其余14个钻孔杂色硬黏土层及全新统底部共计120个样品,具体信息见图1b和表1。
表 1 宁德三沙湾钻孔信息与实验样品统计Table 1. Core information and experimental sample statistics of Sansha Bay, Ningde钻孔编号 位置 孔口高程/m 终孔深度/m 全新统底界深度/m 元素分析样品数量 AMS 14C测年样品数量 NDGK1 26.60°N、119.62°E 5.515 85.75 25.65 10 − NDGK2 26.61°N、119.64°E 4.94 95.9 25.8 43 13 NDGK3 26.59°N、119.61°E 4.456 104 25 9 − NDGK6 26.59°N、119.62°E 4.67 78.3 17.3 5 − NDGK7 26.60°N、119.63°E 5.244 75.2 27.6 7 − NDGK9 26.65°N、119.61°E 4.536 37 21.2 8 − NDGK10 26.66°N、119.61°E 4.526 35.2 13.2 10 − NDGK14 26.65°N、119.60°E 4.506 49 18.8 9 − NDGK15 26.73°N、119.62°E 4.856 63.7 9.2 10 − NDGK17 26.73°N、119.63°E 4.032 69.6 7.6 7 − NDGK20 26.74°N、119.63°E 4.819 73.7 24.7 10 − NDGK25 26.76°N、119.57°E 1.306 43.3 12 9 − NDGK28 26.66°N、119.58°E 3.539 49.54 22 9 − NDQK3 26.67°N、119.54°E 4.881 78 11.35 10 − NDQK7 26.73°N、119.57°E 1.305 20 5.35 7 − 注:“−”表示暂未取得AMS 14C测年样品。 上述所有采集的表层以及钻孔岩芯样品均进行了沉积成因Sr、Ba元素分析。并挑选了NDGK2钻孔沉积物中植物残体与较为完整贝壳、螺壳等样品共计13个进行了AMS 14C测年分析,用于建立钻孔年代框架(表1),其中7个AMS 14C年龄数据引自于俊杰等[22]。
(1)加速器质谱(AMS 14C)测年
钻孔岩芯年代采用加速器质谱(AMS 14C)测年方法测定,由西安加速器质谱中心完成。采用软件Cablia 8.1.0对年代数据进行碳库效应校正,其中,植物残体样品采用IntCal 20数据校正集进行校正,贝壳、螺壳等海源样品采用Marine 20数据校正集进行校正[34-35],并取距研究区域最邻近的10个点位的海洋碳库校正平均值Delta-R=−75±42(http://calib.org/marine/)[36],得到距今日历年龄(表2)。
表 2 宁德三沙湾NDGK2钻孔AMS 14C测年结果Table 2. AMS 14C dating results of Core NDGK2 in Sansha Bay, Ningde序号 样品编号 测年材料 取样深度/m 14C年龄/aBP (1σ) Calib Rev 8.1.0校正年龄/cal.aBP (2σ) 1 NDGK2 14C-1 植物残体 8.0 580±20 586±46 2 NDGK2-6 碳化植物残体 9.9 1096 ±131006 ±503 NDGK2-12 碳化植物残体 12.8 2689 ±132801 ±45*4 NDGK2-14 碳化植物残体 14.3 2264 ±132260 ±80*5 NDGK2 14C-2 完整螺壳 14.7 4580 ±204676 ±179*6 NDGK2-21 碳化植物残体 18.6 1976±13 1906±38 7 NDGK2 14C-3 碳化植物残体 20.9 2230 ±202241 ±888 NDGK2-27 完整螺壳 22.8 7874 ±178226 ±1589 NDGK2 14C-4 片状贝壳碎屑 24.9 8195 ±258606 ±20610 NDGK2 14C-5 贝壳碎屑 25.75 8225 ±258650 ±21711 NDGK2 14C-5-2 碳化植物残体 25.75 7995 ±258879 ±11912 NDGK2-40 植物残体 25.8 12751 ±4115203 ±14413 NDGK2 14C-6 碳化植物残体 31.85 14450 ±3517623 ±208注:序号1、5、7、9—11、13的14C年龄数据引自于俊杰等[22],*代表年龄倒置,计算年龄所用14C半衰期为 5568 年。(2)沉积成因Sr、Ba元素分析
沉积成因Sr、Ba元素分析的预处理与检测均在华东师范大学河口海岸学国家重点实验室完成,主要处理步骤参照王爱华等[37]、Wang 等[38]。具体如下:① 称取2 g左右样品低温冻干48 h,干燥后于研钵中仔细研磨,并剔除贝壳、植物碎屑等杂质;② 称取1.5 g左右已研磨样,置于100 mL洁净离心管中,加入75 mL 50 %的 CH3COOH溶液,轻微摇晃令样品与醋酸充分混匀;③ 30℃水温超声震荡1 h,并静置10~12 h以充分反应;④ 于离心机
4000 r/min离心10 min;⑤ 吸取50 mL上清液于蒸发皿中,在160℃加热板上加热4 h左右,待蒸发皿中仅剩橘红色固体时,停止加热;⑥ 5‰ 的HNO3溶液溶解蒸发皿中固体,并转移至50 mL洁净离心管中称量定容至50 g左右,4℃冰箱保存;⑦ 稀释20倍后,采用电感耦合等离子体质谱仪(ICP-MS 350)进行Sr、Ba元素含量检测,回收率102.2 %左右。3. 结果
3.1 宁德三沙湾表层沉积物沉积成因Sr、Ba元素特征
宁德三沙湾潮滩表层沉积物中Sr含量均值28.42 μg/g,Ba含量均值3.20 μg/g,Sr/Ba均值9.06,整体在7.37~12.38之间波动(表3)。海湾表层沉积物中Sr含量均值39.01 μg/g、Ba含量均值2.02 μg/g、Sr/Ba均值20.43,整体在10.35~33.62之间波动(表3)。可见,海湾沉积物中的沉积成因Sr/Ba比值远高于潮滩沉积物。从其表层空间分布来看,Sr含量、Sr/Ba比值总体呈现由湾顶向湾口、由河口向海湾逐渐增大趋势,Ba含量在受河流影响处显著增高。
表 3 宁德三沙湾现代表层沉积物沉积成因Sr、Ba元素特征Table 3. Characteristics of sedimentogenic Sr and Ba elements of modern surface sediments in Sansha Bay, Ningde样品位置 统计特征 Sr/(μg/g) Ba/(μg/g) Sr/Ba 潮滩 最小值 10.74 0.87 7.37 最大值 34.39 4.07 12.38 平均值 28.42 3.20 9.06 变异系数 0.20 0.24 0.10 海湾 最小值 26.95 1.57 10.35 最大值 57.82 2.71 33.62 平均值 39.01 2.02 20.43 变异系数 0.29 0.21 0.41 3.2 NDGK2钻孔年代地层
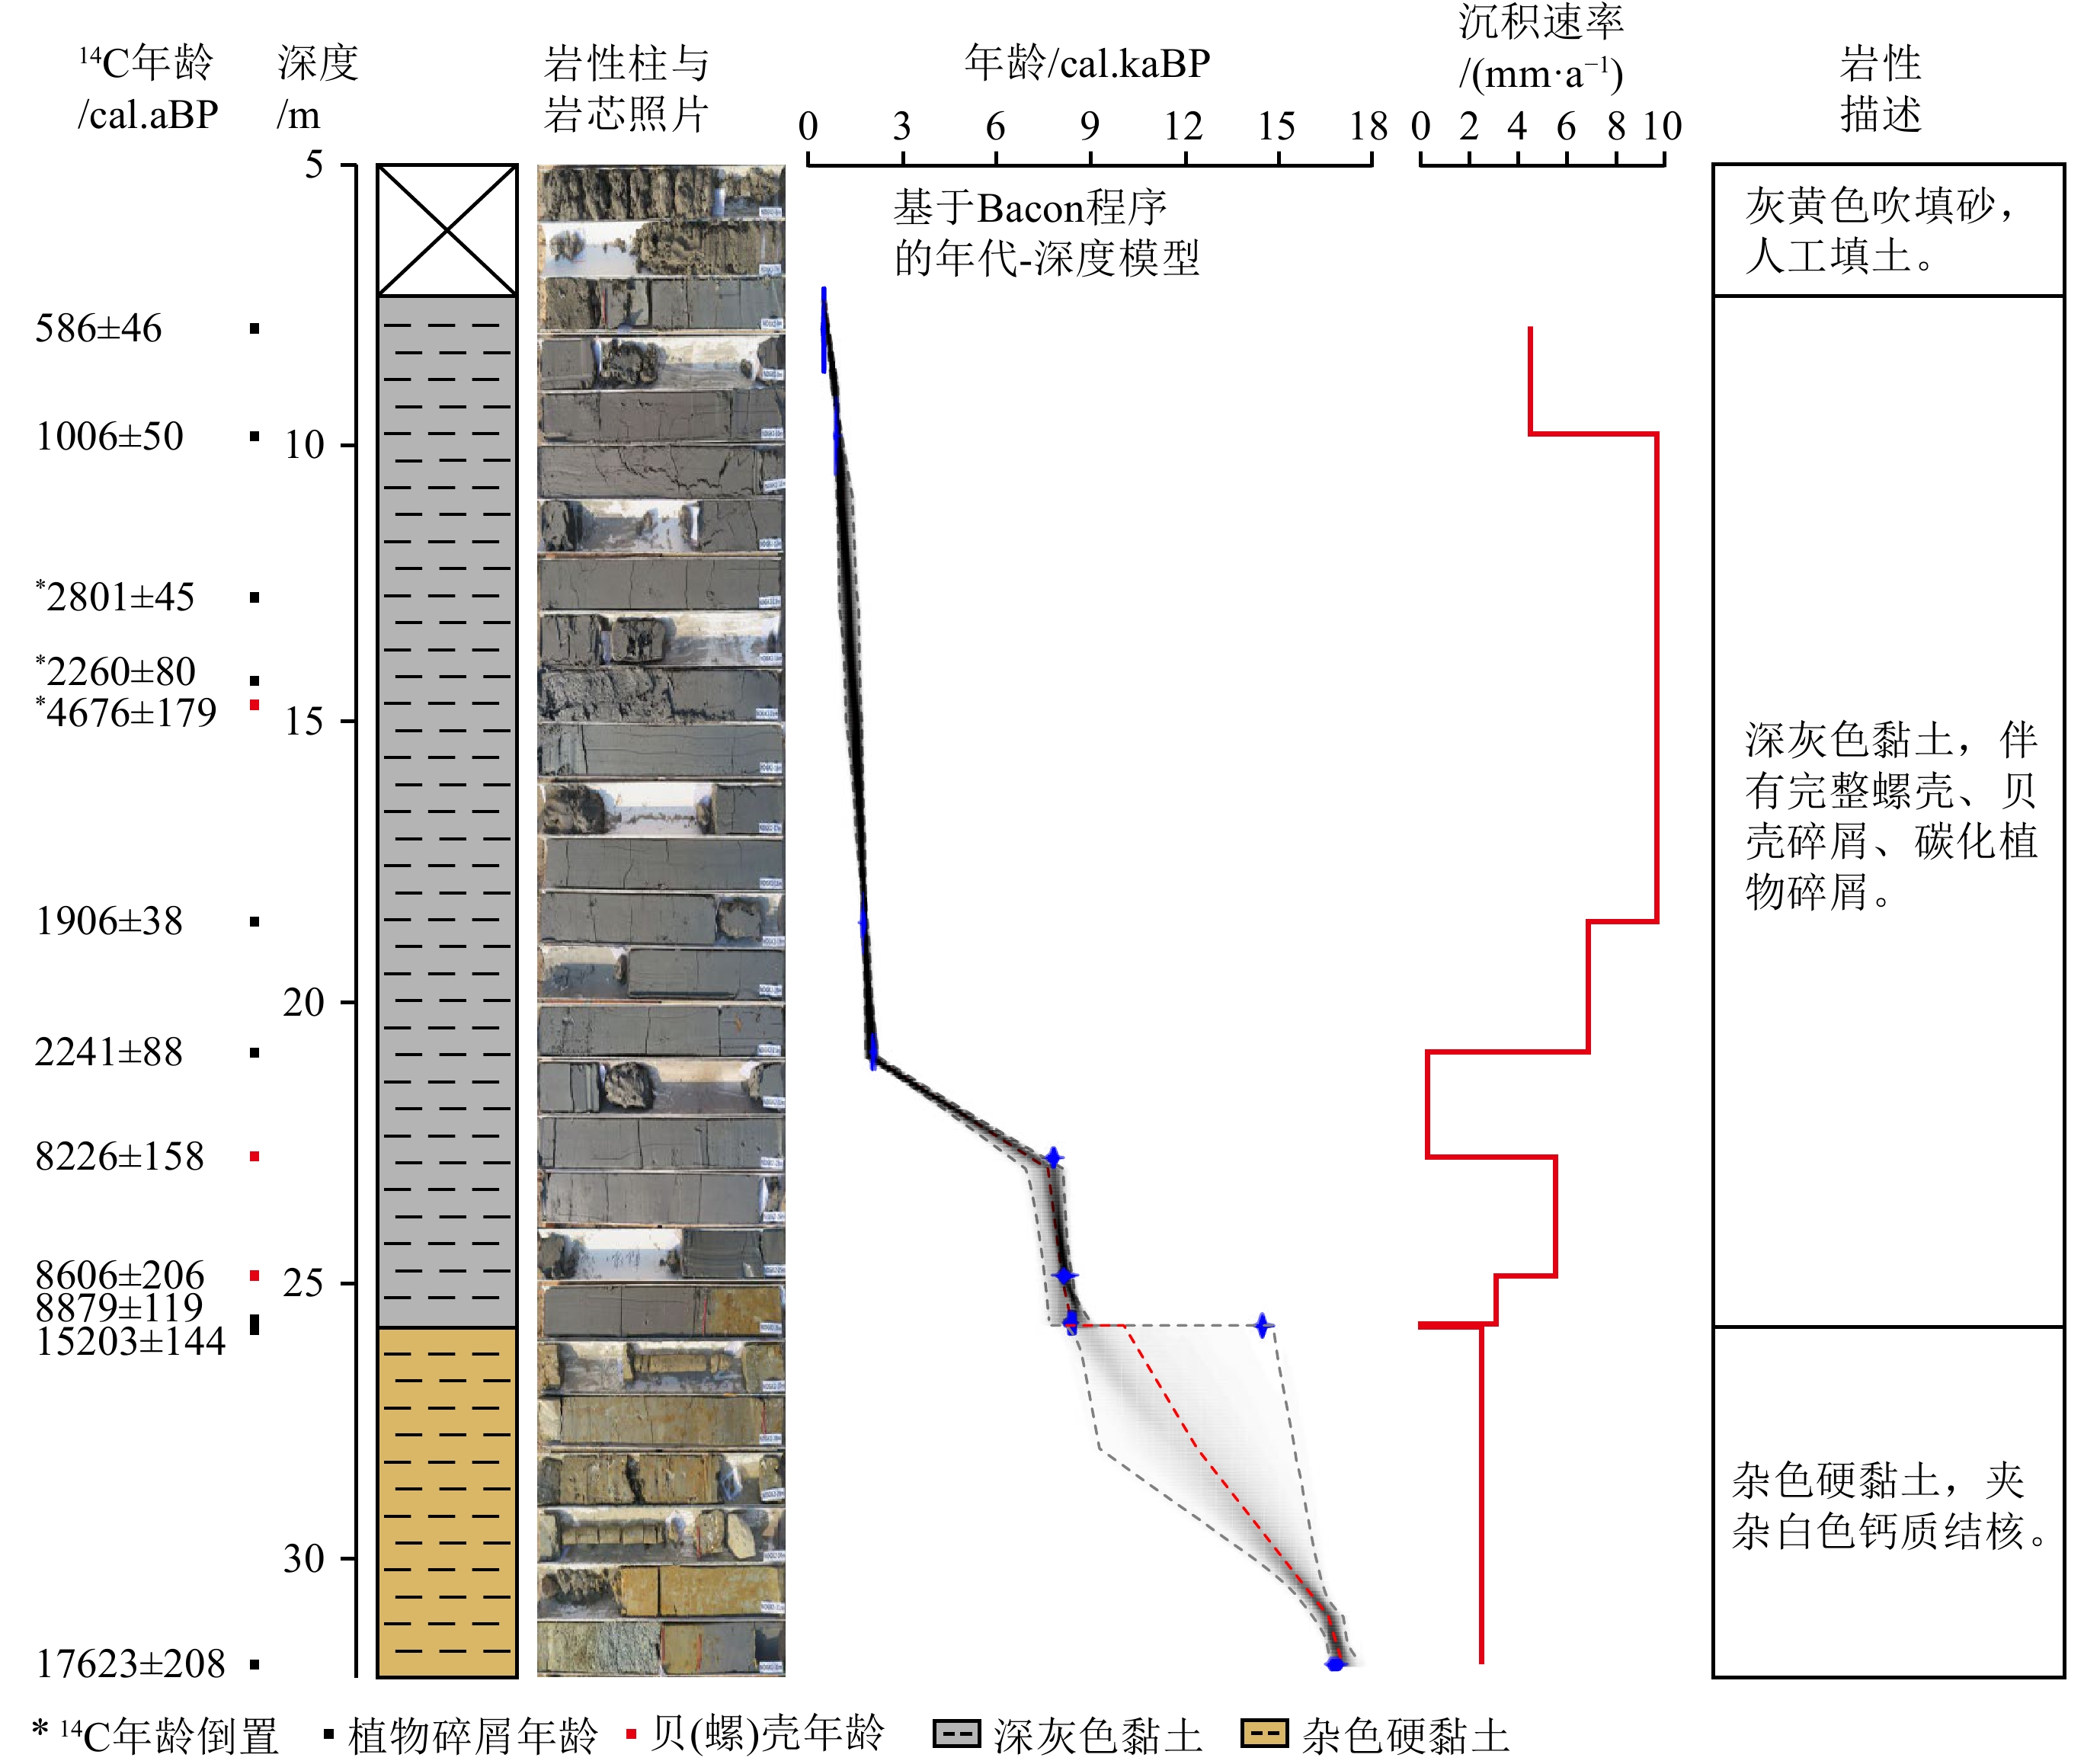
NDGK2钻孔岩性以25.8 m为界,下部为杂色硬黏土,质硬,偶见白色结核;上部为均质深灰色淤泥质黏土,质软,含贝壳碎屑和植物残体(图2)。AMS 14C年龄结果显示,31.9~25.8 m杂色硬黏土形成于晚更新世末期17.6~15.2 cal.kaBP;25.8 m以上深灰色黏土形成于全新世8.9 cal.kaBP以来(图2)。受此前测年材料层位的限制,于俊杰等[22]测年显示14.7、20.9 m处出现明显年龄倒置(表2,序号5、7),为进一步确立NDGK2钻孔年代框架,本研究在9.9~20.9 m区间加密挑选受外源输入影响较弱的植物残体样品进行AMS 14C测年(表2,序号2—4、6),结果表明20.9 m以上普遍为晚全新世2.8 cal.kaBP以来形成的沉积,这也证实14.7 m海源螺壳样品测年结果显著偏老,可能是潮汐从其他地区带来的螺壳干扰所致。12.8、14.3、14.7 m出现年龄倒置,这些年龄不参与年代框架建立(图2)。
![]() 图 2 宁德三沙湾NDGK2钻孔年代地层与沉积特征Figure 2. Chrono-stratigraphy and depositional characteristics of Core NDGK2 in Sansha Bay, Ningde
图 2 宁德三沙湾NDGK2钻孔年代地层与沉积特征Figure 2. Chrono-stratigraphy and depositional characteristics of Core NDGK2 in Sansha Bay, Ningde基于Bacon程序建立的NDGK2钻孔岩芯年代-深度模型和沉积速率结果显示,高沉积速率发生于早全新世8.9~8.2和2.2 cal.kaBP以来,最高可达5.53和9.67 mm/a;而15.2~8.9和8.2~2.2 cal.kaBP 沉积速率极低,几乎出现沉积间断(图2)。
3.3 NDGK2钻孔沉积成因Sr、Ba元素特征
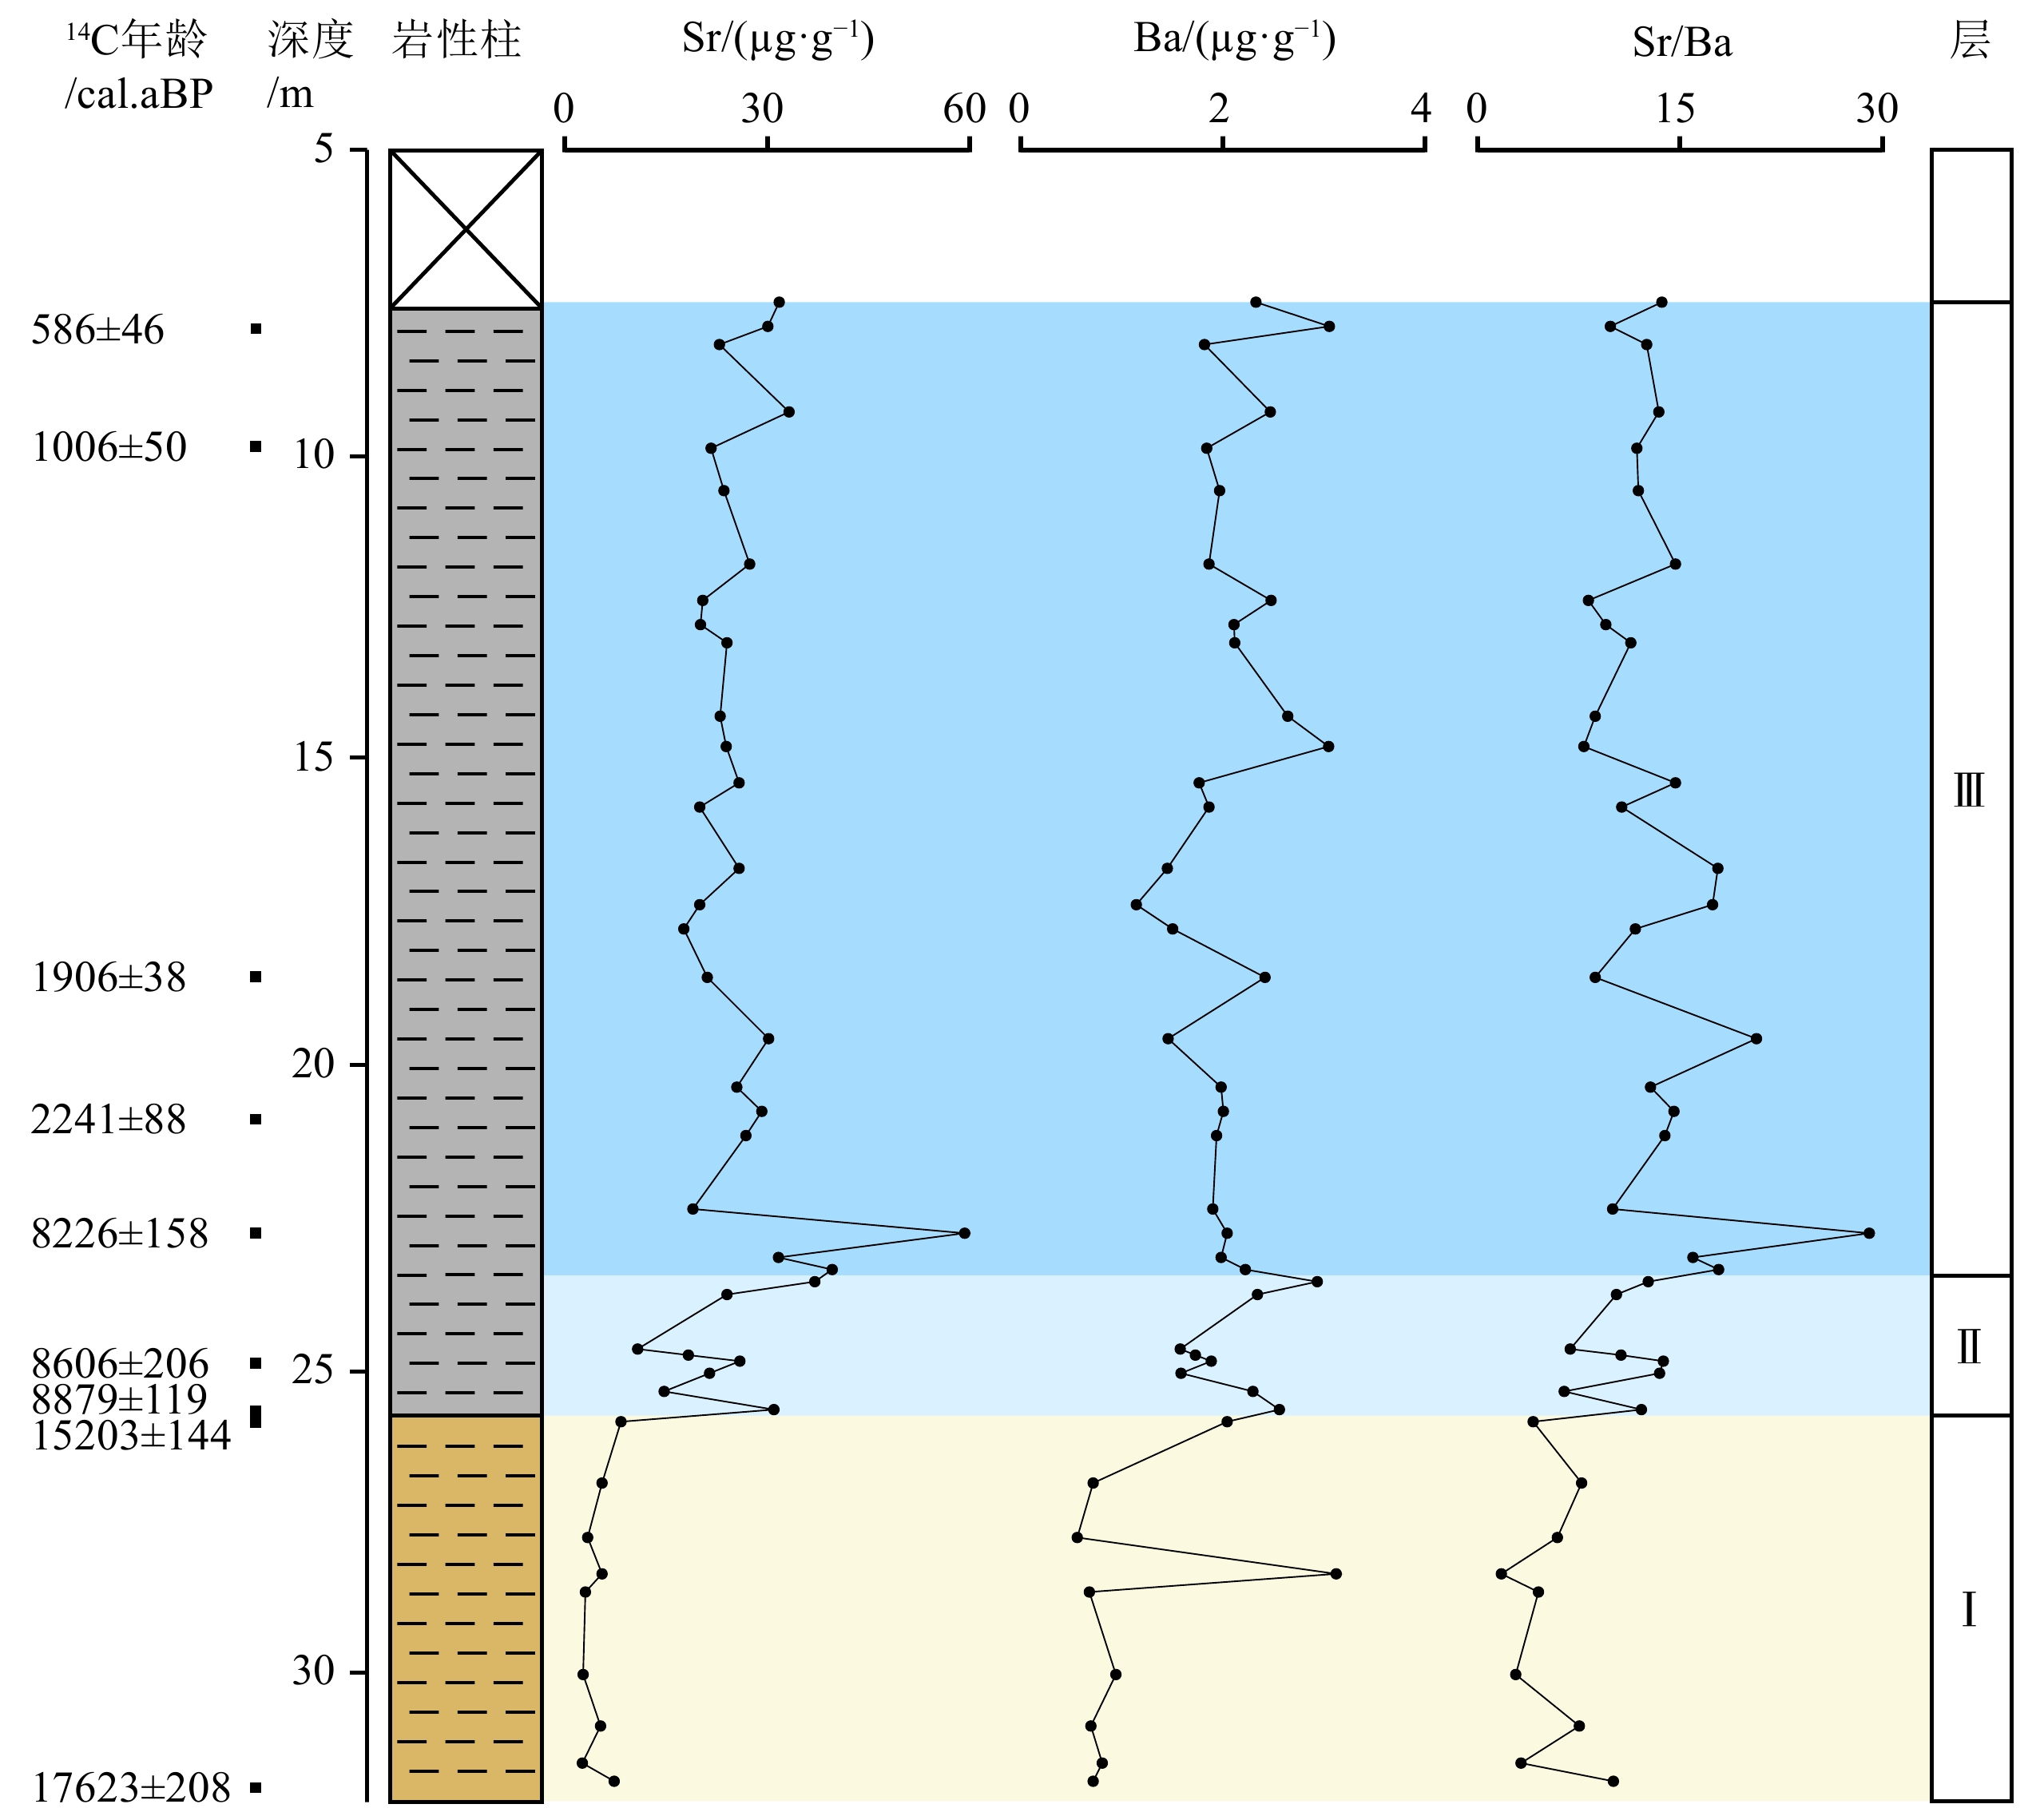
NDGK2钻孔沉积物中沉积成因Sr、Ba元素含量与Sr/Ba比值垂向变化明显,自下而上可分为3层(图3):
![]() 图 3 宁德三沙湾NDGK2钻孔沉积成因Sr、Ba元素特征岩性柱图例同图2。Figure 3. Characteristics of sedimentogenic Sr and Ba in the Core NDGK2 in Sansha Bay, NingdeLegends are the same as Fig. 2.
图 3 宁德三沙湾NDGK2钻孔沉积成因Sr、Ba元素特征岩性柱图例同图2。Figure 3. Characteristics of sedimentogenic Sr and Ba in the Core NDGK2 in Sansha Bay, NingdeLegends are the same as Fig. 2.层Ⅰ(31.9~25.8 m):Sr、Ba含量均较低,均值为4.84和1.14 μg/g。Sr/Ba均值为5.29(1.77~7.70),为全孔最低值。
层Ⅱ(25.8~23.5 m):Sr、Ba含量相较层Ⅰ显著增加,均值为22.93和2.11 μg/g。Sr/Ba均值为10.77(6.40~13.75),远远大于1。
层Ⅲ(23.5~7.5 m):Sr、Ba含量均较高,均值为26.70和2.06 μg/g。Sr/Ba均值为13.44(7.87~29.07),远远大于1,同时相较层Ⅱ亦有较为明显增加,为全孔最高值。
3.4 宁德钻孔全新统底部沉积成因Sr、Ba元素特征
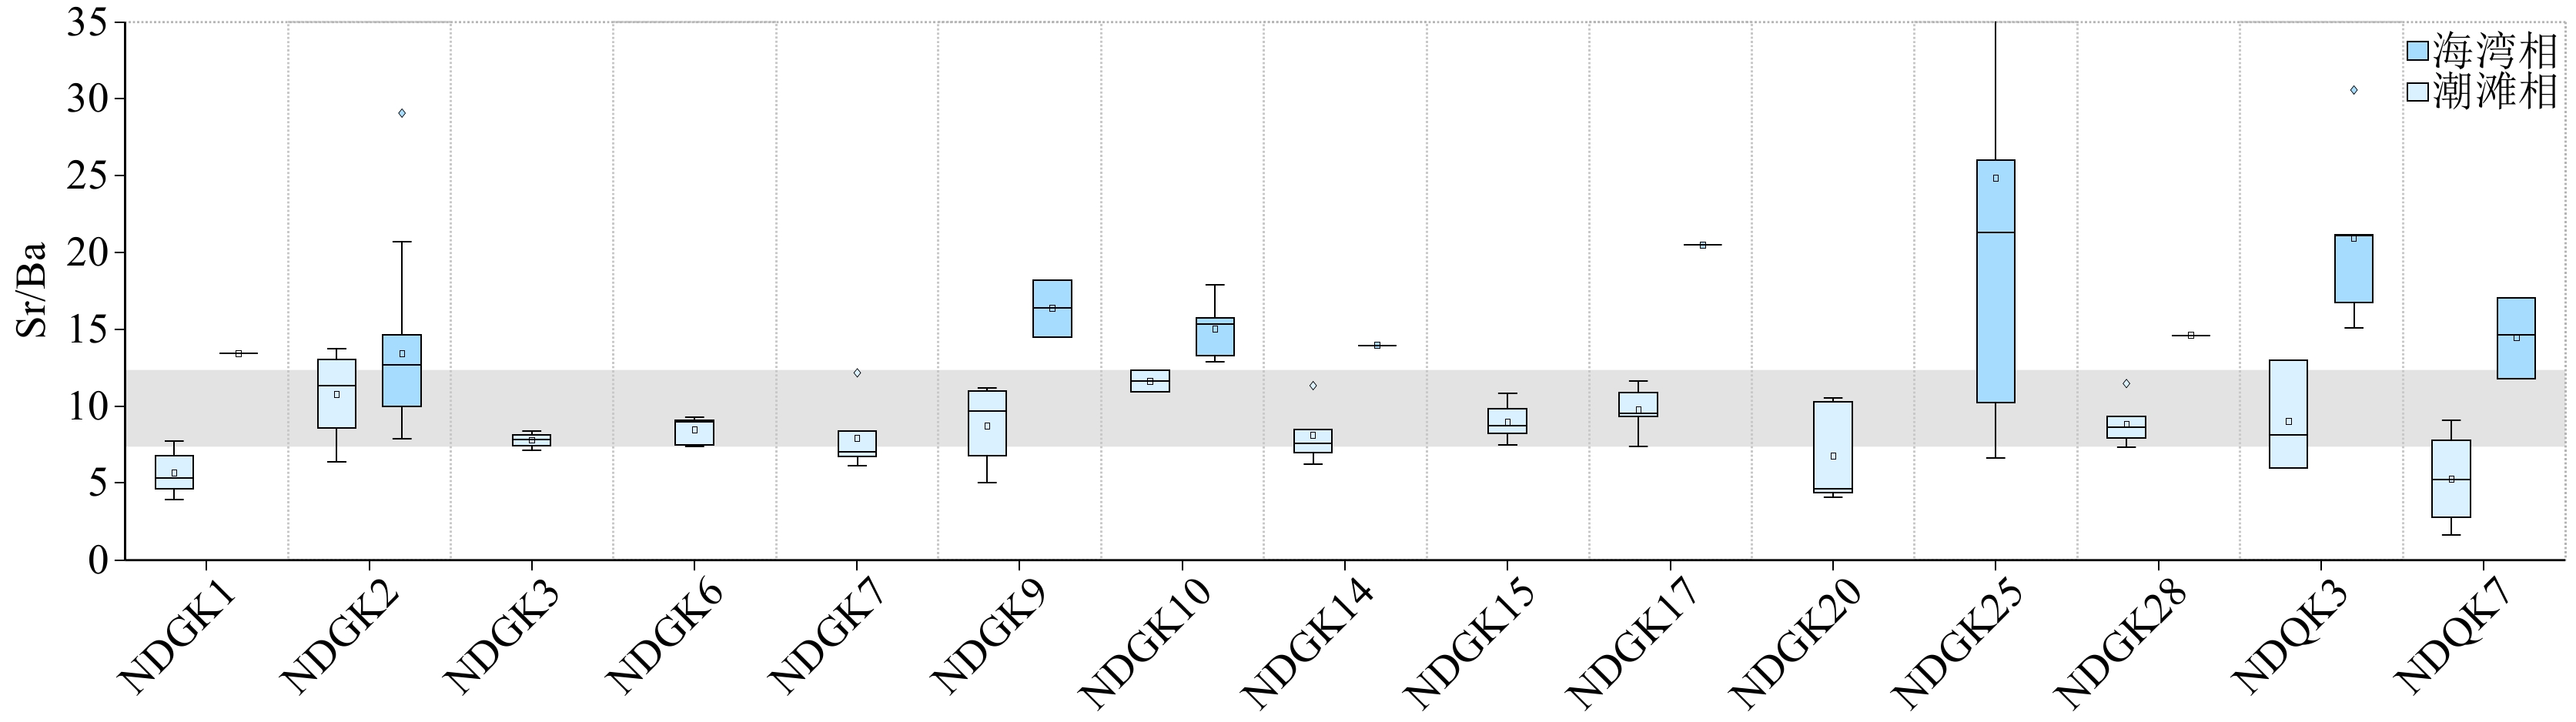
宁德三沙湾14个钻孔全新统底部沉积成因Sr、Ba元素含量及Sr/Ba变化特征与NDGK2钻孔对应层位较为相似,再结合现代潮滩和海湾表层样品Sr/Ba差异,自下而上也将其划分为3层(Ⅰ—Ⅲ),如图3所示。层Ⅰ岩性多呈杂色硬黏土,偶见卵石,Sr/Ba比值整体处于低值,但是大于1。层Ⅱ和层Ⅲ岩性均为深灰色黏土,层Ⅱ的Sr/Ba比值基本在10以内,而层III大多高于12(图4)。
![]() 图 4 宁德钻孔全新统底部沉积成因Sr、Ba元素特征Figure 4. Characteristics of sedimentogenic Sr and Ba in the cores at the Pleistocene-Holocene boundary in Ningde region
图 4 宁德钻孔全新统底部沉积成因Sr、Ba元素特征Figure 4. Characteristics of sedimentogenic Sr and Ba in the cores at the Pleistocene-Holocene boundary in Ningde region4. 讨论
4.1 沉积成因Sr/Ba对福建潮控海湾沉积微相的辨识潜力
Sr和Ba元素均为碱土金属元素,化学性质相似,但其地球化学行为却存在巨大差异。首先,沉积物中黏土矿物、胶体和有机质对Sr和Ba的吸附能力不同,河流陆源碎屑沉积物对Ba的吸附能力明显强于Sr,并且伴随河流入海,被吸附的Ba被迅速释放至水体,沉积物中可交换态Ba含量下降,Sr主要被输送至海洋环境中。其次,Ba受化学、生物过程影响更易在河口处析出BaSO4沉淀,Sr流动性更强不易形成沉淀而在海水中富集。同时,Sr在海洋沉积物生物碳酸盐壳体中的富集能力强于Ba,海洋沉积物中碳酸盐结合态Sr含量较高,这使得海相沉积物富Sr贫Ba,因此Sr/Ba比值>1经常被用作辨识海相沉积环境的指标[39-41]。然而,这一指标在中国沿海地区第四纪钻孔中的沉积相识别的应用效果并不理想,其归因于沉积物全岩组分全量Sr/Ba对沉积环境不敏感。由于中国东部河流携带了大量陆源碎屑硅酸盐矿物入海,致使全岩组分Sr、Ba含量很高,其中仅代表碎屑沉积物物源特征和水动力条件,与沉积过程中发生的地球化学环境变化无关的硅酸盐矿物(诸如长石、角闪石等)中残渣态Sr、Ba含量分别占Sr、Ba全量的50%和80%以上,极易掩盖沉积环境导致的Sr/Ba变化[38,42-43]。因此,在探究沉积环境演化时必须排除来自陆源碎屑硅酸盐矿物的非沉积成因组分。
前人研究表明,醋酸对碳酸盐具有足够的消解能力,但是无法消解赋存于陆源碎屑硅酸盐矿物中的金属元素[44-45],因而利用醋酸提取法只能分离沉积物中的沉积成因组分,即可交换态(即被黏土矿物、胶体和有机质吸附)和碳酸盐结合态(主要是与钙质生物壳体结合)元素[38,46],无法提取非沉积成因组分,即残渣态(来自陆源碎屑硅酸盐矿物)元素。醋酸提取的沉积成因Sr/Ba对海陆过渡相环境变化最为敏感,既可通过规避陆源碎屑硅酸盐矿物干扰,有效排除沉积物的物源变化或贡献,又可消除沉积物元素粒级效应影响[37-38,47]。
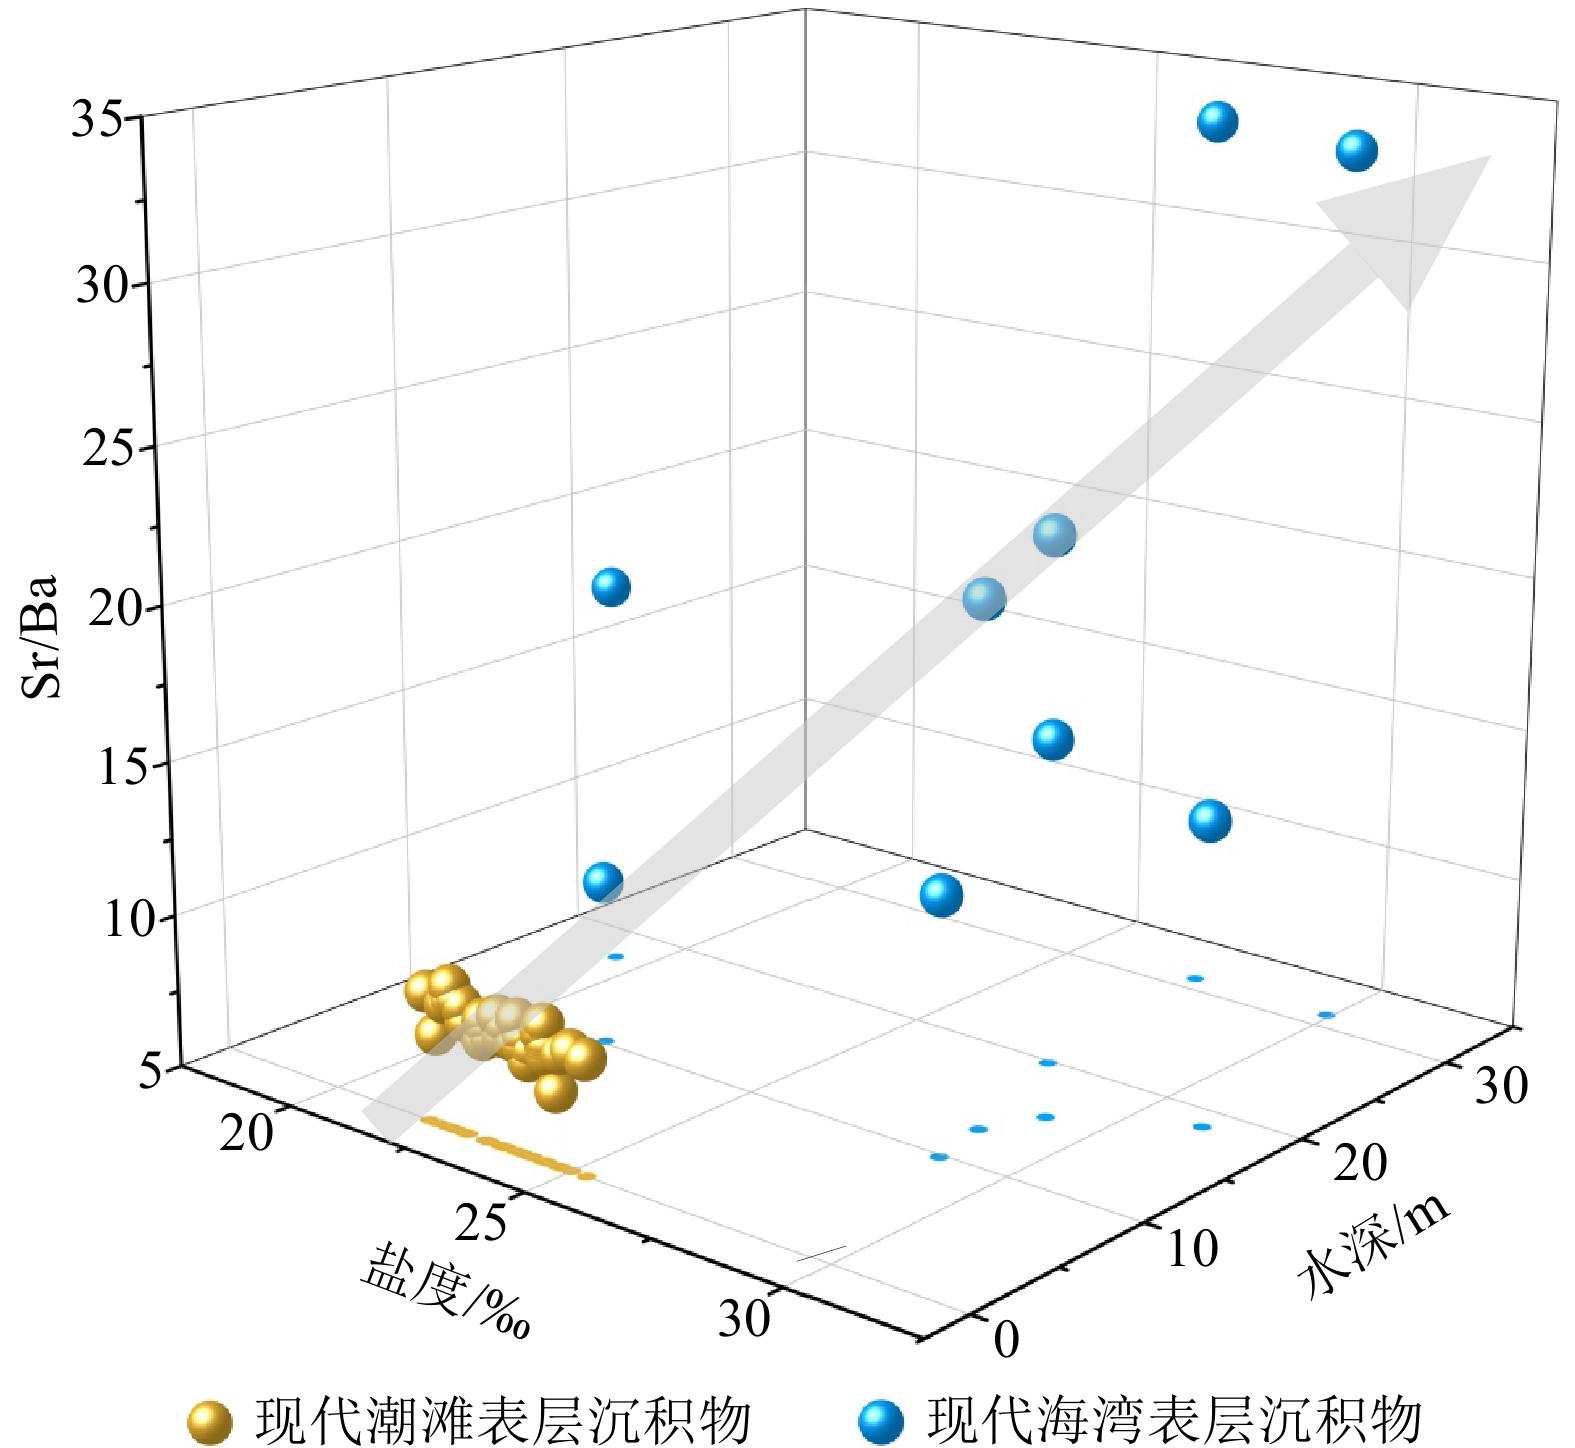
宁德三沙湾现代潮滩和海湾表层沉积物沉积成因Sr/Ba的均值分别为9.06和20.43,均远大于1,与其海水环境相符(表3、图5)。沉积成因Sr/Ba在潮滩和海湾环境间的差异显著,具有有效区分度,且随着盐度以及水深的增大而增加,尤其和水深具有较强的正相关性,表明由陆向海淡水影响不断减弱(图5)[38,48]。值得注意的是,三沙湾潮滩的沉积成因Sr/Ba比值也可达7.37~12.38,而长江、黄河等大河三角洲地区仅为1~3[37-38,40],两者相差甚远,这主要归因于三沙湾河流淡水输入较少、受到海洋影响较大、潮滩盐度较高(均值23.66‰,图5),这与前人研究表明的沉积成因Sr/Ba比值与盐度呈较强的正相关吻合[38]。
![]() 图 5 宁德三沙湾表层沉积物沉积成因Sr/Ba及影响因素Figure 5. Sedimentogenic Sr/Ba ratio of surface sediments in Sansha Bay, Ningde, and the influencing factors
图 5 宁德三沙湾表层沉积物沉积成因Sr/Ba及影响因素Figure 5. Sedimentogenic Sr/Ba ratio of surface sediments in Sansha Bay, Ningde, and the influencing factors三沙湾交溪、霍童溪等短途山溪型河流淡水输入量(年平均径流量40.57亿m3、25.55亿m3)远小于长江、黄河等大河流域(年平均径流量
9600 亿m3、580亿m3),致使三沙湾潮滩盐度远高于长江等大河三角洲地区盐度(<5‰)。较高浓度的阳离子(诸如Na+、Mg2+、K+和Ca2+)不利于沉积物对Ba的吸附[49-50],当环境盐度较高时,Ba更易被释放至水体中[37-38],致使三沙湾潮滩沉积物中可交换态Ba含量减小,沉积成因Sr/Ba显著偏高。因此,利用沉积成因Sr/Ba辨识海陆过渡沉积微相时,需要充分考虑区域水文特征对其比值的影响。4.2 沉积成因Sr/Ba指示的福建三沙湾全新世沉积环境演化
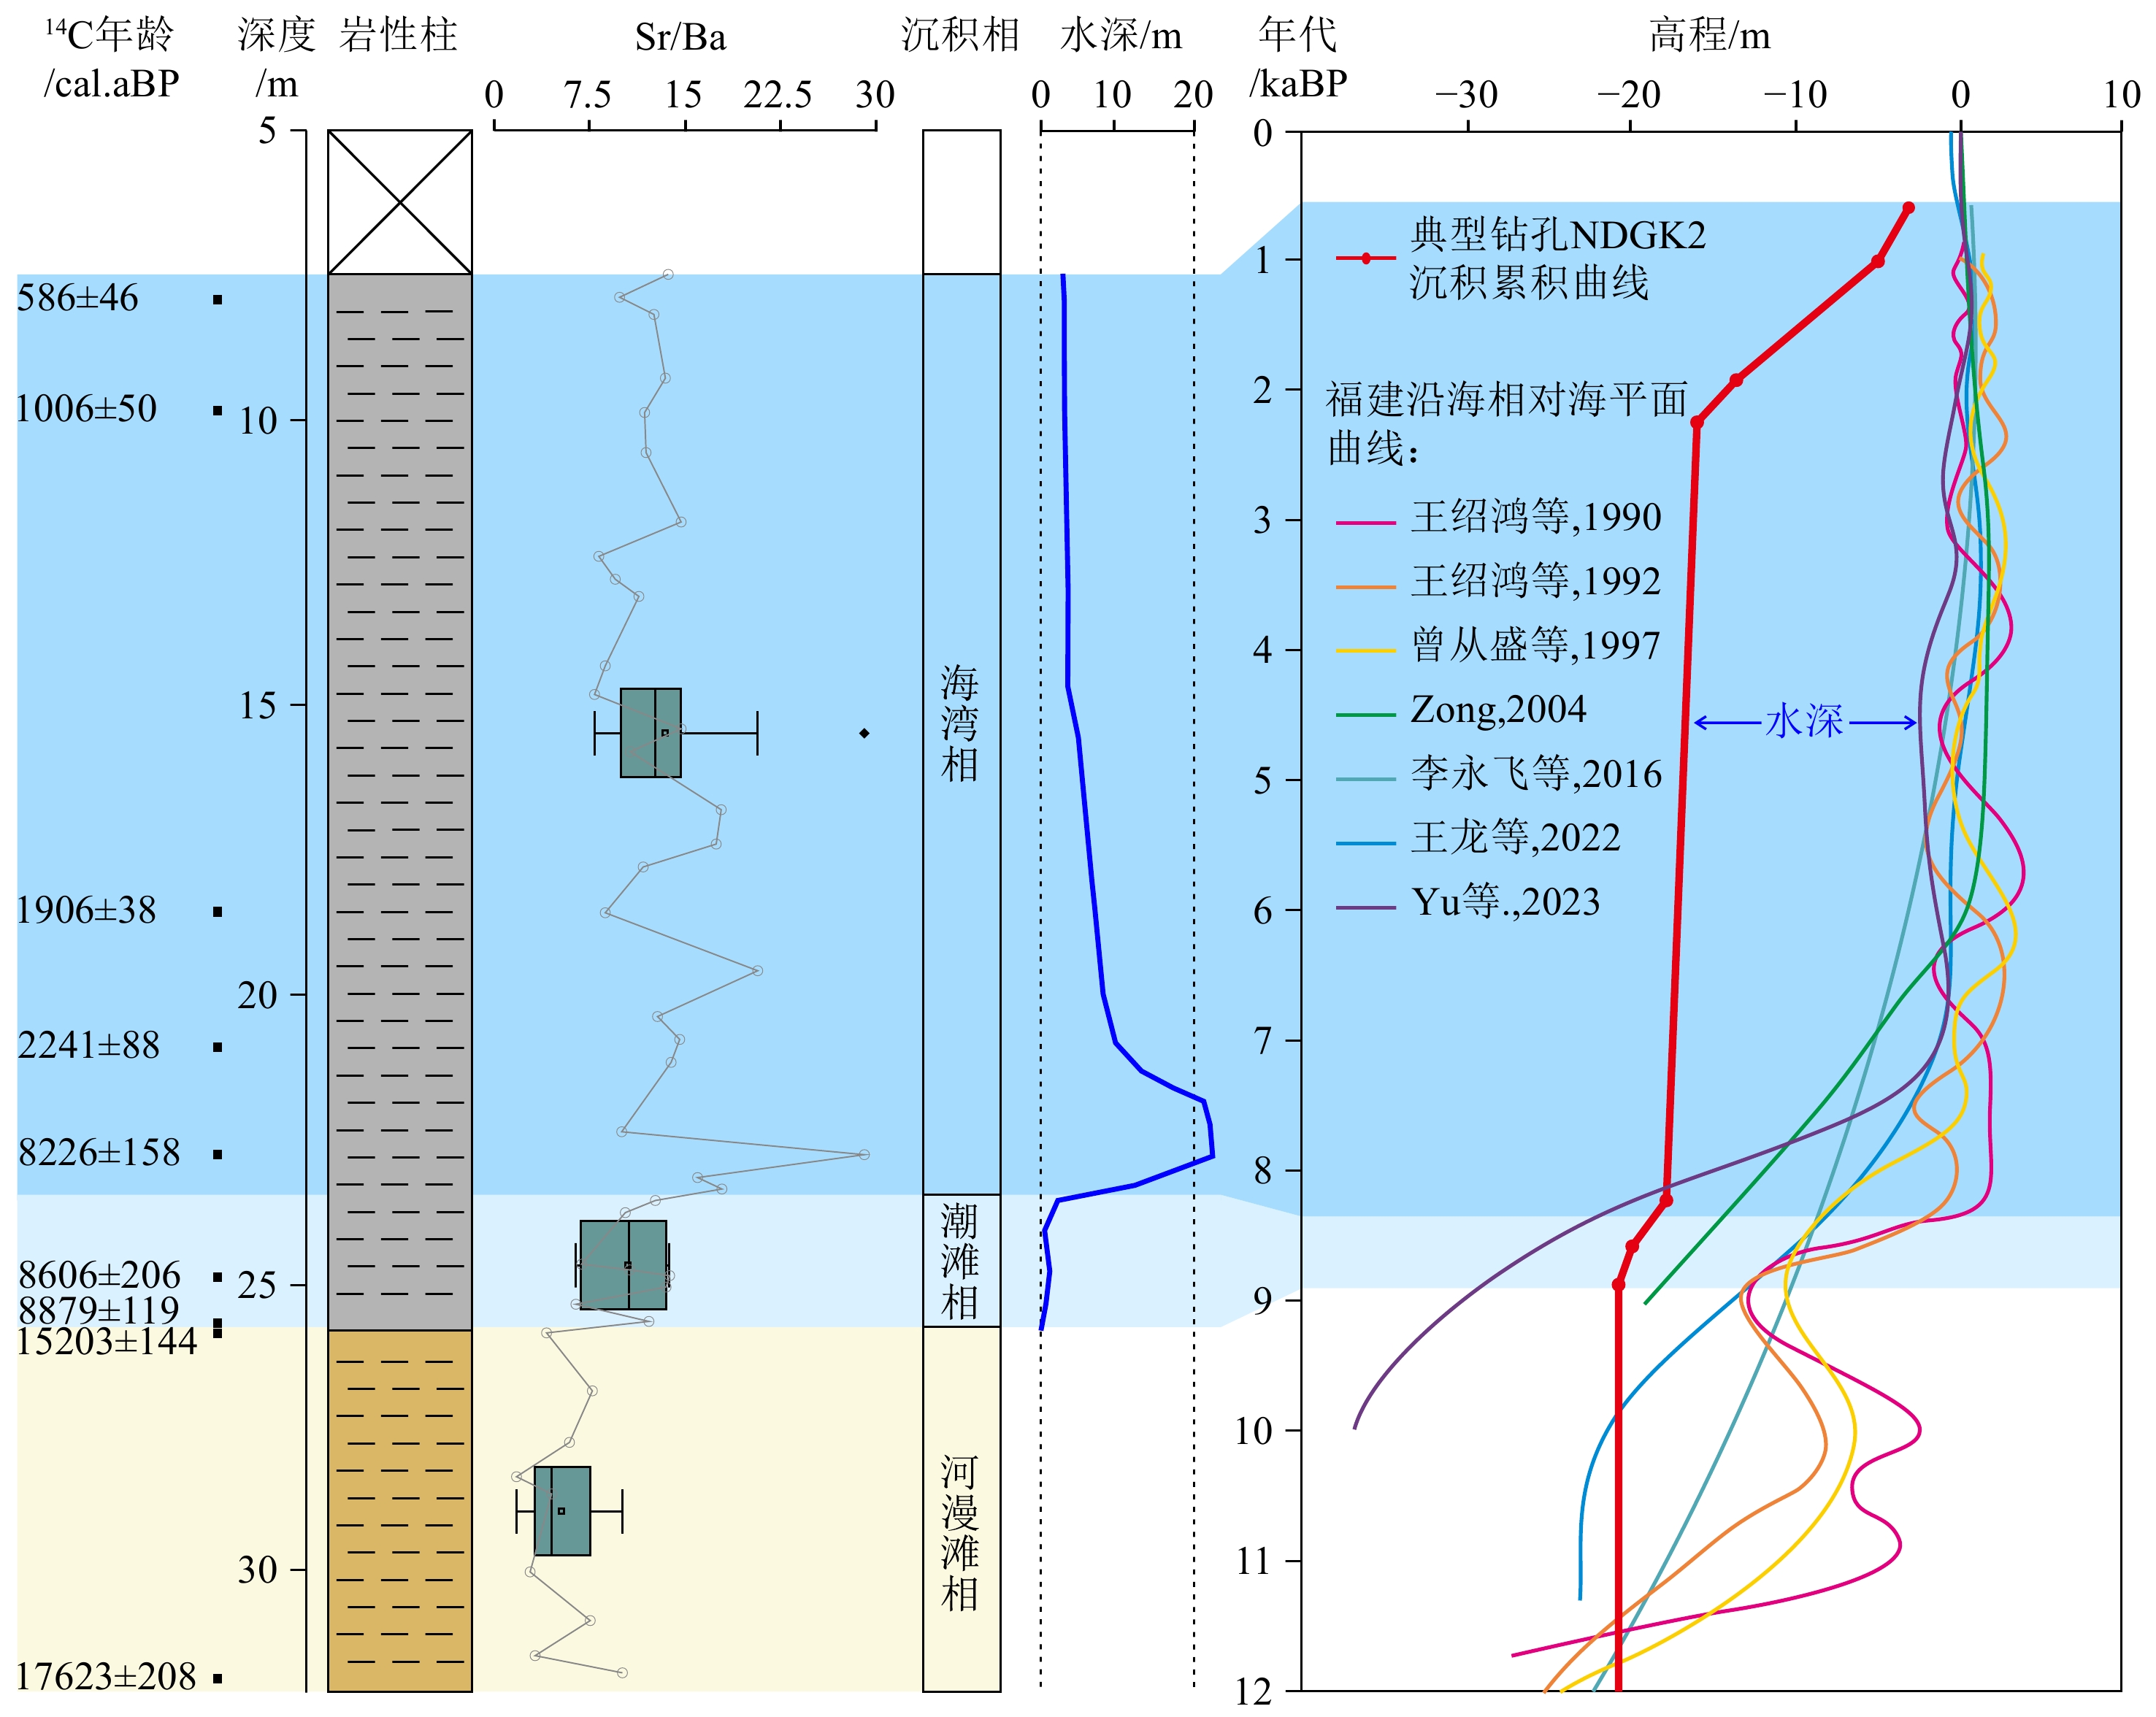
以三沙湾现代潮滩和海湾沉积成因Sr/Ba为参考,结合AMS 14C年龄,NDGK2钻孔沉积成因Sr/Ba揭示了该区晚更新世末期以来河漫滩-潮滩-海湾沉积环境演化序列受控于海平面上升过程(图6)。晚更新世末期,海平面还处于低位,该区普遍暴露,15.2~8.9 cal.kaBP间的沉积间断也说明该区物源匮乏,发育的杂色硬黏土Sr/Ba高于1(图6),说明其很可能是由前期海相沉积母质暴露地表改造而成,同期在长江、珠江三角洲也普遍存在这种现象[51-52]。进入全新世,随着海平面快速上升至逐渐稳定,海水对该区的影响不断增强,Sr/Ba揭示NDGK2钻孔附近在8.9~8.4 cal.kaBP开始受海水影响,发育潮滩,之后水深加大,转变为海湾环境(图6)[9-15]。NDGK2钻孔潮滩相的发现,指示8.9 cal.kaBP该区海平面位置大约在−21.0±2.5 m(仅考虑潮差的影响,计算参照Xiong 等[53]、Yu 等15],图6)。Sr/Ba最大值出现在约8.2 cal.kaBP,指示区域海平面此时可能达到高位,这与该区NDQK5钻孔的介形类记录较为一致[54]。此外,NDGK2钻孔记录的8.2~2.2 cal.kaBP低沉积速率很可能和该区物源来源有关,需要今后的进一步工作来解释。
![]() 图 6 沉积成因Sr/Ba指示的NDGK2钻孔全新世沉积环境演化岩性柱图例同图2。Figure 6. Holocene sedimentary environment evolution of Core NDGK2 indicated by sedimentogenic Sr/Ba ratioLegends are the same as in Fig. 2.
图 6 沉积成因Sr/Ba指示的NDGK2钻孔全新世沉积环境演化岩性柱图例同图2。Figure 6. Holocene sedimentary environment evolution of Core NDGK2 indicated by sedimentogenic Sr/Ba ratioLegends are the same as in Fig. 2.4.3 福建潮控海湾全新统底部潮滩相沉积地层辨识的意义
宁德三沙湾其余14个钻孔全新统底界附近沉积成因Sr/Ba垂向变化和NDGK2钻孔非常相似,其中,晚更新世末期杂色硬黏土(砾石)之上普遍存在着一层Sr/Ba比值和现代潮滩环境接近的沉积物,这说明随着全新世海平面快速上升该区域普遍发育潮滩相(图7)。
![]() 图 7 沉积成因Sr/Ba揭示的宁德三沙湾全新统底部潮滩相灰色阴影表示现代潮滩参考范围。Figure 7. Tidal flat facies during the Early Holocene in Sansha Bay, Ningde, revealed by sedimentogenic Sr/Ba ratioGray shading indicates modern tidal flats reference range.
图 7 沉积成因Sr/Ba揭示的宁德三沙湾全新统底部潮滩相灰色阴影表示现代潮滩参考范围。Figure 7. Tidal flat facies during the Early Holocene in Sansha Bay, Ningde, revealed by sedimentogenic Sr/Ba ratioGray shading indicates modern tidal flats reference range.全新世区域相对海平面变化一直是海陆相互作用中关注的焦点问题,其对沿海区域地貌和环境变化至关重要。20世纪90年代起,以各类具有海平面指示意义的生物遗迹、地质、地貌等作为标志物(SLIP),学者们探讨了福建沿海全新世相对海平面波动特征,并且重建数条相对海平面变化曲线(图6)[9-15]。然而,这些曲线差异显著,尤其是早—中全新世期间,这是SLIP稀缺使得重建的曲线不确定性增大导致的(图6)。NDGK2钻孔8.9 cal.kaBP潮滩相指示的海平面位置(−21.0±2.5 m)和Yu 等 15]重建的相对海平面曲线较为相符。因此,本研究基于沉积成因Sr/Ba辨识的全新统底部广泛存在的潮滩相,很可能会弥补早—中全新世福建地区SLIP稀缺的问题,为重建福建区域高精度相对海平面曲线提供可能。
5. 结论
(1)宁德三沙湾潮滩和海湾表层沉积物沉积成因Sr/Ba均值分别为9.06和20.43,差异显著,该指标在潮控海湾具有潮滩等沉积微相的辨识潜力。
(2)三沙湾NDGK2钻孔沉积成因Sr/Ba指示的沉积微相结果揭示了该区晚更新世末期以来河漫滩—潮滩—海湾沉积环境演化过程,受控于全新世海平面上升过程。形成于约8.9 cal.kaBP的潮滩相指示该区当时海平面大约在−21.0±2.5 m,最大海侵面出现在约8.2 cal.kaBP,之后出现了长达6 ka的低沉积速率,直至约2.2 cal.kaBP海湾内沉积加速。
(3)沉积成因Sr/Ba揭示了三沙湾全新统底部普遍发育潮滩相地层,潮滩相的辨识将对重建区域相对海平面提供可行性。
致谢:感谢南京地质调查中心王继龙、曾剑威、张艺武在野外样品采集中给与的帮助;感谢华东师范大学赵煊赫在ICP-MS 350仪器检测分析方面给与的帮助。
-
![]()
![]()
图 2 宁德三沙湾NDGK2钻孔年代地层与沉积特征
Figure 2. Chrono-stratigraphy and depositional characteristics of Core NDGK2 in Sansha Bay, Ningde
![]()
图 3 宁德三沙湾NDGK2钻孔沉积成因Sr、Ba元素特征
岩性柱图例同图2。
Figure 3. Characteristics of sedimentogenic Sr and Ba in the Core NDGK2 in Sansha Bay, Ningde
Legends are the same as Fig. 2.
![]()
图 4 宁德钻孔全新统底部沉积成因Sr、Ba元素特征
Figure 4. Characteristics of sedimentogenic Sr and Ba in the cores at the Pleistocene-Holocene boundary in Ningde region
![]()
图 5 宁德三沙湾表层沉积物沉积成因Sr/Ba及影响因素
Figure 5. Sedimentogenic Sr/Ba ratio of surface sediments in Sansha Bay, Ningde, and the influencing factors
![]()
图 6 沉积成因Sr/Ba指示的NDGK2钻孔全新世沉积环境演化
岩性柱图例同图2。
Figure 6. Holocene sedimentary environment evolution of Core NDGK2 indicated by sedimentogenic Sr/Ba ratio
Legends are the same as in Fig. 2.
![]()
图 7 沉积成因Sr/Ba揭示的宁德三沙湾全新统底部潮滩相
灰色阴影表示现代潮滩参考范围。
Figure 7. Tidal flat facies during the Early Holocene in Sansha Bay, Ningde, revealed by sedimentogenic Sr/Ba ratio
Gray shading indicates modern tidal flats reference range.
表 1 宁德三沙湾钻孔信息与实验样品统计
Table 1 Core information and experimental sample statistics of Sansha Bay, Ningde
钻孔编号 位置 孔口高程/m 终孔深度/m 全新统底界深度/m 元素分析样品数量 AMS 14C测年样品数量 NDGK1 26.60°N、119.62°E 5.515 85.75 25.65 10 − NDGK2 26.61°N、119.64°E 4.94 95.9 25.8 43 13 NDGK3 26.59°N、119.61°E 4.456 104 25 9 − NDGK6 26.59°N、119.62°E 4.67 78.3 17.3 5 − NDGK7 26.60°N、119.63°E 5.244 75.2 27.6 7 − NDGK9 26.65°N、119.61°E 4.536 37 21.2 8 − NDGK10 26.66°N、119.61°E 4.526 35.2 13.2 10 − NDGK14 26.65°N、119.60°E 4.506 49 18.8 9 − NDGK15 26.73°N、119.62°E 4.856 63.7 9.2 10 − NDGK17 26.73°N、119.63°E 4.032 69.6 7.6 7 − NDGK20 26.74°N、119.63°E 4.819 73.7 24.7 10 − NDGK25 26.76°N、119.57°E 1.306 43.3 12 9 − NDGK28 26.66°N、119.58°E 3.539 49.54 22 9 − NDQK3 26.67°N、119.54°E 4.881 78 11.35 10 − NDQK7 26.73°N、119.57°E 1.305 20 5.35 7 − 注:“−”表示暂未取得AMS 14C测年样品。  下载: 导出CSV
表 2 宁德三沙湾NDGK2钻孔AMS 14C测年结果
Table 2 AMS 14C dating results of Core NDGK2 in Sansha Bay, Ningde
序号 样品编号 测年材料 取样深度/m 14C年龄/aBP (1σ) Calib Rev 8.1.0校正年龄/cal.aBP (2σ) 1 NDGK2 14C-1 植物残体 8.0 580±20 586±46 2 NDGK2-6 碳化植物残体 9.9 1096 ±131006 ±503 NDGK2-12 碳化植物残体 12.8 2689 ±132801 ±45*4 NDGK2-14 碳化植物残体 14.3 2264 ±132260 ±80*5 NDGK2 14C-2 完整螺壳 14.7 4580 ±204676 ±179*6 NDGK2-21 碳化植物残体 18.6 1976±13 1906±38 7 NDGK2 14C-3 碳化植物残体 20.9 2230 ±202241 ±888 NDGK2-27 完整螺壳 22.8 7874 ±178226 ±1589 NDGK2 14C-4 片状贝壳碎屑 24.9 8195 ±258606 ±20610 NDGK2 14C-5 贝壳碎屑 25.75 8225 ±258650 ±21711 NDGK2 14C-5-2 碳化植物残体 25.75 7995 ±258879 ±11912 NDGK2-40 植物残体 25.8 12751 ±4115203 ±14413 NDGK2 14C-6 碳化植物残体 31.85 14450 ±3517623 ±208注:序号1、5、7、9—11、13的14C年龄数据引自于俊杰等[22],*代表年龄倒置,计算年龄所用14C半衰期为 5568 年。
下载: 导出CSV
表 3 宁德三沙湾现代表层沉积物沉积成因Sr、Ba元素特征
Table 3 Characteristics of sedimentogenic Sr and Ba elements of modern surface sediments in Sansha Bay, Ningde
样品位置 统计特征 Sr/(μg/g) Ba/(μg/g) Sr/Ba 潮滩 最小值 10.74 0.87 7.37 最大值 34.39 4.07 12.38 平均值 28.42 3.20 9.06 变异系数 0.20 0.24 0.10 海湾 最小值 26.95 1.57 10.35 最大值 57.82 2.71 33.62 平均值 39.01 2.02 20.43 变异系数 0.29 0.21 0.41
下载: 导出CSV
-
[1] Intergovernmental Panel on Climate Change(IPCC). Climate Change 2021: The Physical Science Basis. Contribution of Working Group I to the Sixth Assessment Report of the Intergovernmental Panel on Climate Change[R]. 2021.
[2] Nicholls R J, Cazenave A. Sea-level rise and its impact on coastal zones[J]. Science, 2010, 328(5985):1517-1520. doi: 10.1126/science.1185782
[3] Scott C D, Mary R, J Emmett D, et al. Climate Change Impacts on Marine Ecosystems[J]. Annual Review of Marine Science, 2012, 4(1):11-37. doi: 10.1146/annurev-marine-041911-111611
[4] Stephane H, Colin G, Robert J N, et al. Future flood losses in major coastal cities[J]. Nature Climate Change, 2013, 3(9):802-806. doi: 10.1038/nclimate1979
[5] Linsley B K. Oxygen-isotope record of sea level and climate variations in the Sulu Sea over the past 150000 years[J]. Nature, 1996, 380(6571):234-237. doi: 10.1038/380234a0
[6] Lambeck K, Rouby H, Purcell A, et al. Sea level and global ice volumes from the Last Glacial Maximum to the Holocene[J]. Proceedings of the National Academy of Sciences of the United States of America, 2014, 111(43):15296-15303.
[7] 林景星. 福建沿海全新世海进的初步认识[J]. 科学通报, 1979, 24(11):517-520 doi: 10.1360/csb1979-24-11-517 LIN Jingxing. A preliminary understanding of the Holocene marine advance of Fujian[J]. Chinese Science Bulletin, 1979, 24(11):517-520.] doi: 10.1360/csb1979-24-11-517
[8] 汪品先, 闵秋宝, 卞云华, 等. 我国东部第四纪海侵地层的初步研究[J]. 地质学报, 1981, 1(1):13 WANG Pinxian, MIN Qiubao, BIAN Yunhua, et al. A preliminary study of Quaternary marine intrusion stratigraphy in eastern China[J]. Acta Geologica Sinica, 1981, 1(1):13.]
[9] 王绍鸿, 杨建明, 孙亨伦, 等. 闽江下游及邻近地区冰后期海平面变动[J]. 海洋学报, 1990, 12(1):64-74 WANG Shaohong, YANG Jianming, SUN Henglun, et al. Postal glacial sea level change in the lower reach of Minjiang River and adjacent area[J]. Haiyang Xuebao, 1990, 12(1):64-74.]
[10] 王绍鸿, 吴学忠. 福建沿海全新世高温期的气候与海面变化[J]. 台湾海峡, 1992, 11(4):345-352 WANG Shaohong, WU Xuezhong. Climate and sea level changes during Holocene high temperature period along Fujian coast[J]. Journal of Oceanography in Taiwan Strait, 1992, 11(4):345-352.]
[11] 曾从盛. 闽东北沿海晚第四纪海侵与海面变动[J]. 福建师范大学学报: 自然科学版, 1997, 13(4):94-101 ZENG Congsheng. Transgressions and sea level changes along the northeast coast of Fujian during the late Quaternary[J]. Journal of Fujian Teachers University (Natural Science), 1997, 13(4):94-101.]
[12] Zong Y. Mid-Holocene sea-level highstand along the southeast coast of China[J]. Quaternary International, 2004, 117(1):55-67. doi: 10.1016/S1040-6182(03)00116-2
[13] 李永飞, 徐柳园, 许斌. 福建沿海40000年以来的海面变化[J]. 内江师范学院学报, 2016, 31(6):46-55,61 LI Yongfei, XU Liuyuan, XU Bin. Changes of sea-level in Fujian coast during the past 40 000 years[J]. Journal of Neijiang Normal University, 2016, 31(6):46-55,61.]
[14] 王龙, 王张华, 李翠玉. 福建沿海全新世相对海平面变化: 地质记录与“冰川−水均衡调整”模拟对比[J]. 海洋学报, 2022, 44(9):109-123 doi: 10.12284/j.issn.0253-4193.2022.9.hyxb202209010 WANG Long, WANG Zhanghua, LI Cuiyu. Holocene relative sea-level change of Fujian coast, southeastern China: Geological records and comparison with glacio-hydro isostatic adjustment modelling[J]. Haiyang Xuebao, 2022, 44(9):109-123.] doi: 10.12284/j.issn.0253-4193.2022.9.hyxb202209010
[15] Yu F, Li N, Tian G, et al. A re-evaluation of Holocene relative sea-level change along the Fujian coast, southeastern China[J]. Palaeogeography, Palaeoclimatology, Palaeoecology, 2023, 622:111577. doi: 10.1016/j.palaeo.2023.111577
[16] Törnqvist T E, van Ree M H M, van't Veer R, et al. Improving methodology for high-resolution reconstruction of sea-level rise and neotectonics by paleoecological analysis and AMS 14C dating of basal peats[J]. Quaternary Research, 1998, 49(1):72-85. doi: 10.1006/qres.1997.1938
[17] 韩书华, 张静. 福州市马尾地区第四纪地层划分及海相层分析[J]. 海洋地质与第四纪地质, 1992, 12(1):85-95 HAN Shuhua, ZHANG Jing. Delineation of Quaternary stratigraphy and analysis of marine stratigraphy in Mawei area, Fuzhou City, China[J]. Marine Geology & Quaternary Geology, 1992, 12(1):85-95.]
[18] 张璞. 福建漳州晚第四纪以来的环境演变[D]. 中国地质大学博士学位论文, 2005 ZHANG Pu. Environmental evolution since the Late Quaternary in Zhangzhou, Fujian, China[D]. Doctor Dissertation of China University of Geosciences, 2005.]
[19] 陈慧娴, 骆美美, 王建华, 等. 福建九龙江河口第四纪沉积物特征及沉积环境演变[J]. 古地理学报, 2014, 16(2):263-273 doi: 10.7605/gdlxb.2014.02.024 CHEN Huixian, LUO Meimei, WANG Jianhua, et al. Characterization of Quaternary sediments and evolution of depositional environments in the Jiulong River estuary, Fujian, China[J]. Journal of Palaeogeography, 2014, 16(2):263-273.] doi: 10.7605/gdlxb.2014.02.024
[20] Charrieau L M, Filipsson H L, Ljung K, et al. The effects of multiple stressors on the distribution of coastal benthic foraminifera: A case study from the Skagerrak-Baltic Sea region[J]. Marine Micropaleontology, 2018, 139:42-56. doi: 10.1016/j.marmicro.2017.11.004
[21] 孙丹丹, 刘平, 张杰, 等. 基于沉积成因地化元素指标的闽北海湾晚更新世海侵地层辨识及其意义[J]. 古地理学报, 2022, 24(1):139-151 doi: 10.7605/gdlxb.2022.01.011 SUN Dandan, LIU Ping, ZHANG Jie, et al. Identification and significance of the Late Pleistocene Transgressive strata in the bays of northern Fujian province based on geochemical element indicators of sedimentary origin[J]. Journal of Palaeography, 2022, 24(1):139-151.] doi: 10.7605/gdlxb.2022.01.011
[22] 于俊杰, 彭博, 兰佑, 等. 孢粉证据揭示MIS 5a以来福建东北沿海地区人类活动、海平面及气候变化[J]. 地球科学, 2021, 46(1):281-292 YU Junjie, PENG Bo, LAN You, et al. Palynological records revealed anthropogenic deforestation, sea level and climate changes since marine isotope stage 5a in the northeastern coast of Fujian Province[J]. Earth Science, 2021, 46(1):281-292.]
[23] 江硕. 福建主要河流及福州城市内河水污染特征研究[D]. 福建农林大学硕士学位论文, 2012 JIANG Shuo. Characterization of Water Pollution in Major Rivers in Fujian and Urban Inland Rivers in Fuzhou, China[D]. Master Dissertation of Fujian Agriculture and Forestry University, 2012.]
[24] 郑华峰. 霍童溪流域梯级水电站水库群洪水调度研究与实践[J]. 中国防汛抗旱, 2014, 24(3):21-23,40 doi: 10.3969/j.issn.1673-9264.2014.03.008 ZHENG Huafeng. Study and practice of flood scheduling for a group of reservoirs of terraced hydropower stations in the Huotong River Basin[J]. China flood control and drought relief., 2014, 24(3):21-23,40.] doi: 10.3969/j.issn.1673-9264.2014.03.008
[25] 宁德市人民政府. 河流[EB/OL]. (2021-10-26). https://www.ningde.gov.cn/zjnd/ndgk/202110/t20211026_1540341.htm People's Government of Ningde. River[EB/OL]. (2021-10-26). https://www.ningde.gov.cn/zjnd/ndgk/202110/t20211026_1540341.htm.]
[26] Yang D, Yin B, Liu Z, et al. Numerical study of the ocean circulation on the East China Sea shelf and a Kuroshio bottom branch northeast of Taiwan in summer[J]. Journal of Geophysical Research: Oceans, 2011, 116(C5):1-20.
[27] Chen J, Ma J, Xu K, et al. Provenance discrimination of the clay sediment in the western Taiwan Strait and its implication for coastal current variability during the late-Holocene[J]. The Holocene, 2017, 27(1):110-121. doi: 10.1177/0959683616652706
[28] 林航. 福建三沙湾的潮汐特征[J]. 福建水产, 2014, 36(4): 306-314 LIN Hang. Tidal characteristics of Sansha Bay, Fujian[J], Fujian Fisheries, 2014, 36(4): 306-314.]
[29] 王继龙, 林丰增, 彭博, 等. 福建宁德地区第四纪年代地层时空特征及对海平面变化的指示[J/OL]. 中国地质, 1-19. https://kns.cnki.net/kcms/detail/11.1167.P.20220314.1914.008.html WANG Jilong, LIN Fengzeng, PENG Bo, et al. Temporal and spatial characteristics of Quaternary stratigraphy in Ningde Area, Fujian Province and its indication of sea level changes[J/OL]. Geology in China, 1-19. https://kns.cnki.net/kcms/detail/11.1167.P.20220314.1914.008.html.]
[30] 江甘兴. 福建海区的潮汐和潮流[J]. 台湾海峡, 1992, 11(2):89-94 JIANG Ganxing. Tides and currents in the Fujian Sea Area[J]. Taiwan Strait, 1992, 11(2):89-94.]
[31] 严肃庄, 曹沛奎. 三沙湾表层沉积物中矿物特征及其泥沙来源[J]. 台湾海峡, 1997, 16(2):128-134 YAN Suzhuang, CAO Peikui. Characterization of minerals in surface sediments of Sansha Bay and their sediment sources[J]. Taiwan Strait, 1997, 16(2):128-134.]
[32] Dai L, Li S, Yu J, et al. Palynological evidence indicates the paleoclimate evolution in southeast China since late marine isotope stage 5[J]. Quaternary Science Reviews, 2021, 266:106964. doi: 10.1016/j.quascirev.2021.106964
[33] Liu P, Zhang J, Wang J, et al. Tectonic subsidence of the southeast China coast: New evidence from Late Pleistocene transgression in Ningde bay[J]. Palaeogeography, Palaeoclimatology, Palaeoecology., 2022, 605(2022):111226.
[34] Heaton T J, Köhler P, Butzin M, et al. Marine 20—the marine radiocarbon age calibration curve (0–55000 cal. BP)[J]. Radiocarbon, 2020, 62(4):779-820. doi: 10.1017/RDC.2020.68
[35] Reimer P J, Austin W E N, Bard E, et al. The IntCal 20 Northern Hemisphere radiocarbon age calibration curve (0–55 cal. kaBP). Radiocarbon, 2020, 62 (4): 725–757.
[36] Stuiver M, Reimer P J. Extended 14C data base and revised CALIB 3.0 14C age calibration program[J]. Radiocarbon, 1993, 35:215-230. doi: 10.1017/S0033822200013904
[37] 王爱华, 叶思源, 刘建坤, 等. 不同选择性提取方法锶钡比的海陆相沉积环境判别探讨——以现代黄河三角洲为例[J]. 沉积学报, 2020, 38(6):1226-1238 WANG Aihua, YE Siyuan, LIU Jiankun, et al. Discrimination between marine and terrestrial sedimentary environments by the selectively extracted Sr/Ba ratio: A case of sediments in the Yellow River delta[J]. Acta Sedimentologica Sinica, 2020, 38(6):1226-1238.]
[38] Wang A, Wang Z, Liu J, et al. The Sr/Ba ratio response to salinity in clastic sediments of the Yangtze River Delta[J]. Chemical geology, 2021, 559:119923. doi: 10.1016/j.chemgeo.2020.119923
[39] 蓝先洪, 马道修, 徐明广, 等. 珠江三角洲若干地球化学标志及指相意义[J]. 海洋地质与第四纪地质, 1987, 7(1):39-49 LAN Xianhong, MA Daoxiu, XU Mingguang, et al. Selected geochemical signatures and their significance in the Pearl River Delta Region[J]. Marine Geology & Quaternary Geology, 1987, 7(1):39-49.]
[40] 王爱华. 不同形态锶钡比的沉积环境判别效果比较[J]. 沉积学报, 1996, 14(4):168-173 WANG Aihua. Discriminant effect of sedimentary environment by the Sr/Ba ratio of different existing forms[J]. Acta Sedimentologica Sinica, 1996, 14(4):168-173.]
[41] Chen Z, Song B, Wang Z, et al. Late Quaternary evolution of the sub-aqueous Yangtze Delta, China: sedimentation, stratigraphy, palynology, and deformation[J]. Marine Geology, 2000, 162(2):423-441.
[42] Jaraula C M B, Siringan F P, Klingel R, et al. Records and causes of Holocene salinity shifts in Laguna de Bay, Philippines[J]. Quaternary International, 2014, 349:207-220. doi: 10.1016/j.quaint.2014.08.048
[43] Wei W, Algeo T J, Lu Y, et al. Identifying marine incursions into the Paleogene Bohai Bay Basin lake system in northeastern China[J]. International Journal of Coal Geology, 2018, 200:1-17. doi: 10.1016/j.coal.2018.10.001
[44] Ge L, Jinag S Y, Swennen R, et al. Chemical environment of cold seep carbonate formation on the northern continental slope of South China Sea: evidence from trace and rare earth element geochemistry[J]. Mar. Geol, 2010, 277:21-30. doi: 10.1016/j.margeo.2010.08.008
[45] 陈琳莹, 李崇瑛, 陈多福. 碳酸盐岩中碳酸盐矿物稀土元素分析方法进展[J]. 矿物岩石地球化学通报, 2012, 31(2): 177-183 CHEN Linying, LI Chongying, CHEN Duofu, Progress of Analytical Method of rare Earth elements of Carbonate Minerals in Carbonate Rock[J]. Bulletin of Mineralogy, Petrology and Geochemistry. 2012, 31(2): 177-183.]
[46] Davidson C M, Thomas R P, Mcvey S E, et al. Evaluation of a sequential extraction procedure for the speciation of heavy metals in sediments[J]. Anal. Chim. Acta, 1994, 291:277-286. doi: 10.1016/0003-2670(94)80023-5
[47] 徐岱璐, 殷勇, 时连强, 等. 长江口外扬子浅滩YZ05孔沉积序列及晚更新世以来的环境演化[J]. 海洋地质与第四纪地质, 2020, 40(6):22-38 XU Dailu, YIN Yong, SHI Lianqiang, et al. Sedimentary sequence of Hole YZ05 and environmental evolution since the Late Pleistocene in the Yangzi Shoal off the Yangtze River estuary[J]. Marine Geology & Quaternary Geology, 2020, 40(6):22-38.]
[48] 王爱华, 刘建坤, 许乃岑, 等. 陆源碎屑沉积物中沉积成因锶钡的选择性提取新技术[J]. 中国地质, 2019, 46(3):670-671 doi: 10.12029/gc20190320 WANG Aihua, LIU Jiankun, XU Niancen, et al. A new technology for selective extraction of sedimentogenic Strontium and Barium from terrigenous clastic sediments[J]. Geology in China, 2019, 46(3):670-671.] doi: 10.12029/gc20190320
[49] 刘宝珺. 沉积岩石学[M]. 北京: 地质出版社, 1980: 13-89 LIU Baojun. Sedimentary Petrology[M]. Beijing: Geological Press, 1980: 13-89.]
[50] 刘英俊, 曹励明, 李兆麟, 等. 元素地球化学[M]. 北京: 科学出版社, 1984: 283-372 LIU Yingjun, CAO Liming, LI Zhaolin, et al. Element Geochemistry[M]. Beijing: Science Press, 1984: 283-372.]
[51] 秦蕴珊, 赵松龄. 晚更新世以来长江水下三角洲的沉积结构与环境变迁[J]. 沉积学报, 1987, 5(3):105-112 QIN Yunshan, ZHAO Songling. Sedimentary structure and environmental evolution of submerged delta of Changjiang River since Late Pleistocene[J]. Acta Sedimentologica Sinica, 1987, 5(3):105-112.]
[52] 蓝先洪. 珠江三角洲晚第四纪沉积特征[J]. 沉积学报, 1996, 14(2):157-164 LAN Xianhong. Late Quaternary Sedimentary Characteristics of the Pearl River Delta[J]. Acta Sedimentologica Sinica, 1996, 14(2):157-164.]
[53] Xiong H, Zong Y, Qian P, et al. Holocene Sea-level history of the northern coast of South China Sea[J]. Quat. Sci. Rev, 2018, 194:12-26. doi: 10.1016/j.quascirev.2018.06.022
[54] 贾宝岩, 彭博, 王继龙, 等. 中全新世福建沿海地区海平面波动: 基于NDQK5岩芯介形类化石记录[J]. 地质学报, 2024, 98(2):333-345 JIA Baoyan, PENG Bo, WANG Jilong, et al. Mid-Holocene sea-level fluctuation in the Fujian coastal area: Evidence from the ostracod records of the core NDQK5[J]. Acta Geologica Sinica, 2024, 98(2):333-345.]
-
期刊类型引用(1)
1. 杨殊凡,石文斌,刘珠江,陈超,王道军,刘晓晶,敖明冲. 四川盆地复兴地区凉高山组页岩沉积环境与控制因素. 石油实验地质. 2025(03): 504-516 .  百度学术
百度学术
其他类型引用(0)


计量
- 文章访问数: 149
- HTML全文浏览量: 21
- PDF下载量: 63
- 被引次数: 1