Differential evolution of marginal basin fault: A case from numerical simulation of Pingbei Slope, Xihu Sag
-
摘要:
东海陆架盆地中生代以来的成盆过程中,发育了大量陆倾控盆断裂,其发育模式与形成演化与东亚其他边缘海盆地差异明显。前人关注东海陆架盆地迁移特征,而忽略了断层差异演化的形成机制,对断层发育过程控制因素缺少深入研究。西湖凹陷平北斜坡带北部为海倾断层组成的断阶区,南部为陆倾断层组成的半地堑区,断裂差异演化指示着东海陆架盆地的成盆过程。本文通过离散元数值模拟,模拟陆倾和海倾断层的形成及演化,以探讨断层几何发育特征的控制因素。结果表明,岩性差异对斜坡带断层演化有较大影响,较高抗剪强度岩层破裂易产生陆倾控盆断裂,而低抗剪强度岩石则易形成向海倾断层。应力作用方向是区域差异演化的重要控制因素,岩石强度相同,应力作用方向相反时,断层倾向相反。盆地形成过程中发育众多凹陷斜坡,但坡度不是断层差异演化的主导因素。平北斜坡带和边缘海盆地的差异演化可能是由基底强度差异或应力方向差异导致的。本文利用离散元数值模拟平北斜坡带断裂差异演化过程,为东海盆地构造演化机制及边缘海盆地的形成提供了思路和理论依据。
Abstract:In the East China Sea shelf basin, massive landward-dipping boundary faults were developed since the basin was born in the Mesozoic. Its structural geometry and tectonic process differ from those of other East Asian marginal basins. Previous studies focused on mainly tectonic migration of the East China Sea shelf basin, but differential evolution mechanism and its controlling factors in fault geometry were generally neglected. The northern part of the Pingbei Slope is the fault terrace zone formed by seaward-dipping normal faults, while the southern part is half-grabens controlled by landward-dipping normal faults. Differential evolution of faults in this region reflects the overall formation of the entire basin. To clarify the controlling factors, we investigated the development of landward-dipping and seaward-dipping faults by discrete element modeling. Results show that lithological differences affected the fault development. The landward-dipping normal faults tended to develop in the context of high-strength rocks, while seaward-dipping normal faults usually formed in the region of low strength. The stress orientation was another important factor for regional differential evolution, giving rise to faults development in opposite dipping. Although many slopes were developed during the formation of marginal basins, the topographic slope alone were not able to dominate the fault differential evolution. The differential evolution of the Pingbei Slope and the marginal basins might be controlled by the bedrock strength and geostress orientation. This study provided an insight and theory basis for understanding the mechanism of differential evolution in marginal basins.
-
Keywords:
- fault differential evolution /
- discrete element method /
- marginal basins /
- Xihu Sag /
- Pingbei Slope
-
-
![]()
![]()
![]()
![]()
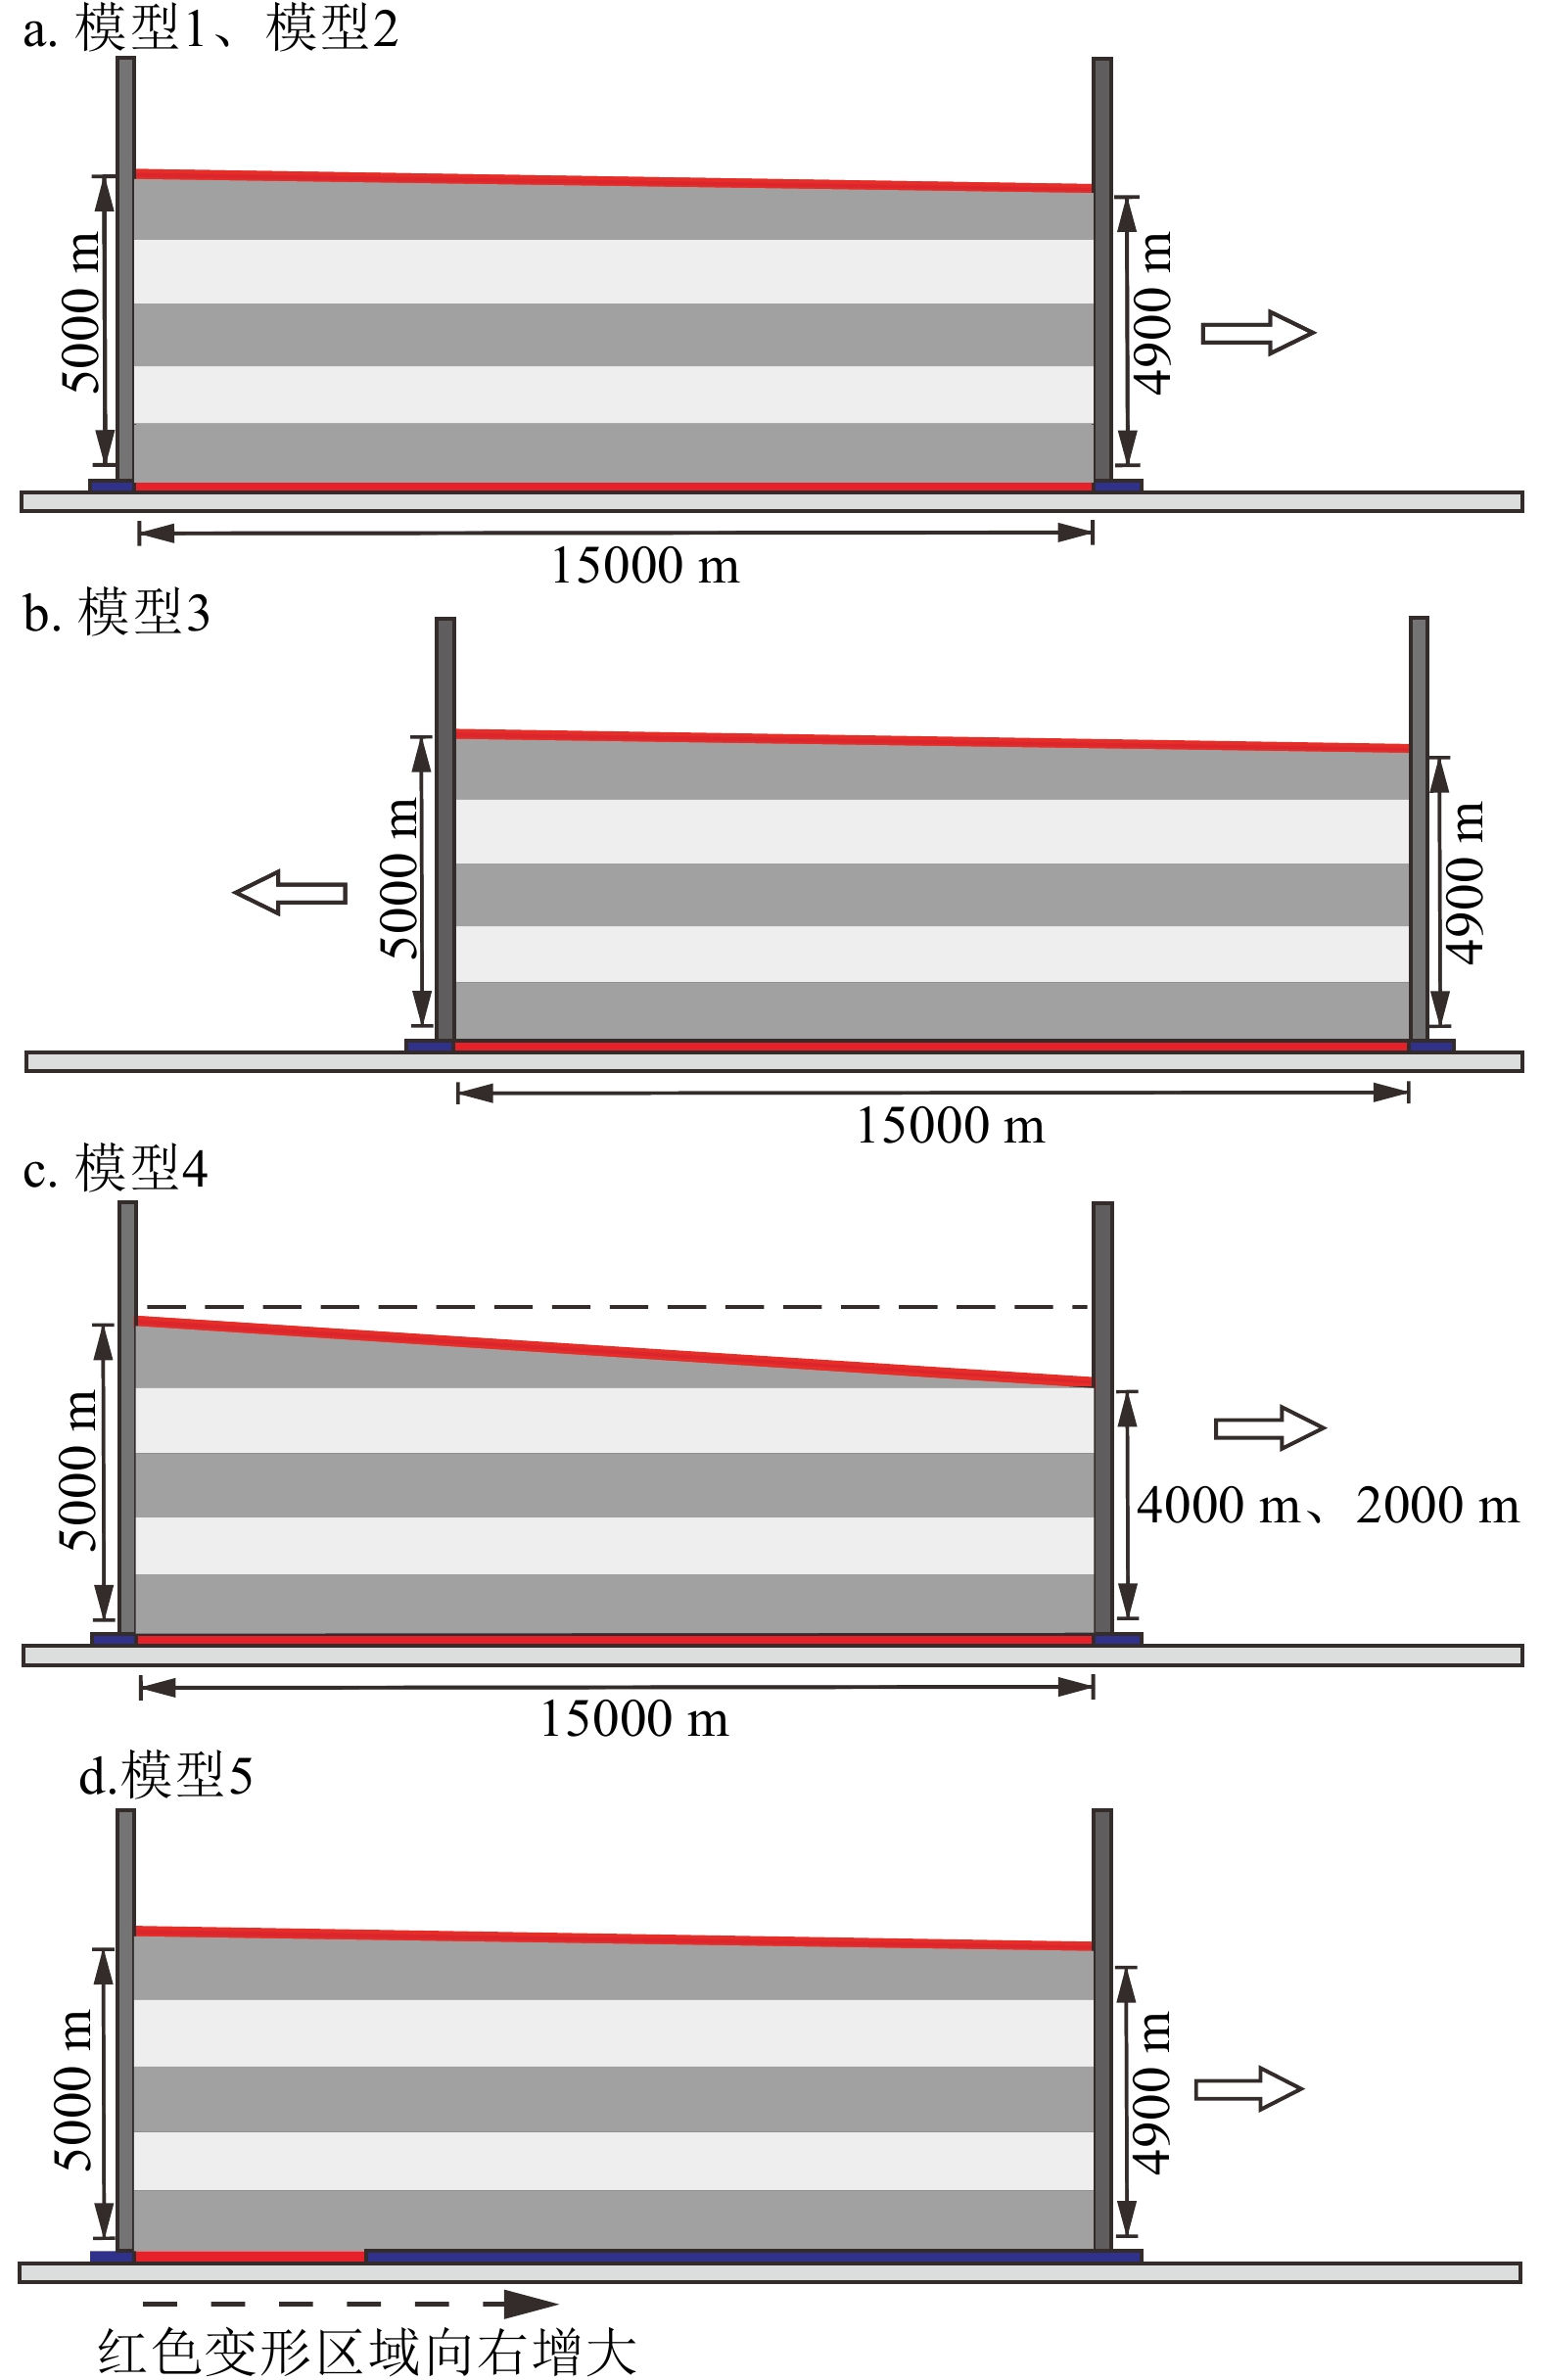
图 5 离散元数值模拟的模型边界条件
a:向海方向拉伸,模型1强基底,模型2弱基底;b:模型3强基底,向陆方向拉伸;c:模型4,强基底表面斜坡,右侧地层厚4 km、2 km;d:模型5 强基底,应力作用位置向海方向迁移。韧性变形域:红色,刚性板:蓝色。
Figure 5. Marginal conditions setup of the discrete element numerical simulation
a: Extending toward the sea: Model 1: strong basemen rock; Model 2: weak basement rock; b: Model 3: strong basement rock extending toward the continent; c: Model 4: strong basement rock with topographic slope, 4 km and 2 km thickness of the stratum in the right; d: Model 5: strong basement rock with stress location migrating toward the sea. Deformed region: red; rigid region: blue.
![]()
图 6 模型1构造变形、体积应变及断层断距统计
a, c, e:构造变形;b, d, f:体积应变;g:断距统计。
Figure 6. Structural deformation and volume strain in Model 1
a, c, e: Structural deformation; b, d, f: volume strain; g: fault displacement.
![]()
图 7 模型2构造变形、体积应变及断层断距统计
a, c, e:构造变形;b, d, f:体积应变;g:断距统计。
Figure 7. Structural deformation and volume strain in Model 2
a, c, e: Structural deformation; b, d, f: volume strain; g: fault displacement.
![]()
图 8 模型3构造变形、体积应变及断层断距统计
a, c, e:构造变形;b, d, f:体积应变;g:断距统计。
Figure 8. Structural deformation and volume strain in Model 3
a, c, e: Structural deformation; b, d, f: volume strain; g: fault displacement.
![]()
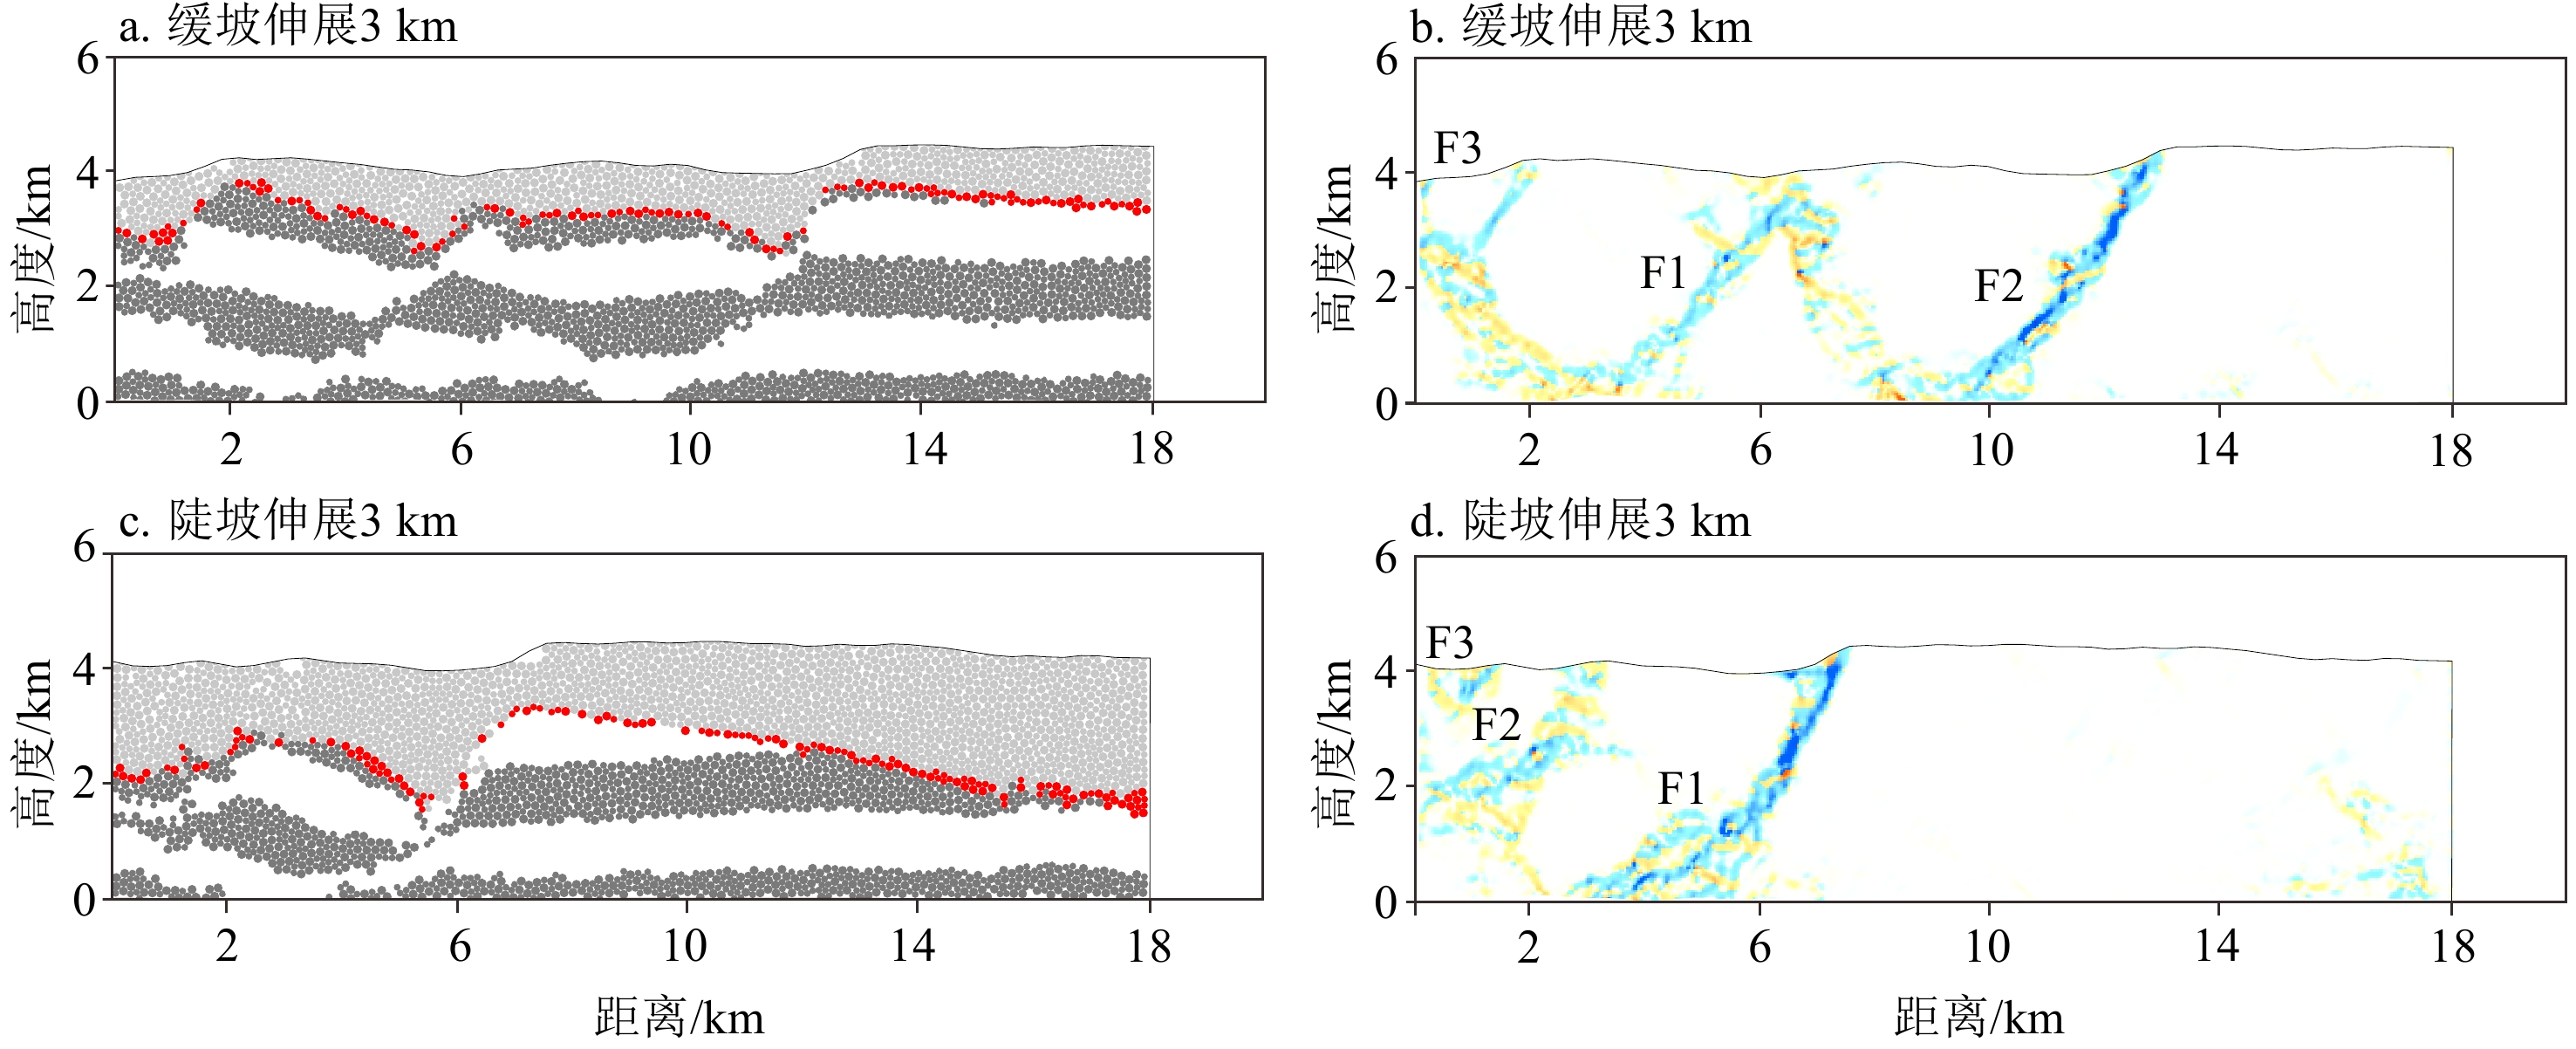
图 9 模型4构造变形与体积应变
左:构造变形,右:体积应变。 a-b:高差1 km ,c-d:高差3 km。
Figure 9. Structural deformation (left) and volume strain (right) in Model 4
Height difference: 1 km (a, b) or 3 km (c, d).
![]()
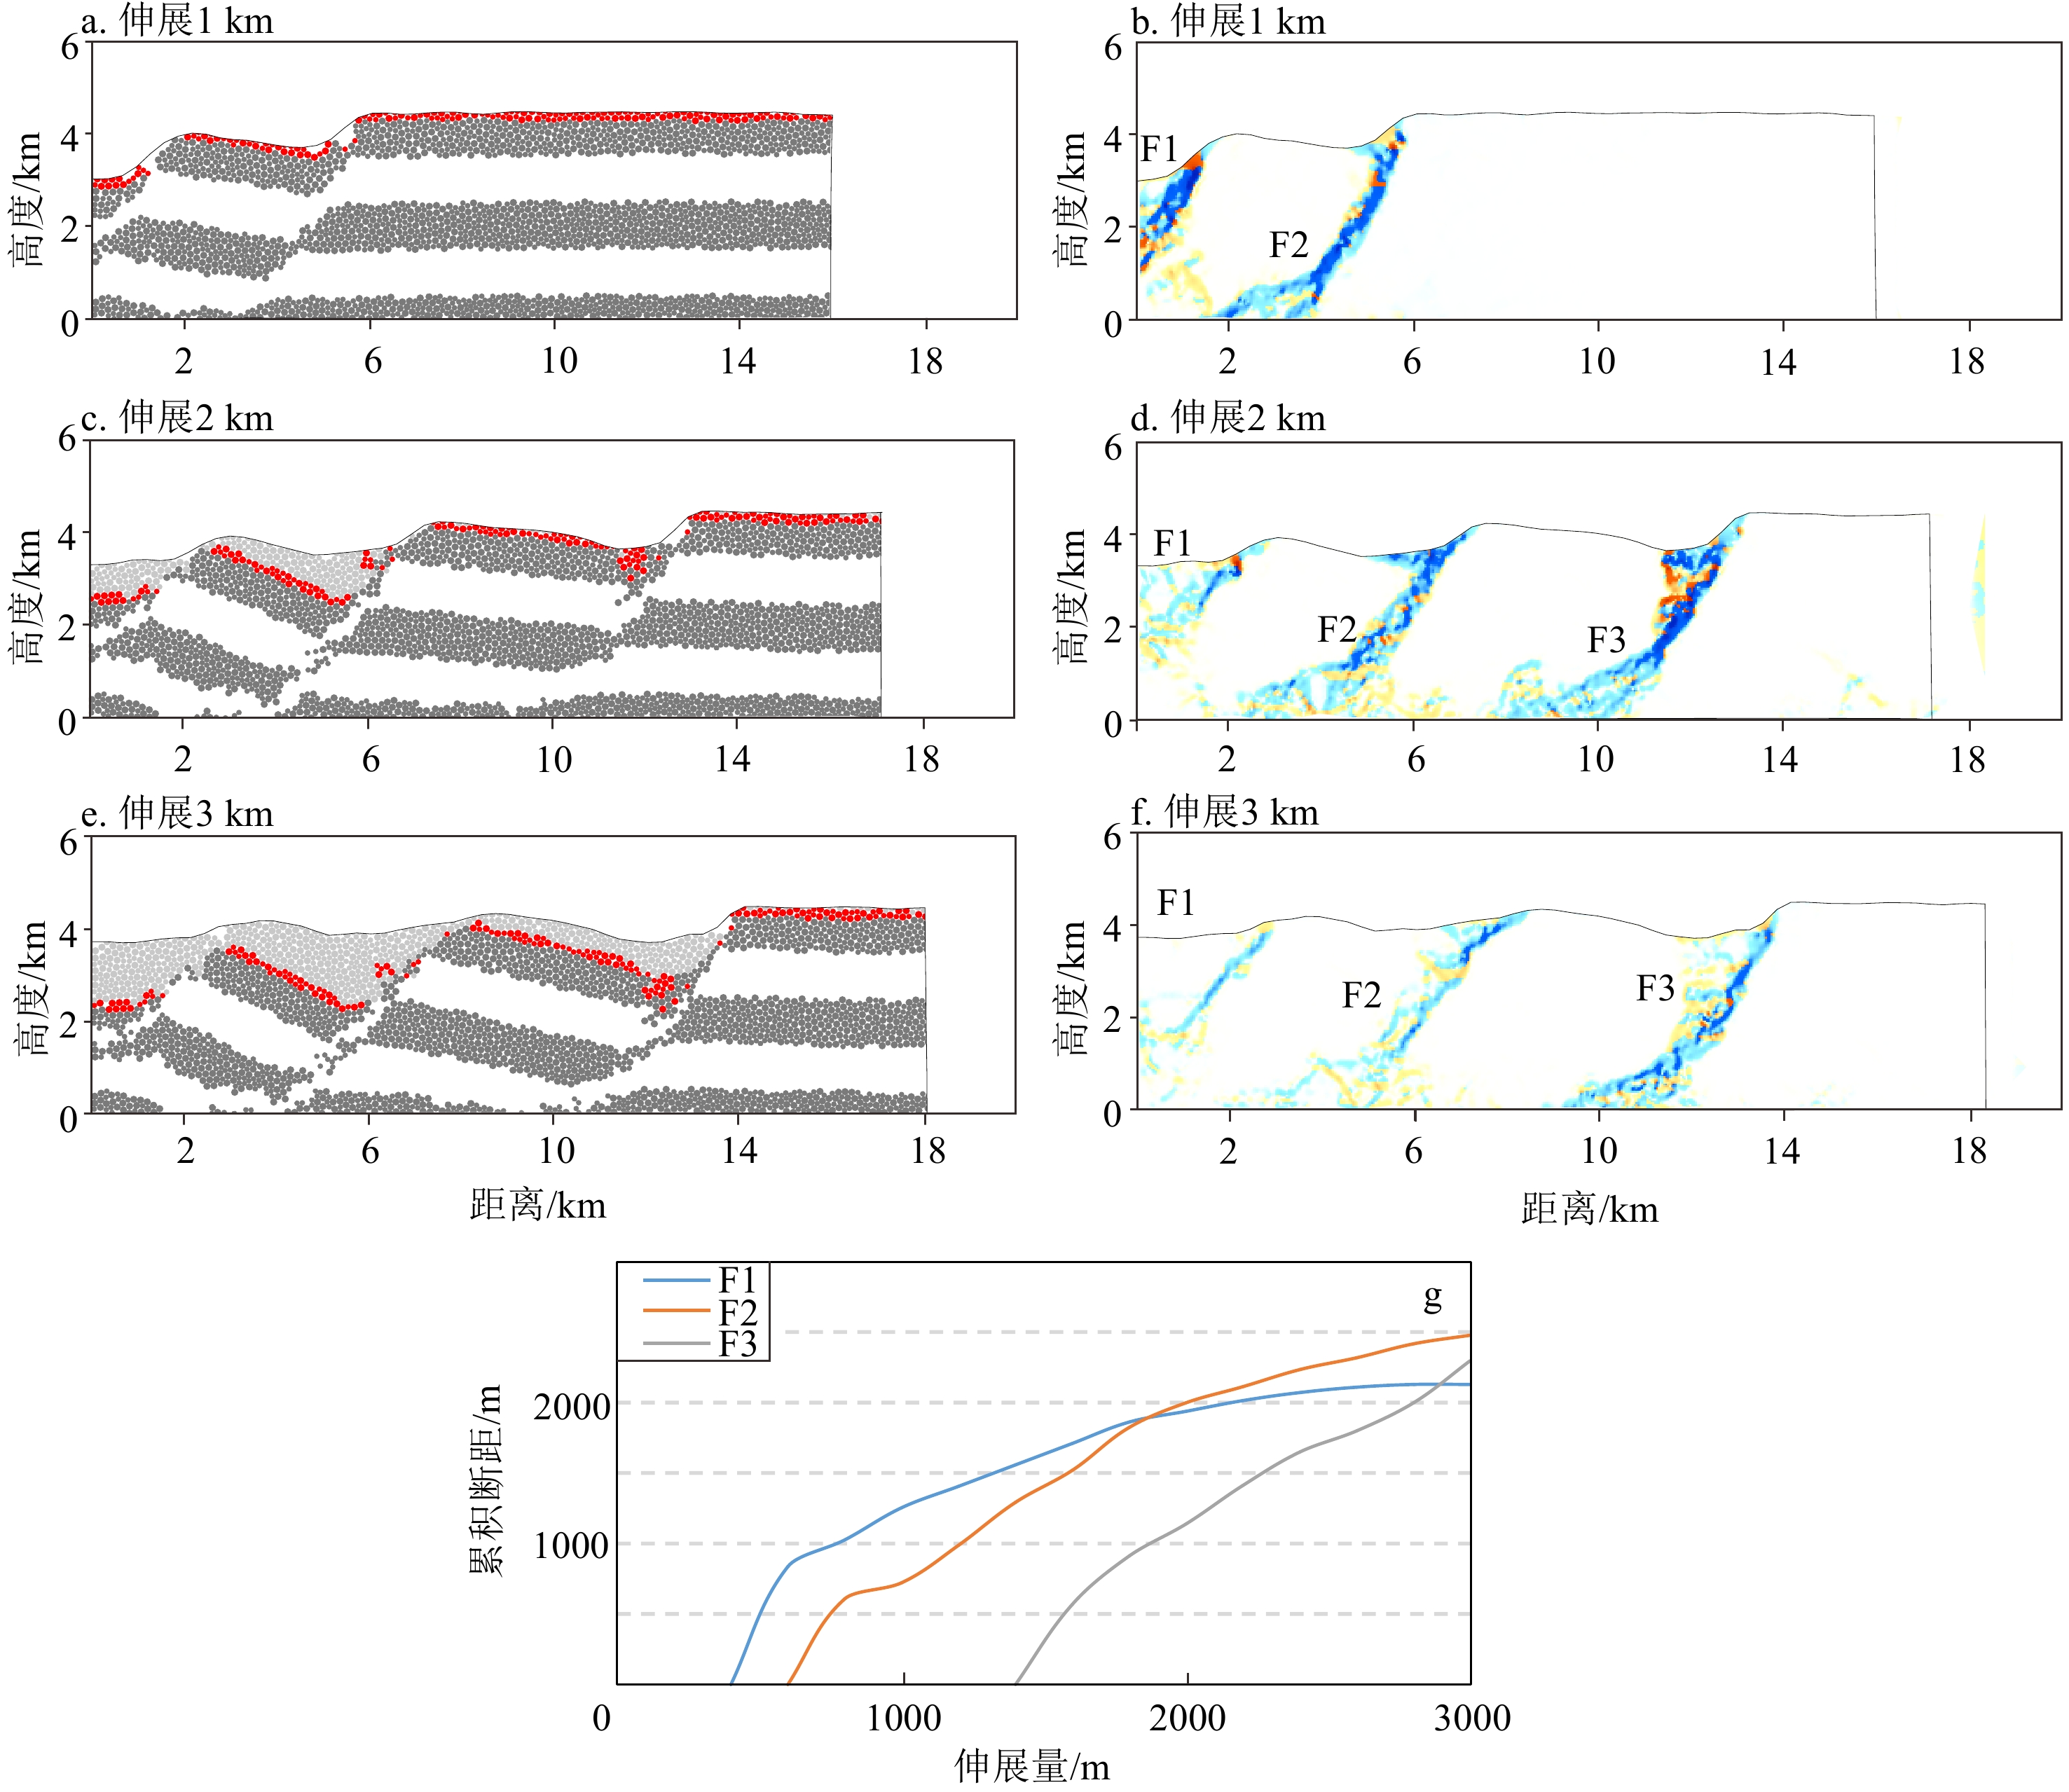
图 10 模型5构造变形、体积应变及断层断距统计
a, c, e:构造变形;b, d, f:体积应变;g:断距统计。
Figure 10. Structural deformation and volume strain in Model 5
a, c, e: Structural deformation; b, d, f: volume strain; g: fault displacement.
![]()
![]()
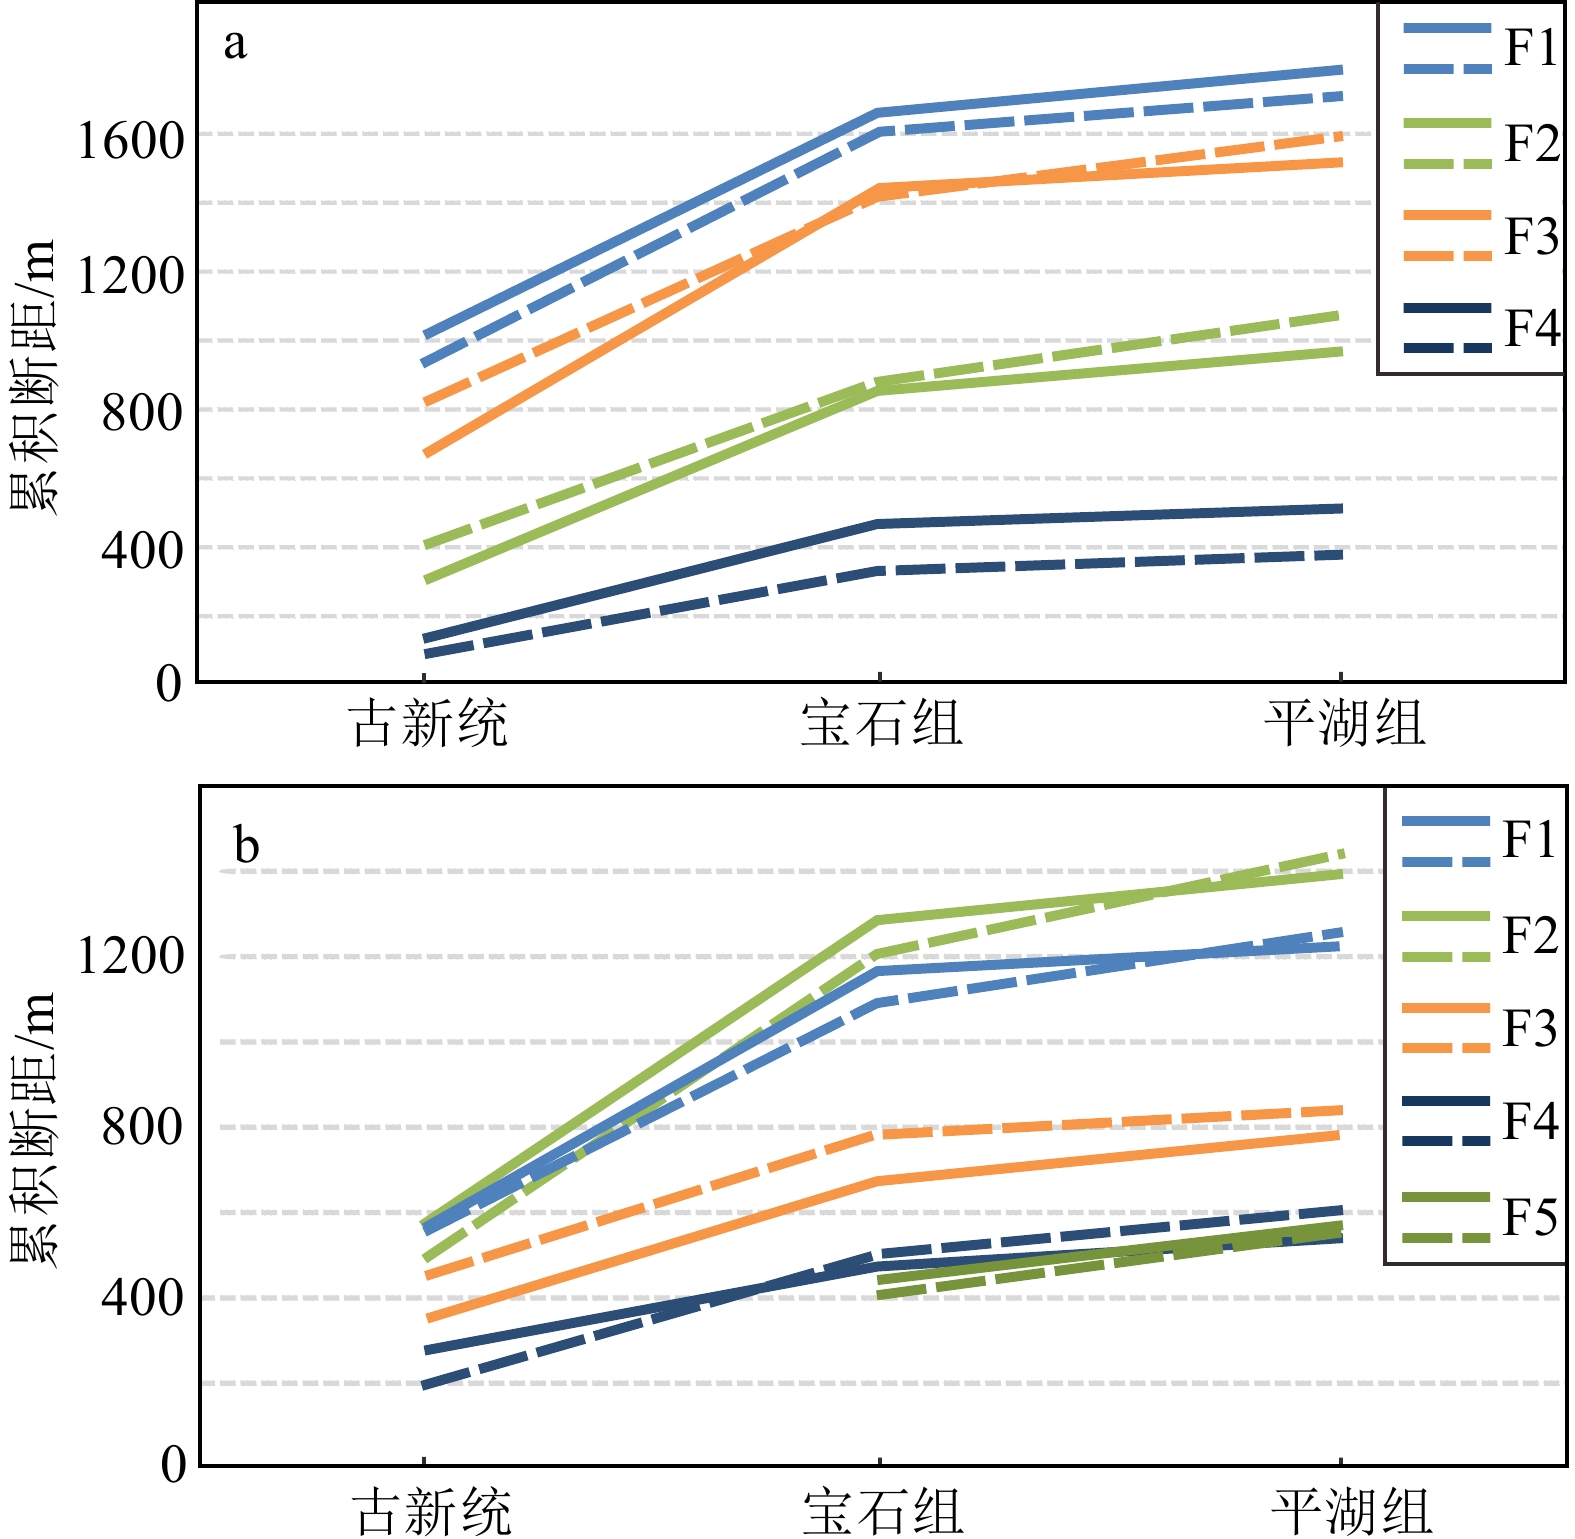
图 12 斜坡带与模型断层断距对比
a:斜坡带南部与模型1断层,断层名称见图4a;b:斜坡带北部与模型2断层,断层名称见图3a。虚线为模型断层,实线为剖面断层。
Figure 12. Comparison between slope belt and fault displacement in Model 1
a: Between the southern area and fault displacement in Model 1 (see Fig.4a for names of the faults); b: between the northern area and fault displacement in Model 2 (see Fig.3a for names of the faults). Dotted line: faults in the models; solid line: faults in slope belt.
表 2 模型粘结参数设置
Table 2 The model parameters
杨氏模量Eb/Pa 剪切模量Gb/Pa 抗拉强度Tb/Pa 剪切强度Cb/Pa 模型1,3,4,5 模型2 模型1,3,4,5 模型2 新生代基底 2.0×10⁸ 2.0×10⁸ 2.5×10⁷ 8.0×10⁶ 5.0×10⁷ 1.6×10⁷ 沉积层 1.0×10⁷ 2.0×10⁷  下载: 导出CSV
-
[1] Karig D E. Origin and development of marginal basins in the western Pacific [J]. Journal of Geophysical Research, 1971, 76(11): 2542-2561. doi: 10.1029/JB076i011p02542
[2] Xu S M, Ye Q, Li S Z, et al. Sequential patterns in Cenozoic marginal basins of the northwest Pacific [J]. Geological Journal, 2016, 51(S1): 387-415.
[3] 赵淑娟, 李三忠, 索艳慧, 等. 黄海盆地构造特征及形成机制[J]. 地学前缘, 2017, 24(4):239-248 ZHAO Shujuan, LI Sanzhong, SUO Yanhui, et al. Structure and formation mechanism of the Yellow Sea Basin [J]. Earth Science Frontiers, 2017, 24(4): 239-248.
[4] Wang R, Shi W Z, Xie X Y, et al. Coupling of strike-slip faulting and lacustrine basin evolution: sequence stratigraphy, structure, and sedimentation in the North Yellow Sea Basin (West Bay basin offshore North Korea), eastern China [J]. Marine and Petroleum Geology, 2020, 120: 104548. doi: 10.1016/j.marpetgeo.2020.104548
[5] Zhu Y B, Liu S F, Zhang B, et al. Reconstruction of the Cenozoic deformation of the Bohai Bay Basin, North China [J]. Basin Research, 2021, 33(1): 364-381. doi: 10.1111/bre.12470
[6] Sun Z, Zhong Z H, Keep M, et al. 3D analogue modeling of the South China Sea: a discussion on breakup pattern [J]. Journal of Asian Earth Sciences, 2009, 34(4): 544-556. doi: 10.1016/j.jseaes.2008.09.002
[7] Wang P C, Li S Z, Suo Y H, et al. Structural and kinematic analysis of Cenozoic rift basins in South China Sea: a synthesis [J]. Earth-Science Reviews, 2021, 216: 103522. doi: 10.1016/j.earscirev.2021.103522
[8] Zhu W L, Zhong K, Fu X W, et al. The formation and evolution of the East China Sea Shelf Basin: a new view [J]. Earth-Science Reviews, 2019, 190: 89-111. doi: 10.1016/j.earscirev.2018.12.009
[9] 刘金水, 许怀智, 蒋一鸣, 等. 东海盆地中、新生代盆架结构与构造演化[J]. 地质学报, 2020, 94(3):675-691 doi: 10.3969/j.issn.0001-5717.2020.03.001 LIU Jinshui, XU Huaizhi, JIANG Yiming, et al. Mesozoic and Cenozoic basin structure and tectonic evolution in the East China Sea basin [J]. Acta Geologica Sinica, 2020, 94(3): 675-691. doi: 10.3969/j.issn.0001-5717.2020.03.001
[10] Li C F, Xu X, Lin J, et al. Ages and magnetic structures of the South China Sea constrained by deep tow magnetic surveys and IODP Expedition 349 [J]. Geochemistry, Geophysics, Geosystems, 2014, 15(12): 4958-4983. doi: 10.1002/2014GC005567
[11] Dai L M, Li S Z, Lou D, et al. Numerical modeling of Late Miocene tectonic inversion in the Xihu Sag, East China Sea Shelf Basin, China [J]. Journal of Asian Earth Sciences, 2014, 86: 25-37.
[12] Wang P Z, Li S Z, Suo Y H, et al. Plate tectonic control on the formation and tectonic migration of Cenozoic basins in northern margin of the South China Sea [J]. Geoscience Frontiers, 2020, 11(4): 1231-1251. doi: 10.1016/j.gsf.2019.10.009
[13] Anders M H, Schlische R W. Overlapping faults, intrabasin highs, and the growth of normal faults [J]. The Journal of Geology, 1994, 102(2): 165-179. doi: 10.1086/629661
[14] McLeod A E, Dawers N H, Underhill J R. The propagation and linkage of normal faults: insights from the Strathspey–Brent–Statfjord fault array, northern North Sea [J]. Basin Research, 2000, 12(3‐4): 263-284.
[15] Tsuji T, Kawamura K, Kanamatsu T, et al. Extension of continental crust by anelastic deformation during the 2011 Tohoku-Oki earthquake: the role of extensional faulting in the generation of a great tsunami [J]. Earth and Planetary Science Letters, 2013, 364: 44-58. doi: 10.1016/j.jpgl.2012.12.038
[16] Clerc C, Ringenbach J C, Jolivet L, et al. Rifted margins: ductile deformation, boudinage, continentward-dipping normal faults and the role of the weak lower crust [J]. Gondwana Research, 2018, 53: 20-40. doi: 10.1016/j.gr.2017.04.030
[17] Peron-Pinvidic G, Manatschal G, Osmundsen P T. Structural comparison of archetypal Atlantic rifted margins: a review of observations and concepts [J]. Marine and Petroleum Geology, 2013, 43: 21-47. doi: 10.1016/j.marpetgeo.2013.02.002
[18] Zhao Y H, Ren J Y, Pang X, et al. Structural style, formation of low angle normal fault and its controls on the evolution of Baiyun Rift, northern margin of the South China Sea [J]. Marine and Petroleum Geology, 2018, 89: 687-700. doi: 10.1016/j.marpetgeo.2017.11.001
[19] McClay K R. Extensional fault systems in sedimentary basins: a review of analogue model studies [J]. Marine and Petroleum Geology, 1990, 7(3): 206-233. doi: 10.1016/0264-8172(90)90001-W
[20] Mandl G. Faulting in Brittle Rocks[M]. Berlin: Springer, 1999: 376-406.
[21] Cowie P A, Underhill J R, Behn M D, et al. Spatio-temporal evolution of strain accumulation derived from multi-scale observations of Late Jurassic rifting in the northern North Sea: a critical test of models for lithospheric extension [J]. Earth and Planetary Science Letters, 2005, 234(3-4): 401-419. doi: 10.1016/j.jpgl.2005.01.039
[22] Bose S, Mitra S. Controls of listric normal fault styles in the northern Gulf of Mexico: insights from experimental models [J]. Marine and Petroleum Geology, 2012, 35(1): 41-54. doi: 10.1016/j.marpetgeo.2012.01.012
[23] Deng C, Gawthorpe R L, Finch E, et al. Influence of a pre-existing basement weakness on normal fault growth during oblique extension: insights from discrete element modeling [J]. Journal of Structural Geology, 2017, 105: 44-61. doi: 10.1016/j.jsg.2017.11.005
[24] Bukhari S W H, Li S Z, Liu Z, et al. Deep and surface driving forces that shape the Earth: insights from the evolution of the northern South China sea margin[J]. Gondwana Research, 2022, doi: 10.1016/j.gr.2022.05.005.
[25] Hardy S, Finch E. Discrete element modelling of the influence of cover strength on basement-involved fault-propagation folding [J]. Tectonophysics, 2006, 415(1-4): 225-238. doi: 10.1016/j.tecto.2006.01.002
[26] Morgan J K. Effects of cohesion on the structural and mechanical evolution of fold and thrust belts and contractional wedges: discrete element simulations [J]. Journal of Geophysical Research, 2015, 120(5): 3870-3896. doi: 10.1002/2014JB011455
[27] 杨彩虹, 曾广东, 李上卿, 等. 东海西湖凹陷平北地区断裂发育特征与油气聚集[J]. 石油实验地质, 2014, 36(1):64-69,82 doi: 10.11781/sysydz201401064 YANG Caihong, ZENG Guangdong, LI Shangqing, et al. Fault development characteristics and hydrocarbon accumulation in Pingbei area of Xihu Sag, East China Sea [J]. Petroleum Geology and Experiment, 2014, 36(1): 64-69,82. doi: 10.11781/sysydz201401064
[28] 唐贤君, 蒋一鸣, 张建培, 等. 东海盆地西湖凹陷平北区断陷层断裂特征及其对圈闭的控制[J]. 海洋地质前沿, 2019, 35(8):34-43 doi: 10.16028/j.1009-2722.2019.08005 TANG Xianjun, JIANG Yiming, ZHANG Jianpei, et al. Fault characteristic and its control on traps of fault structural layer in the northern Pinghu Slope Belt, Xihu Sag, East China Sea Shelf Basin [J]. Marine Geology Frontiers, 2019, 35(8): 34-43. doi: 10.16028/j.1009-2722.2019.08005
[29] 李长圣. 基于离散元的褶皱冲断带构造变形定量分析与模拟[D]. 南京大学博士学位论文, 2019 LI Changsheng. Quantitative analysis and simulation of structural deformation in the fold and thrust belt based on discrete element method[D]. Doctor Dissertation of Nanjing University, 2019.
[30] 江东辉, 蒲仁海, 苏思羽, 等. 断陷盆地斜坡带大型油气田成藏条件: 西湖凹陷平北缓坡断裂与岩性控藏有利区[J]. 天然气工业, 2021, 41(11):33-42 JIANG Donghui, PU Renhai, SU Siyu, et al. Conditions for the formation of large oil and gas reservoirs in the slope belts of rift basins: fault-and lithology-controlled accumulation zones in the Pingbei slope of Xihu Sag [J]. Natural Gas Industry, 2021, 41(11): 33-42.
[31] 李峻颉, 蒋一鸣, 侯国伟, 等. 坡折带对油气圈闭发育的约束效应: 以平湖斜坡带孔雀亭区平湖组为例[J]. 海洋地质与第四纪地质, 2021, 41(3):141-150 LI Junjie, JIANG Yiming, HOU Guowei, et al. Constraints of slope break belt on oil and gas trapping: an example from the Pinghu Formation in the Kongqueting area of Pinghu Slope [J]. Marine Geology & Quaternary Geology, 2021, 41(3): 141-150.
[32] 蒋一鸣, 邹玮, 刘金水, 等. 东海西湖凹陷中新世末反转背斜构造成因机制: 来自基底结构差异的新认识[J]. 地球科学, 2020, 45(3):968-979 JIANG Yiming, ZOU Wei, LIU Jinshui, et al. Genetic mechanism of inversion anticline structure at the end of Miocene in Xihu Sag, East China Sea: a new understanding of basement structure difference [J]. Earth Science, 2020, 45(3): 968-979.
[33] Dean S L, Morgan J K, Fournier T. Geometries of frontal fold and thrust belts: insights from discrete element simulations [J]. Journal of Structural Geology, 2013, 53: 43-53. doi: 10.1016/j.jsg.2013.05.008
[34] Cundall P A, Strack O D L. A discrete numerical model for granular assemblies [J]. Géotechnique, 1979, 29(1): 47-65.
[35] 崔幸, 王亮亮, 罗洪明, 等. 东海陆架盆地南部中生代盆地性质与演化: 砂箱物理模拟检验[J]. 海洋地质与第四纪地质, 2017, 37(4):181-192 CUI Xing, WANG Liangliang, LUO Hongming, et al. Sandbox modeling test for Mesozoic basins in southern East China Sea Shelf Basin [J]. Marine Geology & Quaternary Geology, 2017, 37(4): 181-192.
[36] 李长圣, 尹宏伟, 吴珍云, 等. 一种基于离散元的裂谷盆地伸展过程模拟方法: 中国, CN111008472A[P]. 2020-04-14 LI Changsheng, YIN Hongwei, WU Zhenyun, et al. A simulation method for the extension of rift basins based on discrete element: CN, CN111008472A[P]. 2020-04-14.
[37] Hardy S. Coupling a frictional-cohesive cover and a viscous substrate in a discrete element model: first results of application to thick- and thin-skinned extensional tectonics [J]. Marine and Petroleum Geology, 2018, 97: 32-44. doi: 10.1016/j.marpetgeo.2018.06.026
[38] Vora H B. Shear fracture growth in granular rocks and porosity-permeability relationships in mudstones[D]. Doctor Dissertation of Rice University, 2019.
[39] 张绍亮, 张建培, 唐贤君, 等. 东海西湖凹陷断裂系统几何学特征及其成因机制[J]. 海洋地质与第四纪地质, 2014, 34(1):87-94 ZHANG Shaoliang, ZHANG Jianpei, TANG Xianjun, et al. Geometry characteristic of the fault system in Xihu sag in East China Sea and its formation mechanism [J]. Marine Geology & Quaternary Geology, 2014, 34(1): 87-94.
[40] 郭太宇. 西湖凹陷平湖构造带三维古地形恢复[D]. 中国海洋大学硕士学位论文, 2015 GUO Taiyu. 3D palaeotopography recovery of Pinghu structural belt in Xihu depression[D]. Master Dissertation of Ocean University of China, 2015.
[41] Clerc C, Jolivet L, Ringenbach J C. Ductile extensional shear zones in the lower crust of a passive margin [J]. Earth and Planetary Science Letters, 2015, 431: 1-7. doi: 10.1016/j.jpgl.2015.08.038
[42] Michon L, Sokoutis D. Interaction between structural inheritance and extension direction during graben and depocentre formation: an experimental approach [J]. Tectonophysics, 2005, 409(1-4): 125-146.
[43] Abe S, van Gent H, Urai J L. DEM simulation of normal faults in cohesive materials [J]. Tectonophysics, 2011, 512(1-4): 12-21. doi: 10.1016/j.tecto.2011.09.008
[44] Yin A. Mechanics of wedge-shaped fault blocks: 2. An elastic solution for extensional wedges [J]. Journal of Geophysical Research, 1994, 99(B4): 7045-7055. doi: 10.1029/93JB02389
[45] McClay K R, Ellis P G. Geometries of extensional fault systems developed in model experiments [J]. Geology, 1987, 15(4): 341-344. doi: 10.1130/0091-7613(1987)15<341:GOEFSD>2.0.CO;2
[46] Childs C, Manzocchi T, Walsh J J, et al. A geometric model of fault zone and fault rock thickness variations [J]. Journal of Structural Geology, 2009, 31(2): 117-127. doi: 10.1016/j.jsg.2008.08.009
[47] Henza A A, Withjack M O, Schlische R W. How do the properties of a pre-existing normal-fault population influence fault development during a subsequent phase of extension? [J]. Journal of Structural Geology, 2011, 33(9): 1312-1324. doi: 10.1016/j.jsg.2011.06.010
[48] Su J B, Zhu W B, Chen J, et al. Cenozoic inversion of the East China Sea Shelf Basin: implications for reconstructing Cenozoic tectonics of eastern China [J]. International Geology Review, 2014, 56(12): 1541-1555. doi: 10.1080/00206814.2014.951004
[49] Liu Z, Dai L M, Li S Z, et al. Earth's surface responses during geodynamic evolution: Numerical insight from the southern East China Sea Continental Shelf Basin, West Pacific [J]. Gondwana Research, 2022, 102: 167-179. doi: 10.1016/j.gr.2020.12.011
[50] Suo Y H, Li S Z, Zhao S J, et al. Continental margin basins in East Asia: tectonic implications of the Meso-Cenozoic East China Sea pull-apart basins [J]. Geological Journal, 2015, 50(2): 139-156. doi: 10.1002/gj.2535
[51] Wang Q, Li S Z, Guo L L, et al. Analogue modelling and mechanism of tectonic inversion of the Xihu Sag, East China Sea Shelf Basin [J]. Journal of Asian Earth Sciences, 2017, 139: 129-141. doi: 10.1016/j.jseaes.2017.01.026
[52] Wang P C, Suo Y H, Peng G R, et al. Three-stage extension in the Cenozoic Pearl River Mouth Basin triggering onset of the South China Sea spreading[J]. Gondwana Research, 2022, doi: 0.1016/j.gr.2022.05.023.
[53] Cao X Z, Zahirovic S, Li S Z, et al. A deforming plate tectonic model of the South China Block since the Jurassic [J]. Gondwana Research, 2022, 102: 3-16.
[54] Zhu W L, Zhong K, Li Y C, et al. Characteristics of hydrocarbon accumulation and exploration potential of the northern South China Sea deepwater basins [J]. Chinese Science Bulletin, 2012, 57(24): 3121-3129. doi: 10.1007/s11434-011-4940-y
[55] Qun L. Concept, principle, model and significance of the fault controlling hydrocarbon theory [J]. Petroleum Exploration and Development, 2010, 37(3): 316-324. doi: 10.1016/S1876-3804(10)60035-3
[56] Yang C Q, Sun J, Yang Y Q, et al. Key factors controlling Mesozoic hydrocarbon accumulation in the southern East China Sea basin [J]. Marine and Petroleum Geology, 2020, 118: 104436. doi: 10.1016/j.marpetgeo.2020.104436


计量
- 文章访问数: 824
- HTML全文浏览量: 274
- PDF下载量: 60