
Research progress of tracing sediment sources in the Western Pacific Warm Pool
-
摘要: 从沉积物中提取示踪指标是研究西太平洋暖池区古环境和古气候演化的有效途径之一,而准确识别沉积物的源区是其中的关键。目前已通过不同的物源示踪指标,如黏土矿物、石英单矿物、常量元素、稀土元素以及碎屑组分的放射性成因Sr-Nd同位素等,对西太平洋暖池北部和西部第四纪以来的沉积物来源进行了研究,结果表明暖池区沉积物主要来源于亚洲大陆和火山岛弧,部分来源于澳大利亚和/或新几内亚。本文系统归纳和总结了上述示踪指标在西太平洋暖池区的物源研究进展和成果,以及研究中存在的问题,并对西太平洋暖池沉积物源研究提出了几点建议。Abstract: Extracting tracer indicators from sediments is one of the effective ways to study the paleoenvironment and paleoclimate evolution in the Western Pacific Warm Pool (WPWP), and the key is to accurately identify the source region of sediments. The sources of sediments in the northern and western WPWP since the Quaternary have been studied using different source tracers, such as clay minerals, quartz, major elements, REE and Sr-Nd isotope of clastic components. Results show that the sediments of the WPWP originate mainly from the Asian continent and volcanic island arcs, and some originate from Australia and/or New Guinea. This paper systematically summarizes the sources and tracing methods of sediments in the WPWP, points out the issues in the current researches, and puts forward the prospects for the identification of sediment sources in the future.
-
Keywords:
- source area /
- sediment /
- source tracing /
- Western Pacific Warm Pool
-
-
![]()
图 1 西太平洋暖池区洋流模式及周边物源区示意图
黄色圆点代表本文提及的暖池区站位;红色实线代表28 ℃等温线;白色箭头代表表层流流向;深蓝色箭头代表底层水流向[18-19];红色箭头代表东亚冬季风,黄色箭头代表盛行西风带,紫色箭头代表澳大利亚冬季风,绿色箭头代表潜在源区沉积物的输入量。NEC:北赤道流,NECC:北赤道逆流,SEC:南赤道流,KC:黑潮,MC:棉兰老流,UCDW:上层绕极深层水,LCDW:下层绕极深层水,EAWM:东亚冬季风,PW:盛行西风带,AWM:澳大利亚冬季风。
Figure 1. Map of ocean currents and potential provenance of Western Pacific Warm Pool
Yellow dots represent stations in the Western Pacific Warm Pool mentioned in this article. The solid red line represents the 28 ℃ isotherm. The surface flow and bottom water trajectories [18-19] are shown with white and blue arrows, respectively. The East Asian Winter Monsoon, Prevailing Westerlies and Australian Winter Monsoon are shown with red, yellow, and purple arrows, respectively. Also shown are the sediment inputs from potential source areas with green arrows. NEC: North Equatorial Current, NECC: North Equatorial Counter Current, SEC: South Equatorial Current, KC: Kuroshio Current, MC: Mindanao Current, UCDW: Upper Circumpolar Deep Water, LCDW: Lower Circumpolar Deep Water, EAWM: East Asian Winter Monsoon, PW: Prevailing Westerlies, AWM: Australian Winter Monsoon.
![]()
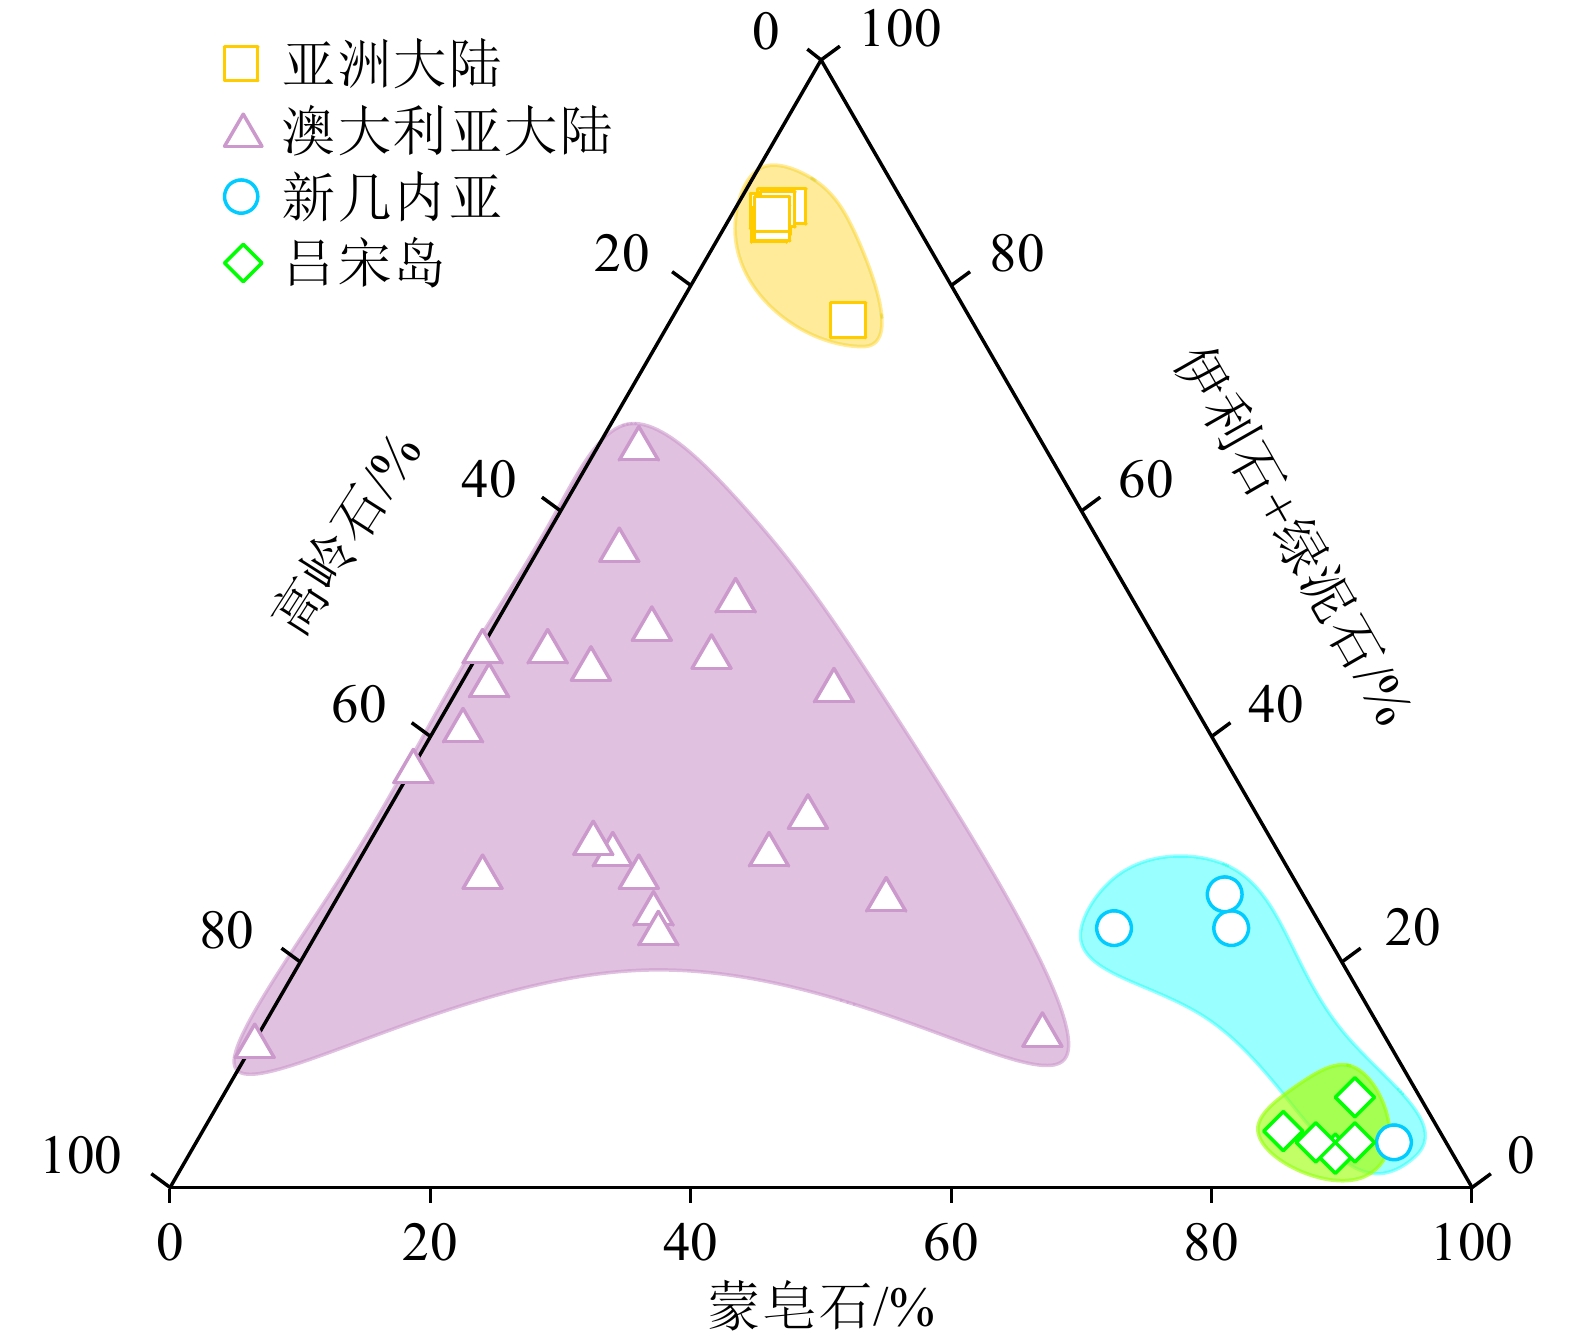
图 2 西太平洋暖池沉积物潜在源区黏土矿物端元图
潜在源区包括亚洲大陆[33-36]、澳大利亚大陆[28]、新几内亚[7]和吕宋岛[31-32]。
Figure 2. Ternary diagram of clay minerals in sediments from the potential source areas of the Western Pacific Warm Pool
The potential source areas include Asian continent[33-36], Australia continent [28], New Guinea [7], and Luzon Island [31-32].
![]()
![]()
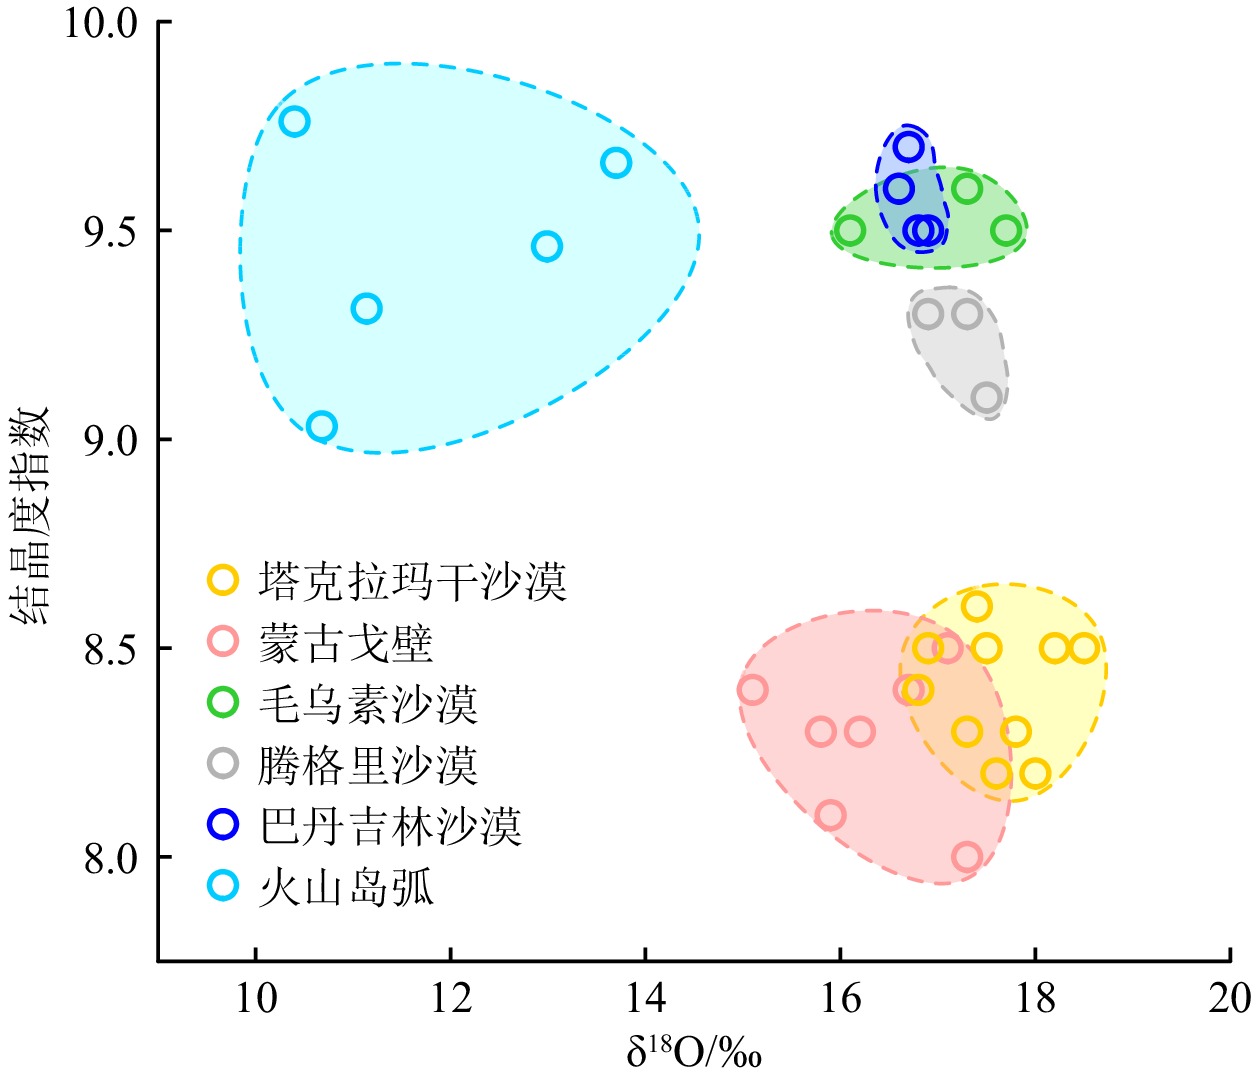
图 4 西太平洋暖池沉积物潜在源区石英的δ18O值-结晶度指数二元图
潜在源区包括塔克拉玛干沙漠[43-44]、蒙古戈壁[43-44]、毛乌素沙漠[43-44]、腾格里沙漠[43-44]、巴丹吉林沙漠[43-44]和火山岛弧[8]。
Figure 4. δ18O values and crystallinity index of quartz in the sediment of possible sources of the Western Pacific Warm Pool
The potential source areas include Taklimakan Desert[43-44], Mongolian Gobi[43-44], Mu Us Desert[43-44], Tengger Desert[43-44], Badain Jaran Desert[43-44], and volcanic materials[8].
![]()
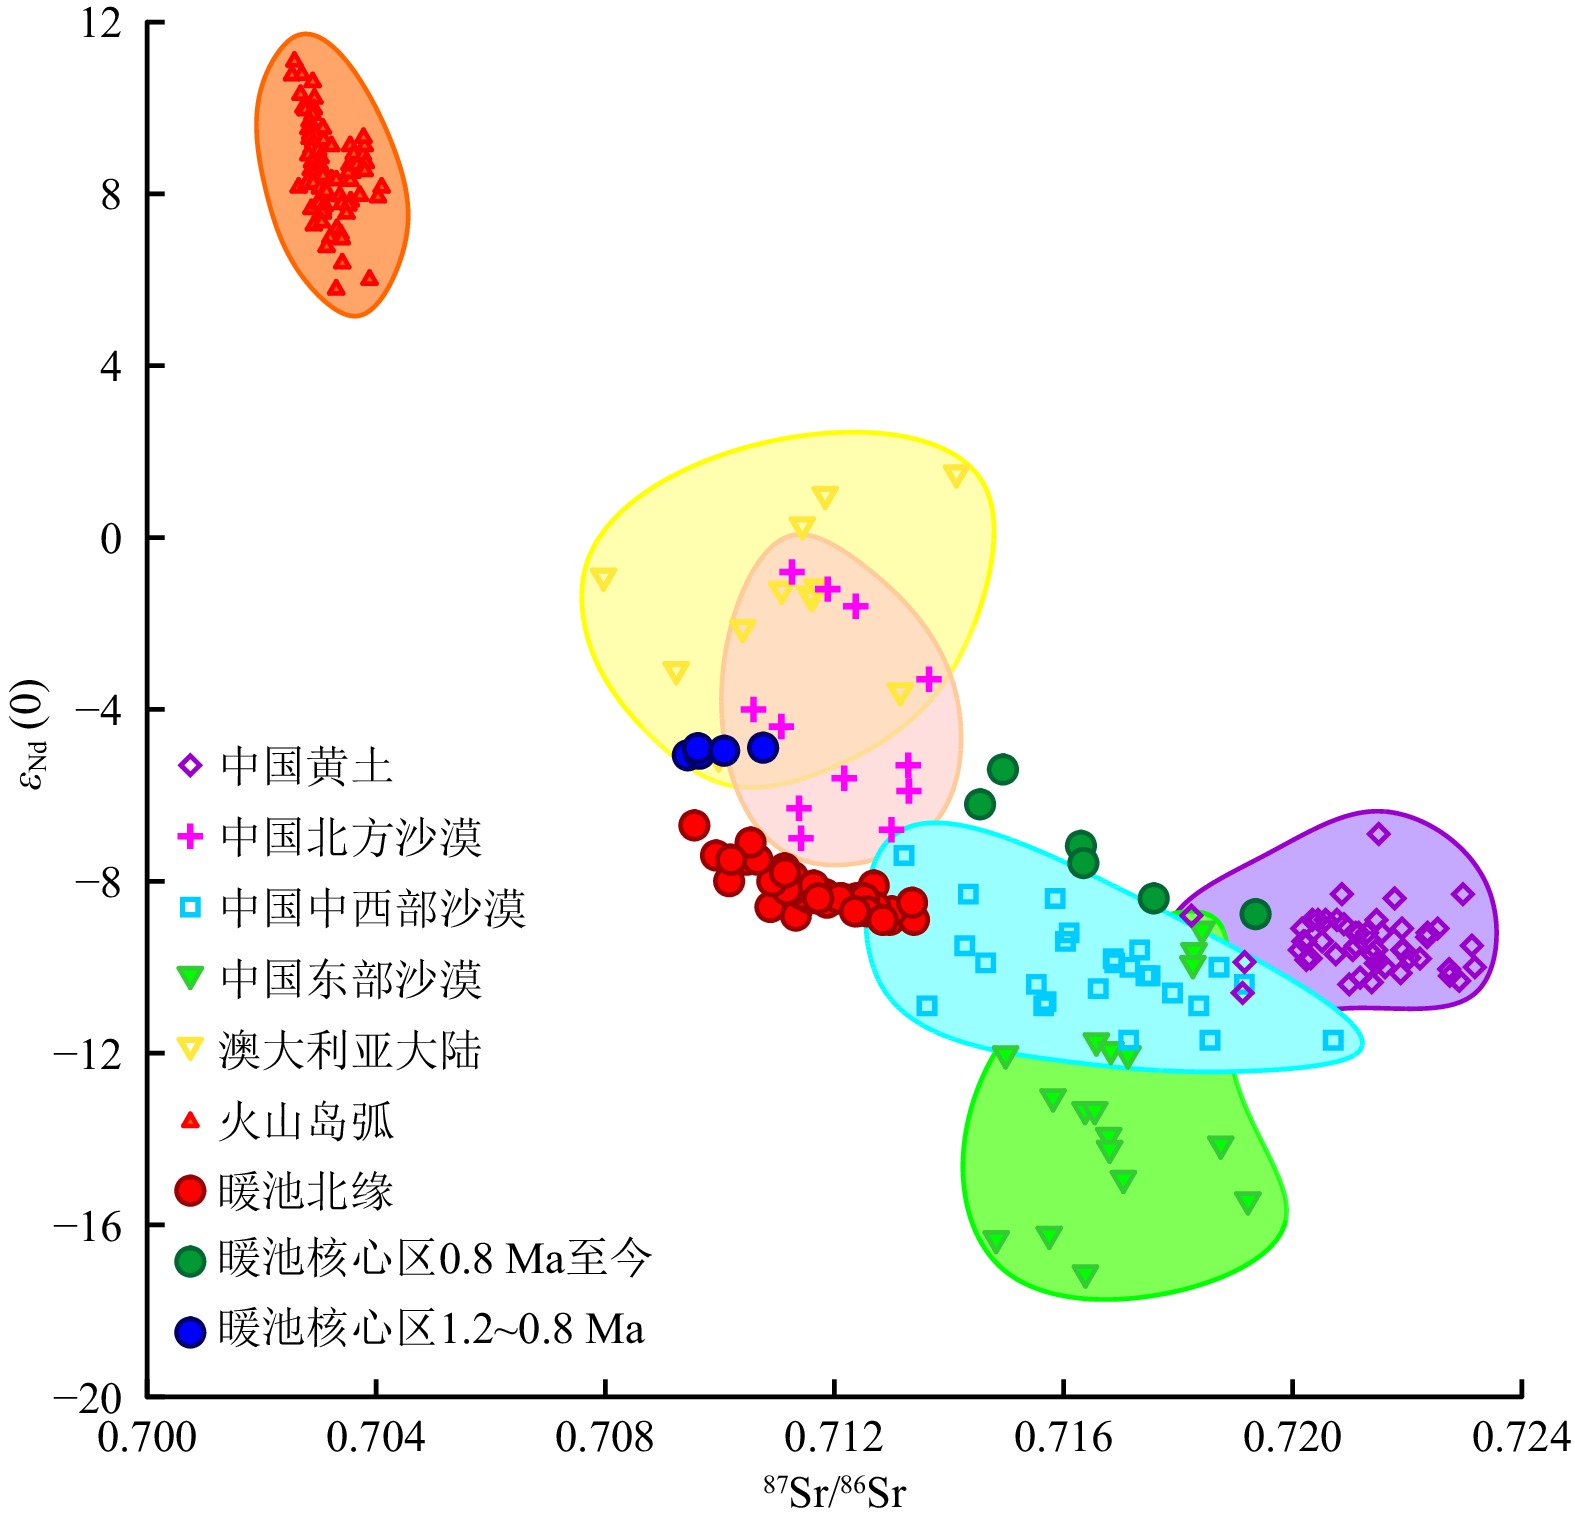
图 5 西太平洋暖池与潜在源区沉积物87Sr/86Sr-εNd (0)关系图
潜在源区包括:中国黄土[59-61]、中国北方沙漠[38]、中国中西部沙漠[38]、中国东部沙漠[38]、澳大利亚大陆[62]和火山岛弧[63-80];暖池区数据包括暖池北缘[15]和暖池核心区[16]。
Figure 5. 87Sr/86Sr vs εNd (0) values of the detrital fraction of the Western Pacific Warm Pool sediments and potential source areas
The potential source areas include Chinese Loess Plateau[59-61], northern Chinese deserts[38], western and central Chinese deserts[38], eastern Chinese deserts[38], Australia continent[62], and volcanic materials[63-80]. Western Pacific Warm Pool data include the northern margin of the Western Pacific Warm Pool[15] and the core area of the Western Pacific Warm Pool[16].
表 1 西太平洋暖池区各站位指标信息
Table 1 Core locations and palaeoclimate proxies of the Western Pacific Warm Pool sites
位置 站号 位置 代用指标 时间跨度 沉积物源区 参考文献 暖池北缘 PC631 12°30′N、134°60′E 黏土矿物 600 ka 亚洲中西部沙漠与火山岛弧 [6] 暖池北缘 MD06-3047 17°00.44′N、124°47.93′E 常量元素 700 ka 火山碎屑物质和陆源风尘物质 [10] 暖池北缘 PV090510 16°47.79′N、138°5.55′E 黏土矿物 1.95 Ma 中亚大陆和马里亚纳岛弧 [5] 暖池北缘 PV090102 17°55.24′N、135°52.68′E Sr-Nd同位素 2.1 Ma 中国中西部沙漠和火山岛弧 [15] 石英 塔克拉玛干沙漠、蒙古戈壁和
火山岛弧[9] 黏土矿物 亚洲大陆和火山岛弧 [4] 黏土矿物 中国黄土和火山岛弧 [20] 暖池北缘 表层 稀土元素 主要来源于周围火山物质,
少部分陆源[13] 暖池北缘 表层 石英 塔克拉玛干沙漠、蒙古戈壁和
火山岛弧[8] 暖池西北缘 Ph05-5 16°2.96′N、124°20.69′E Sr-Nd同位素 50 ka 中国中西部沙漠、中国黄土和吕宋岛 [14] 暖池西缘 DY12 9°11.94′N、136°8.40′E 稀土元素 22 ka 新几内亚和亚洲大陆 [11] 暖池西缘 KX21-2 1°25.01′S、157°58.91′E 黏土矿物 370 ka 新几内亚 [7] 常量元素 380 ka 新几内亚 [17] 暖池西缘 MD06-3050 15°57.09′N、124°46.77′E 黏土矿物 500 ka 中国东部沙漠、黄土和火山岛弧 [21] 暖池西缘 U1489 02°07.19′ N、141°01.67′E 常量元素、稀土元素 4 Ma 主要来源于新几内亚 [12] 暖池西缘 ODP 768
ODP 769
ODP 7718°N、121°13.158′ E
8°47.136′N、121°17.652′E
8°40.692′N、120°40.782′ ESr-Nd同位素 亚洲大陆和火山岛弧 [22] 暖池西缘 表层 87Sr/ 86Sr 亚洲大陆和火山岛弧 [23] 暖池核心 PC932 5°53’N、177°26’W Sr-Nd同位素 1.1 Ma 1.2~0.9 Ma:澳大利亚大陆和中南美洲;
0.9~0.8 Ma:亚洲大陆[16] 几乎整个
暖池区DSDP 65 04°21.21'N、176°59.16'E 常量元素、稀土元素 只给出数据,未分析源区 [24] DSDP 76 14°05.90'S、145°39.64'W DSDP 166 03°45.70'N、175°04.80'W DSDP 199 13°30.80'N、156°10.30'E DSDP 288 05°58.35'S、161°49.53'E DSDP 317 11°00.09'S、162°15.78'W ODP 807 03°36.42'N、156°37.49'E ODP 869 11°00.09'N、164°44.97'E KH68-4-18-3 01°59.5'N、170°00.5'W KH68-4-20-2 02°28.4'S、169°59.7'W KH71-5-10-2 04°58.5'S、146°03.5'W KH71-5-12-3 11°01.4'S、146°01.5'W KH73-4-5 12°23.2'N、151°48'E KH73-4-9 07°49.9'S、172°48.6'E KH80-3-30 09°50.6'N、153°13.5'E KH84-1-17A 20°05.1'N、143°35'E  下载: 导出CSV
表 2 西太平洋暖池区沉积物潜在源区的黏土矿物组成
Table 2 Clay minerals composition of the Western Pacific Warm Pool and potential provenance
下载: 导出CSV
表 3 西太平洋暖池及其潜在源区沉积物常量元素组成
Table 3 Major elements composition of sediments in the Western Pacific Warm Pool and potential provenances
% SiO2 TiO2 Al2O3 FeO Fe2O3 MnO MgO CaO Na2O K2O P2O5 LOI H2O 参考文献 太平洋中部 50.14 0.56 14.54 6.49 1.33 3.22 3.12 5.46 3.36 1.70 [48] 中北太平洋 50.30 0.52 12.50 10.0 1.85 3.52 2.08 - 3.02 0.83 [48] 51.28 0.41 7.88 5.41 0.75 2.46 14.48 - 1.57 0.47 [24] 西太平洋暖池北缘 0.59 14.06 5.99 0.20 2.84 11.75 3.37 1.54 0.03 [10] 亚洲大陆(黄土) 59.32 0.67 12.47 4.788 0.089 2.13 7.23 1.42 2.43 0.15 8.73 [49] 亚洲大陆(古土壤) 61.85 0.736 13.48 5.253 0.097 2.05 4.63 1.30 2.57 0.13 7.11 [49] 吕宋岛 57.00 0.77 18.53 7.13 0.15 2.16 6.15 3.58 0.92 1.15 1.99 1.25 [50] 新几内亚 0.71 16.37 7.55 0.27 3.02 8.84 2.93 1.62 0.22 [51] 73.73 0.53 13.81 2.87 0.11 0.64 2.325 3.34 2.51 0.15 [52] 澳大利亚 49.95 0.46 10.45 4.60 0.07 1.93 13.37 0.51 2.39 0.11 [52]
下载: 导出CSV
表 4 西太平洋暖池及其潜在源区沉积物稀土元素组成
Table 4 REE composition of sediments in the Western Pacific Warm Pool and potential provenances
10−6 西太平洋暖池 太平洋中部 中北太平洋 亚洲大陆 吕宋岛 新几内亚 澳大利亚 核心 北缘 南缘 其他 黄土 古土壤 La 19.0 102 75.9 43.3 156.62 94.79 44.37 32.31 35.47 13 11.09 1.26 Ce 21.3 67.6 41.3 58.5 100.68 95.26 41.83 64.57 57.59 27.5 22.71 2.28 Pr 4.58 29.8 19.8 12.8 37.3 28.84 12.58 8.16 9.05 4.1 2.784 0.36 Nd 20.3 123 86.3 56.4 168.8 115.44 51.66 28.14 32.04 18.4 11.96 1.57 Sm 4.52 28.6 18.1 13.3 37.68 27.61 11.84 5.70 6.62 4.53 3.02 0.39 Eu 1.21 7.15 4.64 3.35 8.16 6.73 2.92 1.12 1.35 1.4 0.94 0.10 Gd 5.04 32.6 22.1 14.7 40.42 28.97 12.96 5.11 6.18 4.89 3.27 0.51 Tb 0.89 4.81 3.32 2.24 6.74 4.38 1.94 0.79 0.95 0.73 0.53 0.08 Dy 5.22 29.9 21.9 13.7 39.49 26.61 11.99 4.57 5.53 4.34 3.39 0.47 Ho 1.11 6.15 4.79 2.72 9.02 5.3 2.43 0.93 1.12 0.95 0.72 0.10 Er 3.31 17.4 14.1 7.54 24.08 14.85 6.91 2.61 3.09 2.63 2.05 0.27 Tm 0.50 2.37 1.95 1.03 3.41 2.05 0.96 0.43 0.50 0.29 0.036 Yb 3.09 14.6 12.2 6.72 20.72 12.87 6.12 2.70 3.09 2.4 2.05 0.21 Lu 0.47 2.19 1.91 1.03 3.15 1.93 0.92 0.41 0.46 0.37 0.31 0.03 Y 39.9 186 175 70.8 334.81 144.37 68.28 29.17 34.23 28 21.05 3.60 参考文献 [24] [48] [48] [24] [49] [49] [50] [51] [58]
下载: 导出CSV
-
[1] Webster P J, Magana V O. Monsoons: Processes, predictability, and the prospects for prediction[J]. Journal of Geophysical Research-Atmospheres, 1998, 103: 14451-14510. doi: 10.1029/97JC02719
[2] Stott L, Poulsen C, Lund S, et al. Super ENSO and global climate oscillations at millennial time scales[J]. Science, 2002, 297: 222-226. doi: 10.1126/science.1071627
[3] Visser K, Thunell R, Stott L. Magnitude and timing of temperature change in the Indo-Pacific warm pool during deglaciation[J]. Nature, 2003, 421: 152-155. doi: 10.1038/nature01297
[4] 颜钰, 蒋富清, 曾志刚, 等. 近2.1 Ma以来帕里西-维拉海盆黏土矿物输入变化及其对中更新世气候转型的响应[J]. 海洋地质与第四纪地质, 2022, 42(6): 150-161 YAN Yu, JIANG Fuqing, ZENG Zhigang, et al. Variations in clay mineral input in the Parece Vela Basin since the last 2.1 Ma and their response to the mid-Pleistocene transition[J]. Marine Geology & Quaternary Geology, 2022, 42(6): 150-161.
[5] Ming J, Li A, Huang J, et al. Assemblage characteristics of clay minerals and its implications to evolution of eolian dust input to the Parece Vela Basin since 1.95 Ma[J]. Chinese Journal of Oceanology and Limnology, 2014, 32: 174-186. doi: 10.1007/s00343-014-3066-x
[6] Seo I, Lee Y I, Yoo C M, et al. Sr-Nd isotope composition and clay mineral assemblages in eolian dust from the central Philippine Sea over the last 600 kyr: Implications for the transport mechanism of Asian dust[J]. Journal of Geophysical Research-Atmospheres, 2014, 119: 11492-11504. doi: 10.1002/2014JD022025
[7] Wu J, Liu Z, Zhou C. Late Quaternary glacial cycle and precessional period of clay mineral assemblages in the Western Pacific Warm Pool[J]. Chinese Science Bulletin, 2012, 57: 3748-3760. doi: 10.1007/s11434-012-5277-x
[8] 朱潇, 蒋富清, 冯旭光, 等. 菲律宾海沉积物中石英的来源及其搬运方式[J]. 海洋与湖沼, 2018, 49(6): 1190-1202 ZHU Xiao, JIANG Fuqing, Feng Xuguang, et al. The provenance and transportation of quartz in the Philippine Sea[J]. Oceanologia et Limnologia Sinica, 2018, 49(6): 1190-1202.
[9] Yan Y, Jiang F Q, Zeng Z G, et al. Response of eolian quartz in the Parece Vela Basin sediment to the mid-Pleistocene transition[J]. Journal of Asian Earth Sciences, 2022, 236(15): 105332. doi: 10.1016/j.jseaes.2022.105332
[10] 徐兆凯, 李铁刚, 于心科, 等. 近700 ka来西菲律宾海沉积物来源和东亚冬季风演化的常量元素记录[J]. 科学通报, 2013, 58(11): 1048-1056 doi: 10.1360/csb2013-58-11-1048 XU Zhaokai, LI Tiegang, YU Xinke, et al. Sediment provenance and evolution of the East Asian winter monsoon since 700 ka recorded by major elements in the West Philippine Sea[J]. Chinese Science Bulletin, 2013, 58(11): 1048-1056. doi: 10.1360/csb2013-58-11-1048
[11] Liu J, Yan W, Xu W, et al. Sediment provenance in the western Pacific warm pool from the last glacial maximum to the early Holocene: Implications for ocean circulation and climatic change[J]. Palaeogeography Palaeoclimatology Palaeoecology, 2018, 493: 55-63. doi: 10.1016/j.palaeo.2017.12.040
[12] Peng N, Dang H, Wu J, et al. Tectonic and climatic controls on the Plio-Pleistocene evolution of sediment discharge from Papua New Guinea[J]. Marine Geology, 2021, 441: 106627. doi: 10.1016/j.margeo.2021.106627
[13] 徐兆凯, 李安春, 蒋富清, 等. 东菲律宾海沉积物的地球化学特征与物质来源[J]. 科学通报, 2008, 53: 695-702 XU Zhaokai, LI Anchun, JIANG Fuqing, et al. The geochemical characteristics and material sources in the eastern Philippine Sea[J]. Chinese Science Bulletin, 2008, 53: 695-702.
[14] Jiang F, Zhou Y, Nan Q, et al. Contribution of Asian dust and volcanic material to the western Philippine Sea overthe last 220 kyr as inferred from grain size and Sr-Nd isotopes[J]. Journal of Geophysical Research-Oceans, 2016, 121: 6911-6928. doi: 10.1002/2016JC012000
[15] Jiang F Q, Zhu X, Li T G, et al. Increased dust deposition in the Parece Vela Basin since the mid-Pleistocene inferred from radiogenic Sr and Nd isotopes[J]. Global and Planetary Change, 2019, 173: 83-95. doi: 10.1016/j.gloplacha.2018.12.011
[16] Seo I, Lee Y I, Kim W, et al. Movement of the Intertropical Convergence Zone during the mid-pleistocene transition and the response of atmospheric and surface ocean circulations in the central equatorial Pacific[J]. Geochemistry Geophysics Geosystems, 2015, 16: 3973-3981. doi: 10.1002/2015GC006077
[17] Wu J, Liu Z, Zhou C. Provenance and supply of Fe-enriched terrigenous sediments in the western equatorial Pacific and their relation to precipitation variations during the late Quaternary[J]. Global and Planetary Change, 2013, 108: 56-71. doi: 10.1016/j.gloplacha.2013.06.002
[18] Lee I T, Ogawa Y. Bottom-current deposits in the Miocene-Pliocene Misaki Formation, Izu forearc area, Japan[J]. Island Arc, 1998, 7(3): 315-329. doi: 10.1111/j.1440-1738.1998.00192.x
[19] Kawabe M, Fujio S, Yanagimoto D, et al. Water masses and currents of deep circulation southwest of the Shatsky Rise in the western North Pacific[J]. Deep Sea Research Part I: Oceanographic Research Papers, 2009, 56(10): 1675-1687. doi: 10.1016/j.dsr.2009.06.003
[20] 靳宁. 帕里西维拉海盆西北部海域粘土矿物分布特征研究[D]. 青岛: 中国科学院海洋研究所, 2006 JIN Ning. Clay mineral distribution in the sediments of the northwest Parece Vela Basin[D]. QingDao: Institute of Oceanology, Chinese Academy of Sciences, 2006.
[21] Wan S, Yu Z, Clift P D, et al. History of Asian eolian input to the West Philippine Sea over the last one million years[J]. Palaeogeography Palaeoclimatology Palaeoecology, 2012, 326-328(2): 152-159.
[22] Mahoney J B. Nd and Sr isotopic signatures of fine-grained clastic sediments: A case study of western Pacific marginal basins[J]. Sedimentary Geology, 2005, 182: 183-199. doi: 10.1016/j.sedgeo.2005.07.009
[23] Asahara Y, Tanaka T, Kamioka H, et al. Asian continental nature of 87Sr/ 86Sr ratios in North Central Pacific sediments[J]. Earth and Planetary Science Letters, 1995, 133: 105-116. doi: 10.1016/0012-821X(95)00048-H
[24] Kato Y, Fujinaga K, Nakamura K, et al. Deep-sea mud in the Pacific Ocean as a potential resource for rare-earth elements[J]. Nature Geoscience, 2011, 4: 535-539. doi: 10.1038/ngeo1185
[25] Yan X H, Ho C R, Zheng Q N. Temperature and size variabilities of the Western Pacific Warm Pool[J]. Science, 1992, 258(5088): 1643-1645. doi: 10.1126/science.258.5088.1643
[26] Rosenthal Y, Holbourn A E, Kulhanek D K, et al. Western Pacific Warm Pool[C]//Proceedings of the International Ocean Discovery Program. College Station, TX: International Ocean Discovery Program, 2018: 1-42.https://doi.org/10.14379/iodp.proc.363. 2018.
[27] Stuut J B W, De Deckker P, Saavedra-Pellitero M, et al. A 5.3-million-year history of monsoonal precipitation in northwestern Australia[J]. Geophysical Research Letters, 2019, 46(12): 6946-6954. doi: 10.1029/2019GL083035
[28] Gingele F X, Deckker P D, Hillenbrand C D. Clay mineral distribution in surface sediments between Indonesia and NW Australia——source and transport by ocean currents[J]. Marine Geology, 2001, 179: 135-146. doi: 10.1016/S0025-3227(01)00194-3
[29] Middleton A W, Uysal I T, Golding S D. Chemical and mineralogical characterisation of illite-smectite: Implications for episodic tectonism and associated fluid flow, central Australia[J]. Geochimica et Cosmochimica Acta, 2015, 148: 284-303. doi: 10.1016/j.gca.2014.09.035
[30] Baludikay B K, François C, Sforna M C, et al. Raman microspectroscopy, bitumen reflectance and illite crystallinity scale: comparison of different geothermometry methods on fossiliferous Proterozoic sedimentary basins (DR Congo, Mauritania and Australia) [J]. International Journal of Coal Geology, 2018, 191: 80-94. doi: 10.1016/j.coal.2018.03.007
[31] Liu Z, Tuo S, Colin C, et al. Detrital fine-grained sediment contribution from Taiwan to the northern South China Sea and its relation to regional ocean circulation[J]. Marine Geology, 2008, 255(3-4): 149-155. doi: 10.1016/j.margeo.2008.08.003
[32] Liu Z, Zhao Y, Colin C, et al. Chemical weathering in Luzon, Philippines from clay mineralogy and major-element geochemistry of river sediments[J]. Applied Geochemistry, 2009, 24(11): 2195-2205. doi: 10.1016/j.apgeochem.2009.09.025
[33] Wan S, Li A, Clift P D, et al. Development of the East Asian monsoon: Mineralogical and sedimentologic records in the northern South China Sea since 20 Ma[J]. Palaeogeography Palaeoclimatology Palaeoecology, 2007, 254(3-4): 561-582. doi: 10.1016/j.palaeo.2007.07.009
[34] 郑洪汉. 中国黄土中粘土矿物的古气候记录[J]. 第四纪研究, 1985, 6(2): 41-47 ZHENG Honghan. Paleoclimatic records of Clay minerals in loess, China[J]. Quaternary Sinica, 1985, 6(2): 41-47.
[35] 师育新, 戴雪荣, 李节通, 等. 末次间冰期兰州黄土记录中的粘土矿物及其环境意义探讨[J]. 海洋地质与第四纪地质, 1997, 17(1): 87-94 SHI Yuxin, DAI Xuerong, LI Jietong, et al. Origin and significance of clay minerals in the last interglacial loess in LanZhpu area, North Central China[J]. Marine Geology & Quaternary Geology, 1997, 17(1): 87-94.
[36] 师育新, 戴雪荣, 宋之光, 等. 我国不同气候带黄土中粘土矿物组合特征分析[J]. 沉积学报, 2005, 23(4): 690-695 doi: 10.3969/j.issn.1000-0550.2005.04.019 SHI Yuxin, DAI Xuerong, SONG Zhiguang, et al. Characteristics of clay mineral assemblages and their spatial distribution of Chinese loess in different climatic zones[J]. Acta Sedimentologica Sinica, 2005, 23(4): 690-695. doi: 10.3969/j.issn.1000-0550.2005.04.019
[37] Ji J, Chen J, Lu H. Luochuan area, Loess Plateau, Central China[J]. Clays and Clay Minerals, 1999, 34: 525-532. doi: 10.1180/000985599546398
[38] Chen J, Li G J, Yang J D, et al. Nd and Sr isotopic characteristics of Chinese deserts: implications for the provenances of Asian dust[J]. Geochemistry Geophysics Geosystems, 2007, 71: 3904-3914.
[39] Shen Z, Li X, Cao J, et al. Characteristics of clay minerals in asian dust and their environmental significance[J]. China Particuology, 2005, 3(5): 260-264. doi: 10.1016/S1672-2515(07)60198-5
[40] Biscaye P E. Mineralogy and sedementation of recent deep-sea clay in Atlantic ocean and adjacent seas and oceans[J]. Geological Society of America Bulletin, 1965, 76(7): 803-825. doi: 10.1130/0016-7606(1965)76[803:MASORD]2.0.CO;2
[41] Hou S S, Yang S L, Sun J M, et al. Oxygen isotope compositions of quartz grains (4-16μm) from Chinese eolian deposits and their implications for provenance[J]. Science in China Series D: Earth Sciences, 2003, 46(10): 1003-1011.
[42] Chacko T, Cole D R, Horita J. Equilibrium oxygen, hydrogen and carbon isotope fractionation factors applicable to geologic systems[J]. Reviews in Mineralogy and Geochemistry, 2001, 43(1): 1-81. doi: 10.2138/gsrmg.43.1.1
[43] Yan Y, Sun Y B, Chen H Y, et al. Oxygen isotope signatures of quartz from major Asian dust sources: Implications for changes in the provenance of Chinese loess[J]. Geochimica et Cosmochimica Acta, 2014, 139: 399-410. doi: 10.1016/j.gca.2014.04.043
[44] Sun Y B, Chen H Y, Tada R, et al. ESR signal intensity and crystallinity of quartz from Gobi and sandy deserts in East Asia and implication for tracing Asian dust provenance[J]. Geochemistry Geophysics Geosystems, 2013, 14(8): 2615-2627. doi: 10.1002/ggge.20162
[45] Taylor S R, Mclennan S M. The Continental Crust: Its composition and evolution, An examination of the geochemical record preserved in sedimentary rocks[M]. Oxford: Blackwell Scientific Publications, 1985: 1-372.
[46] Norman M D, Deckker P D. Trace metals in lacustrine and marine sediments: A case study from the Gulf of Carpentaria, northern Australia[J]. Chemical Geology, 1990, 82(3-4): 299-318.
[47] Cha H J, Choi M S, Lee C B, et al. Geochemistry of surface sediments in the southwestern East/Japan Sea[J]. Journal of Asian Earth Sciences, 2007, 29: 685-697. doi: 10.1016/j.jseaes.2006.04.009
[48] 朱克超, 任江波, 王海峰, 等. 太平洋中部富REY深海粘土的地球化学特征及REY富集机制[J]. 地球科学: 中国地质大学学报, 2015, 40(6): 1052-1060 doi: 10.3799/dqkx.2015.087 ZHU Kechao, REN Jiangbo, WANG Haifeng, et al. Enrichment mechanism of REY and geochemical characteristics of REY-Rich pelagic clay from the Central Pacific[J]. Earth Science: Journal of China University of Geosciences, 2015, 40(6): 1052-1060. doi: 10.3799/dqkx.2015.087
[49] Gallet S, Jahn B, Torii M. Geochemical characterization of the Luochuan loess-paleosol sequence, China, and paleoclimatic implications[J]. Chemical Geology, 1996, 133(1-4): 67-88. doi: 10.1016/S0009-2541(96)00070-8
[50] Marini J C, Chauvel C, René C M. Hf isotope compositions of northern Luzon arc lavas suggest involvement of pelagic sediments in their source[J]. Contributions to Mineralogy & Petrology, 2005, 149(2): 216-232. doi: 10.1007/s00410-004-0645-4
[51] 林刚, 陈琳莹, 罗敏, 等. 西太平洋新不列颠海沟表层沉积物的地球化学特征及其物源指示[J]. 海洋地质与第四纪地质, 2019, 39(3): 12-27 LIN Gang, CHEN Linying, LUO Min, et al. The geochemical characteristics of the surface sediments in the New Britain Trench of the Western Pacific Ocean and their implications for provenance[J]. Marine Geology & Quaternary Geology, 2019, 39(3): 12-27.
[52] Horz K H, Worthington T J, Winn K, et al. Late Quaternary tephra in the New Ireland Basin, Papua New Guinea[J]. Journal of Volcanology & Geothermal Research, 2004, 132(1): 73-95. doi: 10.1016/S0377-0273(03)00421-9
[53] 徐兆凯, 李安春, 李铁刚, 等. 东菲律宾海表层沉积物常量元素组成及地质意义[J]. 海洋地质与第四纪地质, 2010, 30(6): 43-48 XU Zhaokai, LI Anchun, LI Tiegang, et al. Major element compositions of surface sediments in the east Philippine Sea and its geologica implication[J]. Marine Geology & Quaternary Geology, 2010, 30(6): 43-48.
[54] 徐兆凯, 常凤鸣, 李铁刚, 等. 24ka来冲绳海槽北部沉积物来源的高分辨率常量元素记录[J]. 海洋地质与第四纪地质, 2012, 32(4): 73-82 XU Zhaokai, CHANG Fengming, LI Tiegang, et al. Provenance of sediments in the northern Okinawa Trough over the last 24 ka: high resolution record from major elements [J]. Marine Geology & Quaternary Geology, 2012, 32(4): 73-82.
[55] Rollinson H R. Using geochemical data: evalution, presentation, interpretation[M]. Singapore: Longman Singapur Press, 1993: 1-343.
[56] 蓝先洪, 张志珣, 王中波, 等. 东海外陆架晚第四纪沉积物的稀土元素组成及物源示踪[J]. 地球学报, 2014, 35(3): 305-313 LAN Xianhong, ZHANG Zhixun, WANG Zhongbo, et al. Distribution of rare earth elements in late Quaternary sediments on the outer shelf of the East China Sea and their source tracing[J]. Acta Geoscientia Sinica, 2014, 35(3): 305-313.
[57] 曹鹏, 石学法, 李魏然, 等. 安达曼海东南部海域表层沉积物稀土元素特征及其物源指示意义[J]. 海洋地质与第四纪地质, 2015, 35(5): 57-67 CAO Peng, SHI Xuefa, LI Weiran, et al. Rare earth element geochemistry of surface sediments in southeastern Andaman Sea and implications for provenance[J]. Marine Geology & Quaternary Geology, 2015, 35(5): 57-67.
[58] Janssen C, Laube N, Bau M, et al. Fluid regime in faulting deformation of the Waratah Fault Zone, Australia, as inferred from major and minor element analyses and stable isotopic signatures[J]. Tectonophysics, 1998, 294(1-2): 109-130. doi: 10.1016/S0040-1951(98)00127-9
[59] Sun Y, An Z. Late Pliocene-Pleistocene changes in mass accumulation rates ofeolian deposits on the central Chinese Loess Plateau[J]. Journal of Geophysical Research, 2005, 110: D23101. doi: 10.1029/2005JD006064
[60] Wang Y X, Yang J D, Chen J, et al. The Sr and Nd isotopicvariations of the Chinese Loess Plateau during the past 7 Ma: implications for the EastAsian winter monsoon and source areas of loess[J]. Palaeogeography Palaeoclimatology Palaeoecology, 2007, 249: 351-361. doi: 10.1016/j.palaeo.2007.02.010
[61] Chen Z, Li G. Evolving sources of eolian detritus on the Chinese Loess Plateausince early Miocene: Tectonic and climatic controls[J]. Earth and Planetary Science Letters, 2013, 371-372: 220-225. doi: 10.1016/j.jpgl.2013.03.044
[62] Deckker D P. Airborne dust traffic from Australia in modern and Late Quaternary times[J]. Global and Planetary Change, 2020, 184: 103056. doi: 10.1016/j.gloplacha.2019.103056
[63] Bloomer S H, Hawkins J W. Petrology and geochemistry of boninite seriesvolcanic rocks from the Mariana Trench[J]. Contributions to Mineralogy and Petrology, 1987, 97: 361-377. doi: 10.1007/BF00371999
[64] Brounce M N, Kelley K A, Cottrell E. Variations in Fe3+ /ΣFe of Mariana arcbasalts and mantle wedgeƒO2[J]. Journal of Petrology, 2014, 55(12): 2513-2536. doi: 10.1093/petrology/egu065
[65] Fryer P B, Sinton J M, Philpotts J A. Basaltic glasses from the Mariana Trough [C]//Initial Reports of the Deep Sea Drilling Project, 60. Washington: US Government Printing Office, 1981: 601-609.
[66] Gribble R F, Stern R J, Bloomer S H, et al. MORB mantle and subduction components interact to generate basalts in thesouthern Mariana Trough back-arc basin[J]. Geochimica et Cosmochimica Acta, 1996, 60: 2153-2166. doi: 10.1016/0016-7037(96)00078-6
[67] Gribble R F, Stern R J, Newman S, et al. Chemical andisotopic composition of lavas from the northern Mariana Trough: implications formagmagenesis in back-arc basins[J]. Journal of Petrology, 1998, 39: 125-154. doi: 10.1093/petroj/39.1.125
[68] Hart S R, Glassley W E, Karig D E. Basalts and sea foor spreading behind theMariana island arc[J]. Earth and Planetary Science Letters, 1972, 15: 12-18. doi: 10.1016/0012-821X(72)90023-4
[69] Hawkins J W, Lonsdale P F, Macdougall J D, et al. Petrology of theaxial ridge of the Mariana Trough back-arc spreading center[J]. Earth and Planetary Science Letters, 1990, 100: 226-250. doi: 10.1016/0012-821X(90)90187-3
[70] Lonsdale P, Hawkins, J. Silicic volcanism at an of-axis geothermal feld inthe Mariana Trough back-arc basin[J]. Geological Society of America Bulletin, 1985, 96: 940-951. doi: 10.1130/0016-7606(1985)96<940:SVAAOG>2.0.CO;2
[71] Mattey D P, Marsh N G, Tarney J. The geochemistry, mineralogy and petrologyof basalts from the west Philippine and Parece Vela Basins and from the Palau-Kyushuand West Mariana Ridges, deep sea drilling Project Leg 59[C]//Initial Reports of the Deep Sea Drilling Project, 59. Washington: US Government Printing Office, 1981: 753-802.
[72] Pearce J A, Stern R J, Bloomer S H, et al. Geochemical mapping of theMariana arc-basin system: implications for the nature and distribution of subduction components[J]. Geochemistry Geophysics Geosystems, 2005, 6(7): 542-557.
[73] Reagan M K, Meijer A. Geology and geochemistry of early arc-volcanic rocksfrom Guam[J]. Geological Society of America Bulletin, 1984, 95: 701-713. doi: 10.1130/0016-7606(1984)95<701:GAGOEA>2.0.CO;2
[74] Sinton J M, Fryer P B. Mariana Trough lavas from 18°N: implications for theorigin of back arc basin basalts[J]. Journal of Geophysical Research, 1987, B92: 12782-12802.
[75] Stern R J, Morris J D, Bloomer S M, et al. The source of the sub-duction component in convergent margin magmas: trace element and radiogenicisotope evidence from Eocene boninites, Mariana forearc[J]. Geochimica et Cosmochimica Acta, 1991, 55: 1467-1481. doi: 10.1016/0016-7037(91)90321-U
[76] Stern R J, Tamura Y, Masuda H, et al. How the Mariana volcanic arc ends in the south[J]. Island Arc, 2013, 22: 133-148. doi: 10.1111/iar.12008
[77] Straub S M. Contrasting compositions of Mariana Trough fallout tephra and Mariana island arc volcanics: a fractional crystallization link[J]. Bulletin of Volcanology, 1995, 57: 403-421. doi: 10.1007/BF00300985
[78] Straub S M. Multiple sources of quaternary tephra layers in the Mariana Trough[J]. Journal of Volcanology and Geothermal Research, 1997, 76: 251-276. doi: 10.1016/S0377-0273(96)00075-3
[79] Volpe A M, Macdougall J D, Hawkins J W. Mariana Trough basalts (MTB) traceelement and Sr-Nd isotopic evidence for mixing between MORB-like and Arc-likemelts[J]. Earth and Planetary Science Letters, 1987, 82: 241-254. doi: 10.1016/0012-821X(87)90199-3
[80] Volpe A M, Macdougall J D, Lugmair G W, et al. Fine-scale isotopic variation in Mariana Trough basalts: evidence for heterogeneity and arecycled component in backarc basin mantle[J]. Earth And Planetary Science Letters, 1990, 100: 251-264. doi: 10.1016/0012-821X(90)90188-4

计量
- 文章访问数: 220
- HTML全文浏览量: 54
- PDF下载量: 35
