Heinrich-5Event revealed by high-resolution grain-size and magnetic susceptibility records and its significance of climate evolution in the last glacial at Hongtong, Shanxi, China
-
摘要: 源于北大西洋的末次冰期千年尺度波动的Heinrich事件在东亚地区不同气候记录中得到较为广泛的识别。但是, 哪一次事件对东亚乃至北半球影响最显著还不清楚。山西临汾盆地作为中国东部的山间盆地保存了较为广泛的黄土沉积。本次研究对山西洪洞县洞峪沟剖面末次冰期厚10.5m的黄土进行光释光测年, 0.5cm间距的粒度测量、磁化率测量。结果显示, 该剖面跨越67.7~13.0ka, 粒度和磁化率记录所反映的气候特征可以以H5事件(47.3ka)为分界点分为前后两个时期。其中, 早期(67.7~47.3ka)粗粉砂(20~63μm)和砂含量(> 63μm)整体较低而磁化率较高, 反映该时期亚洲冬季风较弱而夏季风较强; 晚期(47.3~13.0ka)粗粉砂含量和砂含量整体较高而磁化率较低, 反映该时期亚洲冬季风明显增强而夏季风明显减弱。山西洪洞以H5事件(约47.3ka)为分界点的末次冰期气候演化模式在东亚、东地中海乃至北美均可以对比, 可能是北极地区冰量在这一时期得到显著发展, 导致东亚乃至北半球气候向寒冷方向发生显著变化。这一认识对理解东亚MIS3气候演化趋势具有一定意义。Abstract: The millennial-scale fluctuations of Heinrich events during the last glacial stage initiated from the North Atlantic have been widely discovered in East Asia.However, which event has the most remarkable impact on East Asia or even the Northern Hemisphere remains unclear.There are widely distributed loess deposits, the best climate proxies, in the Linfen Basin, Shanxi province.In this study, we collected OSL dating samples and powder samples at a 0.5 cm intervals to analyze grain size and magnetic susceptibility for a 10.5 m thick loess sequence at Dongyugou of Hongtong, Shanxi.Dating results show that the section is in an age range from67.7~13.0 ka.Grain size and susceptibility data suggest an obvious H5 climate event of the last glacial at the depth of 47.3 ka.Therefore, this cores could be divided into two parts.In the early time (67.7~47.3 ka), the content of coarse silt (20~63μm) and sand fraction (> 63μm) was overall low, but magnetic susceptibility was relatively high.On the contrary, in the later time (47.3~13.0 ka), the content of coarse silt and sand fractions increases, while magnetic susceptibility is low.This implies that Asian winter monsoon was weak and summer monsoon was strong in the early time, while in the later period, Asian winter monsoon substantially enhanced and summer monsoon significantly weakened.The evolution models of last glacial climate demarcated by H5 (~ 47.0 ka) are comparable in East Asia, Eastern Mediterranean and even North America.It is supposed that ice accumulation in the Arctic in this period led to climate changed colder in East Asia and the Northern Hemisphere.This cognition plays an important role in deep understanding of the evolution trend of MIS3 climate in East Asia.
-
Keywords:
- grain-size /
- magnetic susceptibility /
- OSL /
- loess /
- H5 event /
- Linfen Basin
-
格陵兰冰心[1-3]和北大西洋钻孔沉积[4, 5]记录了末次冰期气候的显著变化, 以冰山卸载进入北大西洋产生大量冰筏碎屑为特征[6]。这些千年尺度的气候变化称为Heinrich事件。后来的研究证实, 这些事件在我国的黄土高原黄土沉积、植硅石气候重建和南京葫芦洞石笋氧同位素记录中均有显示, 主要表现为夏季风减弱引起石笋氧同位素明显偏正[7]、基于植硅石重建的年均温和年均降雨量明显降低[8]以及冬季风增强引起黄土高原风化明显减弱[9]、中粗粉砂百分含量[10-12]和石英平均粒径[10]明显增加。可见, 末次冰期发生于北大西洋的Heinrich事件对东亚冬季风和夏季风都产生了显著影响。
在末次冰期6次Heinrich事件(H1—H6)中, H3和H6不同于其他几次Heinrich事件, 表现为钻孔沉积物中H1、H2、H4和H5的冰筏碎屑通量非常高, 而H3和H6的冰筏碎屑仅有微弱的增加[6, 13, 14, 15]。据此, Gwiazda等[16]认为H3和H6是较弱或不明显的冰筏碎屑事件[17]。但是, 最近的研究证实, H3事件对俄罗斯库页岛[18]、日本西部琵琶湖[19, 20]、浙江舟山考古遗址的潮间带[21]和台湾投射盆地[22]均产生了显著影响, 导致这些地区的气候在此期间更为寒冷干旱。但是, 末次冰期Heinrich事件对以我国为主的东亚气候的影响还不清楚, 空间上需要对更多准确定年的记录开展高分辨率研究。
在国内, 紧邻黄土高原东南部地区的山西南部-河南北部的山间盆地中常见保存较好的粉尘沉积记录[23, 24]。这些黄土剖面沉积以连续性较好和堆积速率相对较高为特征。我们对山西洪洞洞峪沟黄土剖面开展了光释光定年和高分辨率粒度与磁化率研究, 旨在探讨末次冰期以来哪一次Heinrich事件对东亚气候造成显著影响, 这对更好认识MIS3东亚气候演化规律和受控机制具有重要意义。
1. 地理与地质背景
临汾盆地位于山西南部, 是中国东部的一个山间盆地, 属于半干旱-半湿润季风气候。受地形影响, 山区平川气候差异较大, 主要表现为春季干旱多风, 夏季酷热多雨, 秋季有时阴雨连绵, 冬季寒冷干燥。以临汾气象台站1971—2000年间的观测数据来看, 年均温为12.6℃, 月平均最高温和最低温分别为26.1℃和-2.7℃。降水量最高在7月, 为119.2mm, 最低在1月, 为3.3mm。年平均降水量为468.5mm, 主要集中于6—9月(68.8%)。
临汾盆地位于鄂尔多斯块体东南缘, 作为山西断陷盆地带一系列新生代断陷盆地之一, 临汾盆地总体走向为北北东向。盆地的西侧为罗云山, 东侧为霍山, 北端为与太原盆地隔开的灵石突起, 南部为与运城盆地隔开的峨眉台地。盆地的中部为广阔的河谷平原, 汾河干流纵横南北(图 1)。盆地边缘和内部发育了两组不同的断裂, 一组是北北东—北东向, 限制了盆地的东西边界; 另一组是近东西—北西向, 限制了盆地的南北端, 同时影响了盆地内部凹陷和凸起的发育, 使盆地呈不规则的梯形[25-27]。晚新生代以来, 断陷构造活动强烈, 使得盆地不断地接受沉积, 在盆地内部形成了湖积、坡积、冲积、洪积等类型沉积, 在盆地的北部和南部的山地与平原的接壤地带, 还广泛分布了第四纪尤其是晚第四纪以来的黄土堆积。通过古生物、粒度、磁化率等研究, 认为万镇安王绪剖面(距洪洞洞峪沟剖面约30km)地层为下更新统午成黄土(厚度为17.1m)、中更新统离石黄土(32.8m)和上更新统马兰黄土(7.55m) [28]。
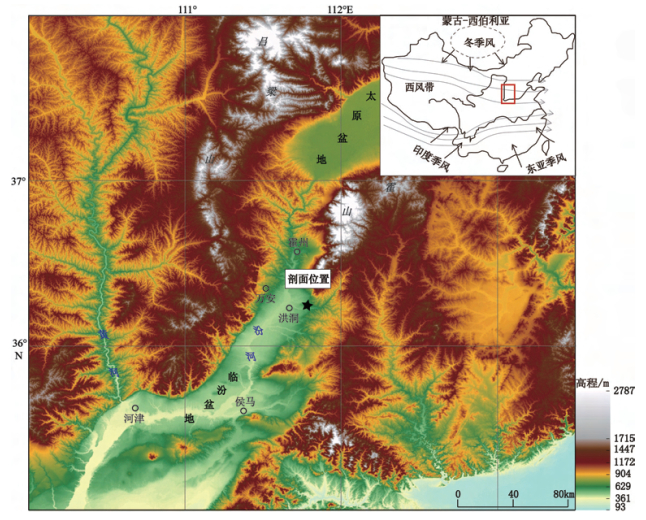
![]() 图 1 研究区地貌和水系分布(五角星表示研究剖面的地理位置, 右上插图显示我国主要气候系统组成, 包括印度季风、东亚夏季风、东亚冬季风和西风环流, 红色框显示研究区位置)Figure 1. The DEM map showing the geomorphology and drainage system of the study areaPentagram indicates the locality of the studied section.Illustration at the top right displays the climate system of China including the Indian monsoons, the East Asian summer monsoon, the winter monsoon, and the westerlies.Red rectangle shows the locality of studied area
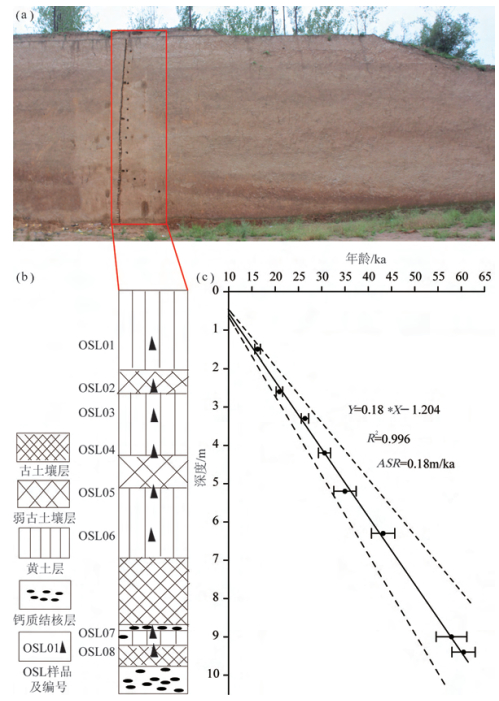
图 1 研究区地貌和水系分布(五角星表示研究剖面的地理位置, 右上插图显示我国主要气候系统组成, 包括印度季风、东亚夏季风、东亚冬季风和西风环流, 红色框显示研究区位置)Figure 1. The DEM map showing the geomorphology and drainage system of the study areaPentagram indicates the locality of the studied section.Illustration at the top right displays the climate system of China including the Indian monsoons, the East Asian summer monsoon, the winter monsoon, and the westerlies.Red rectangle shows the locality of studied area本次研究的剖面位于临汾盆地的东北部, 山西洪洞县境内的洞峪沟村附近, 地理坐标为36°16′44.07″N、111°47′29.67″E, 海拔高度为616m。洞峪沟剖面走向为325°, 长60m, 厚10.5m。自下而上共发育4层古土壤, 其中下面两层相对发育较强, 表现为颜色较红, 在古土壤层下面分别发育了15和70cm的钙质结核层(图 2)。据此, 我们将该剖面初步划分为两部分, 上部0~6.92m颜色相对较浅, 主要包括两层发育很弱的古土壤层(2~2.7和4.3~5.1m)和三层黄土层(0~2、2.7~4.3和5.1~6.92m)。下部颜色相对较深, 底部发育两层钙质结核, 主要包括发育较剖面上部两层较好的两层古土壤层(6.92~8.65和9.2~9.8m)和两层钙质结核层(8.65~8.8和9.8~10.5m), 中间夹一层薄层黄土(8.8~9.2m); 其中钙质结核层中结核粒径为3~6cm, 含量为40%~60%, 结核中间主要被粉砂充填(图 2)。在野外, 我们对研究剖面开展表面清理和细致观察。然后, 在新鲜面上自上而下依次采集了光释光定年样品和高密度粒度、磁化率样品。自上而下以0.7~2.9m不等间距采集并测试了8个光释光测年样品(表 1)。每个光释光样品都采用钢管打入的方式采集, 首先将不锈钢管打入新鲜面30cm, 然后取出, 迅速用锡箔纸和胶带封上顶底以防曝光和含水量散失, 最后编号并迅速放入厚层黑塑料袋封存。粒度和磁化率样品的采集, 均以0.5cm为间隔, 在0.75~10.5m之间共采集1950个样品。顶部0.75m疑受人类活动影响未采样(图 2)。
![]() 图 2 山西洪洞县洞峪沟黄土剖面沉积速率a.洞峪沟剖面照片, 图中红框内的圆洞为OSL采样点, 垂直凹槽为粒度和磁化率采样位置; b.岩性柱状图; c.年龄与深度关系Figure 2. The sedimentation rate of the Dongyugou loess section, at Hongtong, ShanxiPhotograph of the Dongyugou section(a), Round holes in the Red rectangle represent OSL sampling points, and the vertical groove represents sampling location for grain size and magnetic susceptibility.Photograph of lithological column (b), and the relationship of age and depth (c)表 1 山西洪洞县洞峪沟剖面光释光年龄Table 1. OSL ages at Dongyugou section in Hongtong, Shanxi
图 2 山西洪洞县洞峪沟黄土剖面沉积速率a.洞峪沟剖面照片, 图中红框内的圆洞为OSL采样点, 垂直凹槽为粒度和磁化率采样位置; b.岩性柱状图; c.年龄与深度关系Figure 2. The sedimentation rate of the Dongyugou loess section, at Hongtong, ShanxiPhotograph of the Dongyugou section(a), Round holes in the Red rectangle represent OSL sampling points, and the vertical groove represents sampling location for grain size and magnetic susceptibility.Photograph of lithological column (b), and the relationship of age and depth (c)表 1 山西洪洞县洞峪沟剖面光释光年龄Table 1. OSL ages at Dongyugou section in Hongtong, Shanxi样品编号 埋深/m α计数率/Counts • ks-1 K2O/% 实测含水量/% 环境剂量率/Gy • ka-1 等效剂量/Gy 年龄/ka OSL01 1.5 93±0.3 2.06 1.6 3.4±0.2 54.3±1. 16.2±0.6 OSL02 2.6 10.4±0.3 2.41 1.2 3.8±0.2 78.6±18 20.9±0.7 OSL03 3.3 10.6±0.3 2.18 1.1 3.5±0.2 92.0±2.1 26.4±0.8 OSL04 4.2 10.8±0.3 2.44 1.8 3.8±0.2 117.4±4.2 30.6±1.3 OSL05 5.2 11.4±0.4 2.32 1.5 3.8±0.2 131.4± 8. 35.0±2.4 OSL06 6.3 10.8±0.4 2.36 1.0 3.6±0.2 157.5±8.6 43.2±2.5 OSL07 9 11.1±0.3 2.62 1.6 3.9±0.2 223.2±12.3 57.9±3.3 OSL08 9.4 9.5±0.3 2.37 2.2 3.4±0.2 208.4±7.8 60.5±2.5 2. 实验方法
光释光分析测试在地震动力学国家重点实验室的释光实验室(中国地震局地质研究所)完成。样品分析测试按照目前较为成熟的流程进行[29], 主要包括前处理、光释光等效剂量(ED)和环境剂量率测试、数据处理4个部分。前处理过程主要在实验室内的弱红光下进行。首先去掉钢管两端约5cm可能曝光的部分, 取出钢管中部新鲜样品放在烧杯里面, 依次用浓度为30%的H2O2以及37%的HCl去除有机质和碳酸盐类。待反应充分后, 加入氨水中和, 并使用纯净水将样品反复冲洗至中性。接下来, 用静水沉降法分离出粒径为4~11μm的颗粒组分, 将这些细颗粒的组分用氟硅酸刻蚀3~5天, 以获得纯净的细颗粒石英。分离出来的石英颗粒经红外释光进行检测确保没有来自长石的释光信号[30]。等效剂量的测试采用简单多片再生法, 光释光信号测量在Risϕ-DA-20自动测量系统上完成。激发光源分别为波长470±5nm的蓝光束和880±60nm的红外线束。我们采用厚源α计数测量U和Th的贡献[31]。K含量通过火焰光度计测量。含水量通过105℃烘干24h前后的样品质量差值获得(表 1)。宇宙射线对剂量率的贡献通过样品的埋深和海拔高度进行计算[32]。
粒度分析测试在中国地震局活动构造与火山重点实验室的粒度分析实验室(中国地震局地质研究所)完成。测试仪器为美国麦克奇S3500系列激光粒度分析仪, 测量范围为0.02~2800μm, 测量精度达到0.6%。测试过程包括两个部分:前处理和粒度测量。前处理阶段, 首先加入10~15mL 10%的双氧水溶液, 加热并搅拌, 去除有机质, 然后加入10mL 10%的稀盐酸溶液除去碳酸盐; 粒度测量阶段, 首先在测试之前加入10mL 0.05mol/L的(NaPO3) 6分散剂, 并在超声波中振荡10min, 然后在S3500激光粒度仪上进行测量。
磁化率测量相对简单, 样品自然晾干以后, 每个样品称取10g, 在英国制造的Bartington MS2磁化率仪上进行低频(0.47kHz)的磁化率测定。每个样品测量5次, 取平均值。
3. 结果
在分析各种不同的地质记录之前, 确定其年龄是前提和基础。在这一部分, 我们先介绍光释光测年结果, 然后根据光释光测年结果对粒度和磁化率样品进行线性内插, 获得每一个样品的年龄。在获得每个样品年龄的基础上, 介绍粒度和磁化率记录随时间的变化特征。
3.1 光释光测年
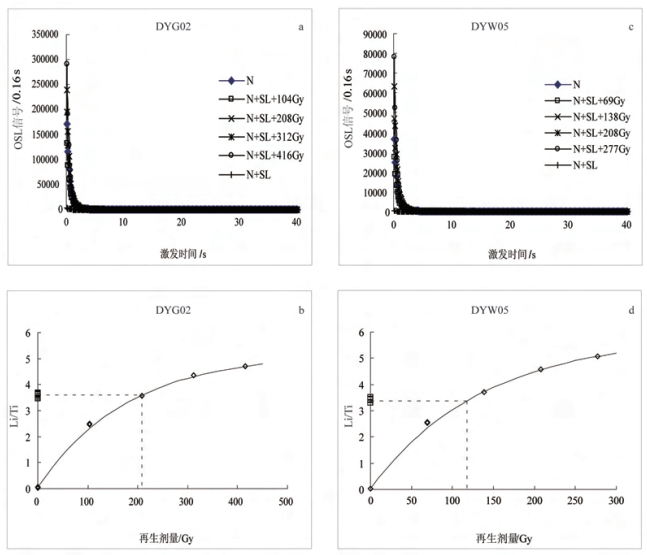
本次研究对山西洪洞县洞峪沟剖面厚10.5m的末次冰期黄土沉积开展光释光测年。图 3给出了两个代表样品的生长和衰退曲线, 反映该剖面的样品具有较好的光释光信号。结合含水量、α计数测量的U-Th贡献以及K含量测量, 我们获得了8个样品的可靠年龄结果, 跨越末次冰期(60.5±2.5) ~ (16.2±0.6) ka。这8个样品的年龄与深度具有很好的线性关系(图 2和表 1)。线性拟合, 得到洞峪沟剖面跨越的时段为67.7~13.0ka, 平均沉积速率为0.18±0.03m/ka。考虑到高分辨率采集粒度和磁化率样品的间距为0.5±0.1cm, 根据沉积速率换算, 我们的粒度和磁化率样品的时间分辨率达到27.8±5.5a。这为我们检测末次冰期北大西洋千年尺度Heinrich事件对东亚气候与环境的影响提供了可能。
![]() 图 3 两个代表样品(DYG02和DYW05)的生长与衰退曲线a、b为DYG02样品光释光信号衰减曲线及光释光等效剂量生长曲线; c、d为DYW05样品光释光信号衰减曲线及光释光等效剂量生长曲线Figure 3. OSL growth curves and decay curves for two representative samples (DYG02and DYW05)Decay curves of OSL signal intensity (a and c).Growth curves of simplified multiple-aliquot regeneration (SMAR) (b and d)
图 3 两个代表样品(DYG02和DYW05)的生长与衰退曲线a、b为DYG02样品光释光信号衰减曲线及光释光等效剂量生长曲线; c、d为DYW05样品光释光信号衰减曲线及光释光等效剂量生长曲线Figure 3. OSL growth curves and decay curves for two representative samples (DYG02and DYW05)Decay curves of OSL signal intensity (a and c).Growth curves of simplified multiple-aliquot regeneration (SMAR) (b and d)3.2 高分辨率粒度和磁化率记录
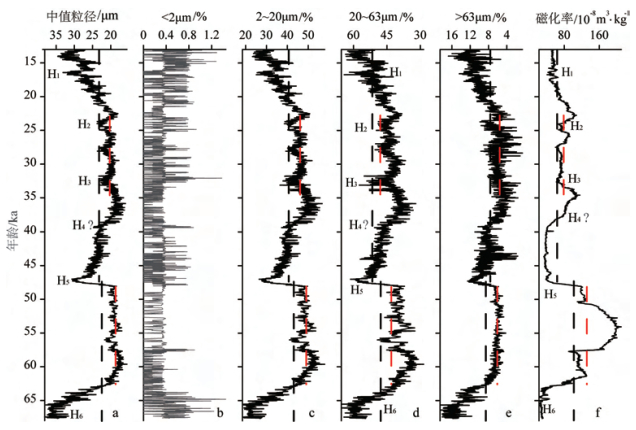
洞峪沟剖面的粒度和磁化率记录呈现两个阶段, 早期(67.7~47.3ka)和晚期(47.3~13.0ka)。早期的平均粒度比较细, 各粒度组分含量波动小; 磁化率平均值比较高, 也比较稳定。晚期的粒度偏粗, 波动更加频繁; 磁化率值明显降低(图 4)。
![]() 图 4 洞峪沟剖面的粒度各组分含量变化与磁化率记录(虚线表示平均值)Figure 4. The grain-size distribution and SUS record of Dongyugou section (Dotted line shows mean grain-size)
图 4 洞峪沟剖面的粒度各组分含量变化与磁化率记录(虚线表示平均值)Figure 4. The grain-size distribution and SUS record of Dongyugou section (Dotted line shows mean grain-size)该剖面黄土沉积的早期(67.7~47.3ka)大致对应MIS3的早期, 根据粒度各组分和磁化率变化可以进一步划分为3个阶段。早期阶段(67.7~62.5ka)受中粗粉砂(43.4%~65.5%, 平均55.5%)和砂组分(7.5%~18.6%, 平均13.5%)含量高的影响, 中值粒径(Md)达到整个剖面记录的最高值(19.5~38.2μm, 平均30.6μm), 据最近的Heinrich事件时间框架[17, 33]可能对应H6事件。这一阶段细粉砂(2~20μm)组分和磁化率均显示低值, 分别变化于18.4%~47.7%和(22.5~98.3) ×10-8 m3kg-1, 平均值为30.7%和35.1×10⁻⁸m3kg-1。中期阶段(62.5~48.1ka)是整个记录粒度最细和磁化率最高的阶段, 且很稳定。中值粒径(Md)受中粗粉砂组分(36.8%~52.9%, 平均44.2%)和砂组分(4.2%~8.9%, 平均6.3%)影响, 变化于15.6~21.7μm之间, 平均18.7μm。细粉砂和磁化率显示高值, 分别变化于41.0%~57.9%和(74.5~209.7) ×10-8 m3kg-1之间, 平均值分别为49.2%和130.9×10⁻⁸ m3kg-1。晚期阶段(48.1~47.3ka)以中值粒径(Md) (19.6~30.5μm, 平均25.2μm)持续增大和磁化率((114.1~42.8) ×10-8 m3kg-1, 平均71.4×10⁻⁸ m3kg-1)持续降低为特征, 可能对应H5事件。
研究剖面黄土沉积的晚期(47.3~13ka)大致对应MIS3中期至MIS2晚期。根据粒度各组分的含量和磁化率变化特征可进一步划分为3个阶段。早期阶段(47.3~6.5ka)以中值粒径(Md) (16.2~30.7μm, 平均23.9μm)持续减小为特征。中粗粉砂(40.5%~62.3%, 平均值52.3%)和砂含量(1.6%~12.6%, 平均值8.3%)总体减小而细粉砂含量(26.5%~55.5%, 平均值39.1%)总体增加。这一时期磁化率总体显示低值((33.4~85.0) ×10-8m3kg-1, 平均值44.2×10⁻⁸ m3kg-1)。值得注意的是, 在39.4ka前后, 中粗粉砂含量显示短暂增加, 可能对应H4事件。这一时期的中期阶段(36.5~22.5ka)是这一时期相对稳定且粒度偏细、磁化率偏高的阶段。受中粗粉砂(39.6%~59.2%, 平均值48.1%)和砂含量(0.6%~9.9%, 平均值5.7%)变化的影响, 中值粒径(Md)在16.0~23.8μm之间波动, 平均值为20.2μm。磁化率较早期阶段明显增加, 变化于(60.0~115.7) ×10-8 m3kg-1之间, 平均值为79.6×10⁻⁸ m3kg-1。在32.5和24.0ka前后, 中粗粉砂含量显示相对高值而磁化率显示相对低值, 可能分别对应H3和H2事件。晚期阶段(22.5~13.0ka)以中值粒径(Md) (18.1~34.5μm, 平均值26.4μm)、中粗粉砂含量(44.4%~64.5%, 平均值54.0%)和砂含量(4.0%~14.8%, 平均值10.1%)总体上持续增加为特征, 磁化率持续降低((40.8~102.7) ×10-8 m3kg-1, 平均值61.9×10⁻⁸ m3kg-1)。在16.8ka前后中粗粉砂含量达到该时期的相对高值而磁化率出现低值, 可能对应H1事件。
值得注意的是, 洞峪沟剖面黄土沉积物中的黏土组分(< 2μm)含量整体上很低(0~1.5%, 平均0.3%)。该组分在剖面沉积的早期(67.7~47.3ka)尤其是62.5~48.1ka期间显示明显低值(一般低于0.4%), 而在剖面沉积的中晚期显示相对高值。不过, 因为总体含量很低, 显示黏土组分在该剖面变化较小(图 4b)。
4. 讨论
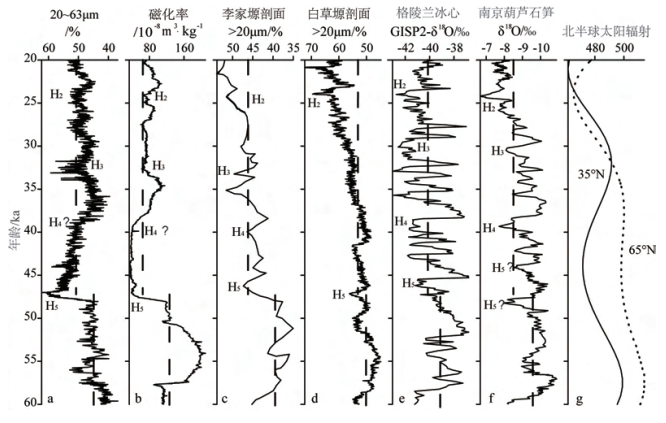
山西洪洞洞峪沟剖面末次冰期黄土沉积开展的高分辨率粒度和磁化率测量的结果显示(图 4), 以47.3ka为分界点大致可以分为早、晚两个时期。早期(67.7~47.3ka)粗粉砂和砂含量整体较低而磁化率较高, 晚期(47.3~13.0ka)粗粉砂含量和砂含量整体较高而磁化率较低。这一结果与前人研究[12, 34-38]相似, 反映MIS3早期东亚冬季风较弱而夏季风较强, MIS3中期至MIS2晚期东亚冬季风明显增强而夏季风明显减弱, 尽管在MIS3晚期因太阳辐射增强东亚冬季风有所减弱、夏季风有所增强(图 5)。不仅如此, 粒度记录在早期波动小而晚期波动明显增强。粒度明显变粗而磁化率明显降低可能对应北半球的冷事件。本次研究共识别6次Heinrich事件, 分别发生在约65ka (H6), 约47ka (H5), 约39ka (H4), 约33ka (H3), 约24ka (H2)和约17ka (H1) (图 4)。在这6次事件中, 4次(H5—H2)分布在60~20ka期间, 大致对应MIS3阶段。其中, 最引人注目的是H5事件, 它将研究区MIS3阶段分为早晚两个阶段。考虑东亚MIS3气候演化在末次冰期的强波动性以及与现代气候的相似性, 我们着重对这次事件在东亚乃至全球空间上的影响展开对比和讨论。
![]() 图 5 洞峪沟剖面20~63μm组分含量(a)和磁化率(b)随年代变化与黄土高原李家塬剖面(c) [12]、白草塬剖面 > 20μm组分含量的变化(d) [39]、格陵兰冰芯GISP2δ18 O记录(e) [42]、南京葫芦石笋δ18 O记录(f) [7]以及北半球太阳辐射(g) [43]的对比Figure 5. omparison of the content of 20~63mfraction (a) and the magnetic susceptibility (b) changing over time of Dongyugou section and the changing of the > 20μm fraction of Lijiayuan section (c) [12]and Baicaoyuan section (d) [39]from the Loess Plateau, GISP 2δ18 O record (e) [42], stalagmiteδ18 O record of Hulu Cave, Nanjing (f) [7], the seasonal insolation of the northern hemisphere (g) [43]
图 5 洞峪沟剖面20~63μm组分含量(a)和磁化率(b)随年代变化与黄土高原李家塬剖面(c) [12]、白草塬剖面 > 20μm组分含量的变化(d) [39]、格陵兰冰芯GISP2δ18 O记录(e) [42]、南京葫芦石笋δ18 O记录(f) [7]以及北半球太阳辐射(g) [43]的对比Figure 5. omparison of the content of 20~63mfraction (a) and the magnetic susceptibility (b) changing over time of Dongyugou section and the changing of the > 20μm fraction of Lijiayuan section (c) [12]and Baicaoyuan section (d) [39]from the Loess Plateau, GISP 2δ18 O record (e) [42], stalagmiteδ18 O record of Hulu Cave, Nanjing (f) [7], the seasonal insolation of the northern hemisphere (g) [43]我们获得的洞峪沟剖面末次冰期黄土沉积的高分辨率粒度和磁化率记录可以与黄土高原李家塬剖面[12]及白草塬剖面[39]高分辨率粒度记录进行较好的对比, 主要表现在H5事件也明显将李家塬剖面和白草塬剖面MIS3黄土沉积分为早、晚两个时期(图 5)。早期粒度细波动小而晚期粒度变粗波动增大, 反映亚洲冬季风早期弱而稳定, 晚期增强而不稳定。这样的认识在兰州范家坪黄土剖面高分辨率粒度记录[40]和孢粉记录[41]中也有较好的显示, 主要表现在60~47ka期间反映降雨增加的粗砂含量峰值较为集中, 而47~26ka期间显著减少, 孢粉组合中木本花粉、蕨类和藻类以及喜湿润的草本花粉含量自47ka开始明显减少, 反映气候自此开始恶化。同样, 南京葫芦洞石笋氧同位素记录[7]和格陵兰冰芯氧同位素记录[42]也显示H5之前相对稳定而H5之后波动明显增强(图 5), 反映北半球冰量对东南夏季风在千年尺度上的显著影响。
不仅如此, 云南小白龙洞石笋XBL-1氧同位素记录也揭示了大致对应H5事件的约48ka的干旱事件[44]。东地中海以色列Soreq洞石笋氧同位素记录揭示了过去60ka以来3次Heinrich事件(H1, H2和H5), H5事件(约46ka)之前整体偏负, H5之后明显偏正[45]。美国西南部新墨西哥地区Fort Stanton洞石笋氧同位素记录显示, 对应H5事件的约48ka以后尤其是约45ka以后当地冬季降雨强度和波动频率明显增加, 与极地降温诱导气流南移进而调整北美冬季暴雨轨迹的位置密切相关[46]。中美低地过去85ka以来气候记录[47]显示, 约85~48ka期间沉积物以碳酸盐黏土为主, 显示湿润的气候条件。第一个石膏层出现于约48ka, 大致对应H5事件, 标志当地向干旱化条件发展。48~23ka期间黏土与石膏(湿润与干旱)之间的波动非常类似于格陵兰冰芯[42, 48]和北大西洋海相沉积记录的温度波动[49]以及来自Cariaco盆地的降雨波动[50]。可见, H5事件在中美低地也成了重要的分界线。H5事件之后, 较冷的海平面温度盛行于北大西洋, 径向翻转环流减弱, 热带辐合带(ITCZ)向南移动, 可能导致巴西东北部(10°10′S、40°50′W, 500masl)在48ka前后河流得到显著发育[51]。
据此, 我们认为MIS3东亚乃至北半球气候可能在H5事件期间发生显著变化, 导致H5事件之后的气候明显不同于H5事件之前的气候。这与深海底栖有孔虫氧同位素揭示的MIS3阶段北大西洋深水环流(NADW)明显减弱与H5事件同期发生并在H5之后保持较弱[52]相吻合, 也与MIS3早期比晚期全球海平面高约20m[53]相一致。当然, 这只是我们的初步推断, 还需要在将来的研究中得到更多具有可靠定年的高分辨率记录的佐证。
5. 结论
山西洪洞洞峪沟剖面末次冰期黄土沉积的高分辨率粒度和磁化率测量结果显示, 粒度和磁化率记录大致可以对应H5事件的47.3ka分界点, 以该点为界分为前后两个时期:早期(67.7~47.3ka)粗粉砂和砂含量整体较低而磁化率较高, 晚期(47.3~13.0ka)粗粉砂含量和砂含量整体较高而磁化率较低, 反映早期亚洲冬季风较弱而夏季风较强, 晚期亚洲冬季风明显增强而夏季风明显减弱。这一以H5事件为分界点的MIS3气候演化模式在东亚、东地中海乃至北美均可以对比, 可能是北极地区冰量在这一时期得到显著发展, 导致东亚乃至北半球气候向寒冷方向发生显著变化。这一初步认识还需要在以后的高分辨率研究中得到进一步检验。
致谢: 感谢中国地震局活动构造与火山重点实验室的火山物理实验室的赵波助理研究员在激光粒度仪的使用过程中提供的无私帮助和技术支持,感谢中国地质大学程捷教授提供的磁化率仪。 -
![]()
图 1 研究区地貌和水系分布
(五角星表示研究剖面的地理位置, 右上插图显示我国主要气候系统组成, 包括印度季风、东亚夏季风、东亚冬季风和西风环流, 红色框显示研究区位置)
Figure 1. The DEM map showing the geomorphology and drainage system of the study area
Pentagram indicates the locality of the studied section.Illustration at the top right displays the climate system of China including the Indian monsoons, the East Asian summer monsoon, the winter monsoon, and the westerlies.Red rectangle shows the locality of studied area
![]()
图 2 山西洪洞县洞峪沟黄土剖面沉积速率
a.洞峪沟剖面照片, 图中红框内的圆洞为OSL采样点, 垂直凹槽为粒度和磁化率采样位置; b.岩性柱状图; c.年龄与深度关系
Figure 2. The sedimentation rate of the Dongyugou loess section, at Hongtong, Shanxi
Photograph of the Dongyugou section(a), Round holes in the Red rectangle represent OSL sampling points, and the vertical groove represents sampling location for grain size and magnetic susceptibility.Photograph of lithological column (b), and the relationship of age and depth (c)
![]()
图 3 两个代表样品(DYG02和DYW05)的生长与衰退曲线
a、b为DYG02样品光释光信号衰减曲线及光释光等效剂量生长曲线; c、d为DYW05样品光释光信号衰减曲线及光释光等效剂量生长曲线
Figure 3. OSL growth curves and decay curves for two representative samples (DYG02and DYW05)
Decay curves of OSL signal intensity (a and c).Growth curves of simplified multiple-aliquot regeneration (SMAR) (b and d)
![]()
图 4 洞峪沟剖面的粒度各组分含量变化与磁化率记录(虚线表示平均值)
Figure 4. The grain-size distribution and SUS record of Dongyugou section (Dotted line shows mean grain-size)
![]()
图 5 洞峪沟剖面20~63μm组分含量(a)和磁化率(b)随年代变化与黄土高原李家塬剖面(c) [12]、白草塬剖面 > 20μm组分含量的变化(d) [39]、格陵兰冰芯GISP2δ18 O记录(e) [42]、南京葫芦石笋δ18 O记录(f) [7]以及北半球太阳辐射(g) [43]的对比
Figure 5. omparison of the content of 20~63mfraction (a) and the magnetic susceptibility (b) changing over time of Dongyugou section and the changing of the > 20μm fraction of Lijiayuan section (c) [12]and Baicaoyuan section (d) [39]from the Loess Plateau, GISP 2δ18 O record (e) [42], stalagmiteδ18 O record of Hulu Cave, Nanjing (f) [7], the seasonal insolation of the northern hemisphere (g) [43]
表 1 山西洪洞县洞峪沟剖面光释光年龄
Table 1 OSL ages at Dongyugou section in Hongtong, Shanxi
样品编号 埋深/m α计数率/Counts • ks-1 K2O/% 实测含水量/% 环境剂量率/Gy • ka-1 等效剂量/Gy 年龄/ka OSL01 1.5 93±0.3 2.06 1.6 3.4±0.2 54.3±1. 16.2±0.6 OSL02 2.6 10.4±0.3 2.41 1.2 3.8±0.2 78.6±18 20.9±0.7 OSL03 3.3 10.6±0.3 2.18 1.1 3.5±0.2 92.0±2.1 26.4±0.8 OSL04 4.2 10.8±0.3 2.44 1.8 3.8±0.2 117.4±4.2 30.6±1.3 OSL05 5.2 11.4±0.4 2.32 1.5 3.8±0.2 131.4± 8. 35.0±2.4 OSL06 6.3 10.8±0.4 2.36 1.0 3.6±0.2 157.5±8.6 43.2±2.5 OSL07 9 11.1±0.3 2.62 1.6 3.9±0.2 223.2±12.3 57.9±3.3 OSL08 9.4 9.5±0.3 2.37 2.2 3.4±0.2 208.4±7.8 60.5±2.5  下载: 导出CSV
-
[1] Johnsen S J, Clausen H B, Dansgaard W, et al.Irregular glacial interstadials recorded in a new Greenland ice core[J].Nature, 1992, 359(6393) :311-313. doi: 10.1038/359311a0
[2] Dansgaard W, Johnsen S J, Clausen H B, et al.Evidence for general instability of past climate from a 250-kyr ice-core record[J].Nature, 1993, 364(6434) :218-220. doi: 10.1038/364218a0
[3] Taylor K C, Lamorey G W, Doyle G A, et al.The"flickering switch"of late Pleistocene climate change[J].Nature, 1993, 361(6411) :432-436. doi: 10.1038/361432a0
[4] Bond G, Heinrich H, Broecker W, et al.Evidence for massive discharges of icebergs into the North Atlantic ocean during the last glacial period[J].Nature, 1992, 360(6401) :245-249. doi: 10.1038/360245a0
[5] Broecker W, Bond G, Klas M, et al.Origin of the northern Atlantic's Heinrich events[J].Climate Dynamics, 1992, 6(3-4) :265-273. doi: 10.1007/BF00193540
[6] Heinrich H.Origin and consequences of cyclic ice rafting in the northeast Atlantic Ocean during the past 130000years[J].Quaternary Research, 1988, 29(2) :142-152. doi: 10.1016/0033-5894(88)90057-9
[7] Wang Y J, Cheng H, Edwards R L, et al.A high-resolution absolute-dated late Pleistocene monsoon record from Hulu Cave, China[J].Science, 2001, 294(5550) :2345-2348. doi: 10.1126/science.1064618
[8] Lu H Y, Wu N Q, Liu K B, et al.Phytoliths as quantitative indicators for the reconstruction of past environmental conditions in China Ⅱ:palaeoenvironmental reconstruction in the Loess Plateau[J].Quaternary Science Reviews, 2007, 26(5-6) :759-772. doi: 10.1016/j.quascirev.2006.10.006
[9] Guo Z, Liu T, Guiot J, et al.High frequency pulses of East Asian monsoon climate in the last two glaciations:link with the North Atlantic[J].Climate Dynamics, 1996, 12(10) :701-709. doi: 10.1007/s003820050137
[10] Porter S C, An Z S.Correlation between climate events in the North Atlantic and China during the last glaciation[J].Nature, 1995, 375(6529) :305-308. doi: 10.1038/375305a0
[11] Lu H Y, Li L, Huang X P, et al.East Asia winter monsoon oscillation and its correlation with the North Atlantic Heinrich events during the last glaciation[J].Progress in Natural Science, 1996, 6(6) :711-717. http://cn.bing.com/academic/profile?id=be86d4ce96dbcc4b7875db1d04662d39&encoded=0&v=paper_preview&mkt=zh-cn
[12] Ding Z L, Liu D S.Forcing mechanisms for East-Asia monsoonal variations during the Late Pleistocene[J].Chinese Science Bulletin, 1998, 43(18) :1497-1510. doi: 10.1007/BF02883437
[13] Gwiazda R H, Hemming, S R, Broecker W S.Tracking the sources of icebergs with lead isotopes:the provenance of icerafted debris in Heinrich layer 2[J].Paleoceanography, 1996, 11(1) :77-93. doi: 10.1029/95PA03135
[14] McManus J F, Anderson R F, Broecker W S, et al.Radiometrically determined sedimentary fluxes in the sub-polar North Atlantic during the last 140, 000years[J].Earth and Planetary Science Letters, 1998, 155(1-2) :29-43. doi: 10.1016/S0012-821X(97)00201-X
[15] Hemming S R, Broecker W S, Sharp W D, et al.Provenance of the Heinrich layers in core Ⅴ28-82, northeastern Atlantic:40 Ar-39 Ar ages of ice-rafted hornblende, Pb isotopes in feldspar grains, and Nd-Sr-Pb isotopes in the fine sediment fraction[J].Earth and Planetary Science Letters, 1998, 164(1-2) :317-333. doi: 10.1016/S0012-821X(98)00224-6
[16] Gwiazda R H, Hemming S R, Broecker W S.Provenance of icebergs during Heinrich event 3and the contrast to their sources during other Heinrich episodes[J].Paleoceanography, 1996, 11(4) :371-378. doi: 10.1029/96PA01022
[17] Hemming S R.Heinrich events:Massive late Pleistocene detritus layers of the North Atlantic and their global climate imprint[J].Review of Geophysics, 2004, 42(1) :RG1005, doi: 10.1029/2003RG000128.
[18] Igarashi Y, Murayama M, Igarashi T, et al.History of Larixforest in Hokkaido and Sakhalin, northeast Asia since the last glacial[J].Acta Palaeontologica Sinica, 2002, 41(4) :524-533. http://en.cnki.com.cn/Article_en/CJFDTotal-GSWX200204006.htm
[19] Takemura K, Hayashida A, Okamura M, et al.Stratigraphy of multiple piston-core sediments for the last 30000years from Lake Biwa, Japan[J].Journal of Paleolimnology, 2000, 23(2) :185-199. doi: 10.1023/A:1008079418715
[20] Hayashida A, Ali M, Kuniko Y, et al.Environmental magnetic record and paleosecular variation data for the last 40kyrs from the Lake Biwa sediments, Central Japan[J].Earth, Planets and Space, 2007, 59(7) :807-814. doi: 10.1186/BF03352743
[21] Jia N, Wang Y H, Sun L G.Desiccation cracks in Zhoushan Archipelago, East China Sea, developed during Heinrich event 3[J].Quaternary Research, 2012, 77(2) :258-263. doi: 10.1016/j.yqres.2011.12.004
[22] Liew P M, Huang S Y, Kuo C M.Pollen stratigraphy, vegetation and environment of the last glacial and Holocene—a record from Toushe Basin, central Taiwan[J].Quaternary International, 2006, 147(1) :16-33. doi: 10.1016/j.quaint.2005.09.003
[23] Zheng H B, Huang X T, Ji J L, et al.Ultra-high rates of loess sedimentation at Zhengzhou since Stage 7:implication for the Yellow River erosion of the Sanmen Gorge[J].Geomorphology, 2007, 85(3-4) :131-142. doi: 10.1016/j.geomorph.2006.03.014
[24] 胡小猛, 王杜涛, 陈美君, 等.山西临汾盆地末次冰期时段湖相沉积中的H、D/O事件记录[J].第四纪研究, 2014, 34(2) :354-363. doi: 10.3969/j.issn.1001-7410.2014.02.09 HU Xiaomeng, WANG Dutao, CHEN Meijun, et al.The study on the records of H and D/O paleoclimatic events during the last glacial period from the lacustrine sediment in Linfen basin, Shanxi graben[J].Quaternary Sciences, 2014, 34(2) :354-363. doi: 10.3969/j.issn.1001-7410.2014.02.09
[25] 邓起东, 苏宗正, 王挺梅, 等.临汾盆地地震构造基本特征和潜在震源区的划分[M]//马宗晋.山西临汾地震研究与系统减灾.北京:地震出版社, 1993:67-95. DENG Qidong, SU Zongzheng, WANG Tingmei, et al.The basic characteristic of the seismogenic structure and the zonation of the potential seismic zone in the Linfen basin[M]//MA Zongjin, ed.Earthquake Research and Systematical Disaster Reduction in Linfen, Shanxi.Beijing:Seismological Press, 1993:67-95.
[26] Hu X M, Li Y L, Yang J C, Quaternary paleolake development in the Fen River basin, North China[J].Geomorphology, 2005, 65(1-2) :1-13. doi: 10.1016/j.geomorph.2004.06.008
[27] 徐岳仁.山西霍山山前断裂带晚第四纪活动特征研究[D].中国地震局地质研究所博士学位论文, 2013. http://www.cnki.com.cn/Article/CJFDTotal-GJZT201406008.htm XU Yueren.A study on the late quaternary faulting of the Huoshan piedmont faultzone in the central Shanxi faulted basin belt[D].Doctor Dissertation of Institute of Geology, China Earthquake Administration, 2013. http://www.cnki.com.cn/Article/CJFDTotal-GJZT201406008.htm
[28] 王克鲁, 盛学斌, 严富华, 等.山西临汾盆地黄土及其形成古环境[J].地震地质, 1996, 18(4) :339-348. http://www.wanfangdata.com.cn/details/detail.do?_type=perio&id=QK199600061850 WANG Kelu, SHENG Xuebin, YAN Fuhua, et al.The loess and the paleoenvironment for its formation in the Linfen basin of Shanxi Province[J].Seismology and Geology, 1996, 18(4) :339-348. http://www.wanfangdata.com.cn/details/detail.do?_type=perio&id=QK199600061850
[29] Lu Y C, Wang X L, Wintle A G.A new OSL chronology for dust accumulation in the last 130000yr for the Chinese Loess Plateau[J].Quaternary Research, 2007, 67(1) :152-160. doi: 10.1016/j.yqres.2006.08.003
[30] Wang X L, Lu Y C, Zhao H.On the performances of the single-aliquot regenerative-dose (SAR) protocol for Chinese loess:fine quartz and polymineral grains[J].Radiation Measurements, 2006, 41(1) :1-8. doi: 10.1016/j.radmeas.2005.02.010
[31] Aitken M J.Thermoluminescence Dating[M].London:Academic Press, 1985:359.
[32] Prescott J R, Hutton J T.Cosmic ray contributions to dose rates for luminescence and ESR dating:Large depths and long-term time variations[J].Radiation Measurements, 1994, 23(2-3) :497-500. doi: 10.1016/1350-4487(94)90086-8
[33] Naafs B D A, Hefter J, Stein R.Millennial-scale ice rafting events and Hudson Strait Heinrich (-like) Events during the late Pliocene and Pleistocene:a review[J].Quaternary Science Reviews, 2013, 80:1-28. doi: 10.1016/j.quascirev.2013.08.014
[34] An Z S, Kukla G J, Porter S C, et al.Magnetic susceptibility evidence of monsoon variation on the Loess Plateau of central China during the last 130, 000 years[J].Quaternary Research, 1991, 36(1) :29-36. doi: 10.1016/0033-5894(91)90015-W
[35] Xiao J L, Porter S C, An Z S, et al.Grain size of Quartz as an indicator of winter monsoon strength on the Loess Plateau of Central China during the last 130000yr[J].Quaternary Research, 1995, 43(1) :22-29. doi: 10.1006/qres.1995.1003
[36] Ding Z L, Sun J M, Liu D S.A sedimentological proxy indicator linking changes in loess and deserts in the Quaternary[J].Science in China Series D:Earth Sciences, 1999, 42(2) :146-152. doi: 10.1007/BF02878513
[37] Sun D H, Bloemendal J, Rea D K, et al.Bimodal grain-size distribution of Chinese loess, and its palaeoclimatic implications[J].Catena, 2004, 55(3) :325-340. doi: 10.1016/S0341-8162(03)00109-7
[38] Vandenberghe J.Grain size of fine-grained windblown sediment:A powerful proxy for process identification[J].EarthScience Reviews, 2013, 121:18-30. http://cn.bing.com/academic/profile?id=5698ebd0d007408c1e9c9d0b8a1b0cc6&encoded=0&v=paper_preview&mkt=zh-cn
[39] Sun J M, Huang X G.Half-precessional cycles recorded in Chinese loess:response to low-latitude insolation forcing during the Last Interglaciation[J].Quaternary Science Reviews, 2006, 25(9-10) :1065-1072. doi: 10.1016/j.quascirev.2005.08.004
[40] Jiang H C, Wang P, Thompson J, et al.Last glacial climate instability documented by coarse-grained sediments within the loess sequence, at Fanjiaping, Lanzhou, China[J].Quaternary Research, 2009, 72(1) :91-102. doi: 10.1016/j.yqres.2009.04.005
[41] Jiang H C, Mao X, Xu H Y, et al.Last glacial pollen record from Lanzhou (Northwestern China) and possible forcing mechanisms for the MIS 3climate change in Middle to East Asia[J].Quaternary Science Reviews, 2011, 30(5-6) :769-781. doi: 10.1016/j.quascirev.2010.12.024
[42] Stuiver M, Grootes P M.GISP2 oxygen isotope ratios[J].Quaternary Research, 2000, 53(3) :277-284. doi: 10.1006/qres.2000.2127
[43] Laskar J, Robutel P, Joutel F, et al.A long-term numerical solution for the insolation quantities of the Earth[J].Astronomy & Astrophysics, 2004, 428(1) :261-285. http://www.wanfangdata.com.cn/details/detail.do?_type=perio&id=f7fe7701a325d340af795aabd1c336b6
[44] Cai Y J, An Z S, Cheng H, et al.High-resolution absolutedated Indian Monsoon record between 53and 36ka from Xiaobailong Cave, southwestern China[J].Geology, 2006, 34(8) :621-624. doi: 10.1130/G22567.1
[45] Bar-Matthews M, Ayalon A, Kaufman A, et al.The eastern Mediterranean paleoclimate as a reflection of regional events:Soreq cave, Israel[J].Earth and Planetary Science Letters, 1999, 166(1-2) :85-95. doi: 10.1016/S0012-821X(98)00275-1
[46] Asmerom Y, Polyak V J, Burns S J.Variable winter moisture in the southwestern United States linked to rapid glacial climate shifts[J].Nature Geoscience, 2010, 3(2) :114-117. doi: 10.1038/ngeo754
[47] Hodell D A, Anselmetti F S, Ariztegui D, et al.An 85-ka record of climate change in lowland Central America[J].Quaternary Science Reviews, 2008, 27(11-12) :1152-1165. doi: 10.1016/j.quascirev.2008.02.008
[48] Grootes P M, Stuiver M, White J W C, et al.Comparison of oxygen isotope records from the GISP2and GRIP Greenland ice cores[J].Nature, 1993, 366(6455) :552-554. doi: 10.1038/366552a0
[49] Bard E, Rostek F, Turon J L, et al.Hydrological impact of Heinrich events in the subtropical Northeast Atlantic[J].Science, 2000, 289(5483) :1321-1324. doi: 10.1126/science.289.5483.1321
[50] Haug G H, Hughen K A, Sigman D M, et al.Southward migration of the Intertropical Convergence Zone through the Holocene[J].Science, 2001, 293(5533) :1304-1308. doi: 10.1126/science.1059725
[51] Wang X F, Auler A S, Edwards R L, et al.Wet periods in northeastern Brazil over the past 210kyr linked to distant climate anomalies[J].Nature, 2004, 432(7018) :740-743. doi: 10.1038/nature03067
[52] Oppo DW, Lehman S J.Suborbital timescale variability of North Atlantic Deep Water during the past 200000years[J].Paleoceanography, 1995, 10(5) :901-910. doi: 10.1029/95PA02089
[53] Siddall M, Rohling E J, Thompson W G, et al.Marine isotope stage 3sea level fluctuations:data synthesis and new outlook[J].Reviews of Geophysics, 2008, 46(4) :RG4003, doi: 10.1029/2007RG000226.
计量
- 文章访问数: 2791
- HTML全文浏览量: 532
- PDF下载量: 25