Millennial-scale paleoenvironment and paleoclimate changes recorded in the Bohai Sea sediments during the last glacial period
-
摘要: 末次冰期千年尺度古气候变化事件在全球大部分载体中均有不同程度的记录,但在海岸带—陆架区的沉积记录中该事件还未见有报道。对取自渤海的BH08孔上部26m的岩芯进行了高分辨率粒度测试与分析,结合AMS 14C测年结果和微体古生物特征,探讨了研究区末次冰期以来古环境和古气候变化。运用粒级-标准偏差法对粒度数据进行研究,发现BH08孔敏感组分(88.4~148.7μm)的变化记录了末次冰期D-O(Dansgarrd-Oeschger)旋回冷暖事件:在暖期时敏感粒级粗组分(88.4~148.7μm)的含量低,而在冷期时含量高,且可以与反映东亚夏季风的指标对应。在暖期时,强盛的夏季风带来丰富的降水,增加的径流可以将粗粒沉积物搬运至更远的下游区,且暖湿气候有利于植被的发育,使得流域内粗粒沉积物减少;而在冷期呈现相反的变化趋势。我们推测,在末次冰期低海面的背景下,格陵兰和北大西洋等高纬地区气候变化导致大气环流和/或洋流系统发生改变,从而对东亚夏季风降水的调控造成河流输入物质的变化可能是造成BH08岩芯敏感组分变化的主要原因。Abstract: The millennial-scale paleoclimatic change during the last glacial stage has been recorded in various achieves worldwide, but nothing has been heard from the sedimentary records in a coastal zone. In order to dig out the sedimentary records from the coastal region, we carried out high-resolution grain-size analysis for the upper 26m of the core BH08 collected from the Bohai Sea, together with AMS 14C dating and microfossils studies. Based upon them, the paleoenvironment and paleoclimate changes of the study area since the last glacial stage are discussed. Grain-size data is treated with the grain size and standard deviation method. It is found that the sensitive component (88.4~148.7μm) of the core BH08 sediments well recorded the D-O (Dansgarrd-Oeschger) cycle of the last glacial stage: the content of the sensitive component (88.4~148.7μm) was low in warm periods, but high in cold periods. The cyclicities of sensitive component are also corresponding to the index reflecting the East Asian summer monsoon. During the warm periods, strong summer monsoon would bring in abundant precipitation, and the increased runoff might transport the coarse-grained sediments to the distant downstream areas. In addition, warm and humid climate is conducive to the development of vegetation, resulting in the reduction of coarse-grained sediments in the drainage basin, and vise versa. It is speculated that in the last glacial stage, climate in the high latitudes such as Greenland and the North Atlantic might cause changes in atmospheric circulation and/or ocean current systems by the precipitation of the East Asian summer monsoon, and thus control the changes of the input sediments from rivers. It may be the main reason for the change of grain-size in the core BH08.
-
Keywords:
- the last glacial stage /
- Grain size /
- East Asian Summer Monsoon /
- D-O Cycle /
- Bohai Sea
-
长江连接了地球上最大的大陆/高原和最大的海洋,流域面积约180万km2,在亚洲季风气候控制下,产生并携带巨量的泥沙,对流域生态环境和边缘海的海洋环境产生重大影响[1]。长江流域涉及到的长江经济带,已发展成为我国综合实力最强、战略支撑作用最大的区域之一,长江经济带的人口和生产总值均超过全国的40%。长江口是世界上最大的河口之一,陆源物质约有90%经由长江口进入东海[2]。在陆地径流与海水的交汇作用下,大量污染物经吸附、絮凝、生物累积等过程,转移到沉积物中,成为长江三角洲地区生态环境的长期潜在影响因素[3]。有资料研究表明长江流域直至北宋, 仍是水土保持较好的地区,长江流域水土流失明显是从南宋开始的, 当时大批北方移民南移, 地区开发垦殖的加快, 导致了水土流失的加重[4]。而长江流域的近现代工业活动大约起始于150年前的钢铁造船等早期制造业,目前大量研究探讨了长江口及东海内陆架水体和沉积物中重金属的分布特征、沉积通量、存在形态、污染评价、累积与演化规律,以及常量元素、稀土元素等与沉积环境的对应关系等[5-22],而对近2ka以来百年尺度重金属元素变化规律的研究较少看到。本文以位于长江口地区的ZK6孔作为研究对象,通过重金属元素变化、粒度参数特征、测年定年分析等方法对长江口近1500年以来沉积物重金属元素的沉积记录进行了综合研究,并揭示了自然与人类活动双重影响下的重金属累积变化规律。
1. 材料与方法
1.1 样品采集
2007年7月在长江口泥质沉积区开展了地质钻探工作(图 1),钻孔编号为ZK6(30.89685°N、122.14752°E),水深9.5m(理论基准面),孔深10m。采用ϕ127岩心管+110pvc衬管采样方法,每个回次不超过1m, 取心率为95%~100%。后期岩心详细描述、剖样和采集工作均在金山区张堰镇地质样品保管基地完成。按照10 cm间隔,共计采集地球化学样品99件;按照10~15cm间隔,共计采集粒度样品95件;现场挑选3件有代表性的贝壳样品进行AMS14C测年。在0~2m内按照5~10cm间隔,采集32件样品进行210Pb和137Cs测年。
1.2 分析测试方法
地球化学样品分析测试按照《多目标区域地球化学调查规范(1:250000)》(DZ/T 0258-2014)要求测试As、Cd、Cu、Cr、Hg、Ni、Pb、Zn、Al2O3等指标,测试工作由原国土资源部南京矿产资源监督检测中心完成,其中As、Hg采用原子荧光法(AFS),Cr、Ni、Pb、Zn、Al2O3采用X荧光光谱法(XRF),Cd采用石墨炉原子吸收法。测试用到的GBW标准物质的准确度和精密度控制均满足规范要求,相对标准偏差(RSD)均小于5%,分析结果数据可靠。
粒度分析测试由华东师范大学河口海岸国家重点实验室完成,所用仪器为美国Coulter公司LS13320型激光粒度仪。AMS14C测年样品由中国科学院广州地球化学研究所AMS14C制样实验室和北京大学核物理与核技术国家重点实验室联合完成。210Pb和137Cs测试项目在华东师范大学河口海岸国家重点实验室进行, 样品预处理方法为:每个样品称取10g左右的湿样,在高温105℃烘干后,放入干燥器。再称取6~7g左右干样研磨,过100目孔筛去除植物根茎,将研磨后的干样放入测试管中,开口封蜡,放置3个星期,以使放射能量平衡。3周后,使用美国EG&GORTEC公司生产的高纯锗井型探头(GWL-120210-S)进行放射性同位素测量。
2. 结果与讨论
2.1 沉积速率与年代特征
0~1.85m,黄灰色泥夹深灰色粉砂纹层,纹层mm级,1m以下纹层密集,且多见虫孔,粉砂中常见贝壳碎片;1.85~10m,灰色泥夹深灰色粉砂纹层,5.9~6.05和8~8.2m为较均质泥,多细小气孔,6.05~7.6m粉砂纹层密集,粉砂中多贝壳碎片,见数层贝壳碎片薄层。4.42、7.57、和9.7m的贝壳校正年龄分别为(630±27)、(1340±33)、(1430±24)aBP,据此推测本孔沉积物的年龄为约1500aBP。本批样品由于测试获得的137Cs浓度较低,因此,在进行沉积速率计算时,只采用了210Pb测试结果,依据常量初始浓度CIC模式对沉积物0~2m进行线性拟合,得到2m以浅沉积速率约为1.85cm/a(图 2)。
![]() 图 2 ZK6孔沉积物比活度剖面图Figure 2. Down-core changes in 210Pbex and 137Cs activities in core ZK6
图 2 ZK6孔沉积物比活度剖面图Figure 2. Down-core changes in 210Pbex and 137Cs activities in core ZK62.2 沉积物粒度特征
ZK6孔,位于南汇边滩前缘,近百年以来平均沉积速率为1.85cm/a,全孔为近1500年来沉积。沉积物粒度波动大且频繁,整体可分为4层(自下而上,分别为层1、2、3、4,表 1、图 3):
表 1 沉积物粒度参数统计Table 1. Grain size parameters for Core ZK6分层 参数 黏土
(<4μm)粉砂
(4~63μm)砂
(63~2000μm)平均粒径/
μm平均粒径/
Φ中值粒径/
μm中值粒径/
Φ4 算术平均值 32.49 58.08 9.43 22.24 5.66 12.07 6.69 最大值 44.40 65.75 42.60 56.21 6.88 53.24 7.71 最小值 15.50 41.90 0.71 8.48 4.15 4.76 4.23 3 算术平均值 36.09 58.31 5.60 16.88 6.05 7.74 7.13 最大值 47.10 64.54 26.30 44.18 7.09 24.45 7.84 最小值 15.60 51.40 0.00 7.36 4.50 4.36 5.35 2 算术平均值 29.63 64.60 5.77 20.20 5.70 11.21 6.63 最大值 46.00 77.13 11.10 32.70 6.50 26.76 7.78 最小值 13.70 50.95 0.28 11.03 4.93 4.55 5.22 1 算术平均值 33.35 59.84 6.81 19.79 5.75 8.42 6.96 最大值 44.40 70.09 16.20 32.95 6.94 14.65 7.69 最小值 24.50 52.54 0.00 8.15 4.92 4.84 6.09 ![]() 图 3 ZK6孔沉积物粒度垂向分布特征Figure 3. Vertical distribution patterns of grain size parameters for Core ZK6
图 3 ZK6孔沉积物粒度垂向分布特征Figure 3. Vertical distribution patterns of grain size parameters for Core ZK6层1为7.6~10m,沉积物总体较稳定,黏土含量24.5%~44.4%,粉砂含量52.54%~70.09%,砂含量0~16.2%,平均粒径、中值粒径分别是4.92~6.94、6.09~7.69Φ。
层2为4.8~7.6m,沉积物又有所变粗,黏土含量降至13.7%~46%,粉砂略有上升,为50.95%~77.13%,砂含量为0.28%~11.1%,平均粒径、中值粒径分别是4.93~6.5、5.22~7.78Φ。
层3为2.0~4.8m,沉积物变细,黏土含量上升为15.6%~47.1%,粉砂含量为51.4%~64.54%,砂含量降为0~26.30%,平均粒径、中值粒径分别为4.50~7.09和5.35~7.84Φ。
层4为0~2.0m,为近百年来沉积,沉积物粒度总体为全孔最粗,黏土含量15.5%~44.4%,粉砂含量41.9%~65.75%,砂含量0.71%~42.6%,平均粒径和中值粒径分别是4.15~6.88、4.23~7.71Φ。
另外从不同粒级沉积物对元素含量的影响来看(表 2),黏土含量对8个元素均有正的吸附促进作用,其中与Pb、Zn具有正相关性。粉砂含量对8个元素均具有负相关性,相关性由强到弱依次为As、Cu、Pb、Cd、Cr、Hg、Ni、Zn。砂含量对8个元素相关性不明显。平均粒径和中值粒径与重金属含量相关性不明显。重金属元素含量与粒度的相关统计参数相关性较复杂,不同粒级范围结果可能完全不一样[6]。
表 2 ZK6孔重金属元素与粒度相关参数相关性Table 2. Relationship between heavy metals and grain size parameters for Core ZK6As Cd Cr Cu Hg Ni Pb Zn 黏土 粉砂 砂 平均粒径 中值粒径 As 1 Cd 0.83** 1 Cr -0.01 0.05 1 Cu 0.67** 0.77** 0.53** 1 Hg 0.53** 0.64** 0.11 0.58** 1 Ni 0.07 0.13 0.90** 0.63** 0.12 1 Pb 0.33** 0.34** 0.70** 0.67** 0.25* 0.73** 1 Zn 0.06 0.13 0.92** 0.62** 0.12 0.97** 0.76** 1 黏土 0.19 0.14 0.18 0.16 0.07 0.20 0.22* 0.21* 1 粉砂 -0.39** -0.30** -0.28** -0.35** -0.27** -0.25* -0.35** -0.25* -0.58** 1 砂 0.14 0.11 0.05 0.14 0.17 -0.01 0.06 -0.02 -0.66** -0.23* 1 平均粒径 0.09 0.09 0.09 0.07 0.01 0.150 0.14 0.15 0.86** -0.20 -0.85** 1 中值粒径 0.07 0.03 0.16 0.05 -0.02 0.18 0.16 0.19 0.97** -0.43** -0.76** 0.86** 1 注:**在0.01水平(双侧)上显著相关;*在0.05水平(双侧)上显著相关;N=95. 2.3 重金属元素垂向分布特征
ZK6孔沉积物重金属元素As、Cd、Cr、Cu、Hg、Ni、Pb、Zn在垂向上的含量变化如图 4、图 5、表 3所示,其对应的含量变化范围分别为8~14.9、0.076~0.18、81.1~109、24.2~46.5、0.04~0.075、36.6~53、23.4~36.5、79.9~117mg/kg,对应的平均含量分别为10.73、0.107、96.6、32.5、0.052、45.8、28.9、100.6mg/kg。
![]() 图 5 Al校正后ZK6沉积物重金属垂向变化Figure 5. Down-core distribution of aluminum-normalized heavy metals concentrations for ZK6表 3 沉积物重金属含量参数统计Table 3. Statistics of heavy metal content for Core ZK6
图 5 Al校正后ZK6沉积物重金属垂向变化Figure 5. Down-core distribution of aluminum-normalized heavy metals concentrations for ZK6表 3 沉积物重金属含量参数统计Table 3. Statistics of heavy metal content for Core ZK6mg/kg 分层 参数 As Cd Cr Cu Hg Ni Pb Zn 算术平均值 12.69 0.14 94.98 36.91 0.063 45.04 29.64 98.72 4 最大值 14.9 0.18 104 46.5 0.075 52.7 36.5 117 最小值 9.35 0.1 81.1 27.9 0.044 36.6 25.5 79.9 算术平均值 11.35 0.11 95.16 31.34 0.053 44.43 28.67 97.34 3 最大值 13.4 0.13 102 35.5 0.06 49.3 34 107 最小值 9.91 0.084 88.5 25.1 0.046 37.8 23.4 81.9 算术平均值 9.94 0.10 95.75 31.26 0.047 45.79 28.36 100.66 2 最大值 11.7 0.11 102 34.6 0.056 50.3 33.5 110 最小值 8.08 0.076 88.8 24.2 0.04 39 25.6 88.6 算术平均值 9.36 0.09 100.70 31.72 0.051 48.18 29.38 105.82 1 最大值 10.4 0.1 109 35.4 0.1 53 33.6 117 最小值 8 0.079 91.6 27.8 0.045 42.4 24.8 95.3 8个重金属元素在垂向上的总体含量变化特征表现为:As、Cd自深部到浅部,表现出元素含量一直在逐步升高的趋势;Cr元素自深部到浅部,表现出元素含量逐步降低的趋势;Cu、Hg、Pb元素,表现出自层1到层2为逐步降低,然后自层3到层4为含量升高的趋势;Ni、Zn元素,表现出含量自层1到层3为逐步降低,然后层4再逐步升高的规律。经Al元素粒度校正后,Ni、Pb、Zn元素在层4含量升高的趋势更为明显。As、Cd、Cr、Cu、Hg、Ni、Pb、Zn元素全孔最大值、最小值对应的采样深度分别为1.55、9.15,1.55、5.25,9.95、0.85,0.35、5.65,0.65、5.65,9.65、0.85,1.55、2.15,9.85、0.85m,其中As、Cd、Cu、Hg、Pb含量最大值均出现在2m以浅,而Cu、Hg含量最大值则为1m以浅。Cr、Ni、Zn等3元素含量最大值主要出现在钻孔底部9.5~10m段(表 4)。所有元素自2m以浅含量明显升高、变幅增大,并在1m左右有个沉积突变,对应的采样深度为80~90cm。
表 4 ZK6孔沉积物重金属全孔含量最大、最小值深度统计Table 4. Statistics of maximum and minimum depth of heavy metals for Core ZK6统计参数 As Cd Cr Cu Hg Ni Pb Zn 算术平均值/(mg/kg) 10.73 0.107 96.6 32.5 0.053 45.8 28.9 100.6 最大值/(mg/kg) 14.9 0.18 109 46.5 0.075 53 36.5 117 最小值/(mg/kg) 8 0.076 81.1 24.2 0.04 36.6 23.4 79.9 最大值采样深度/m 1.55 1.55 9.95 0.35 0.65 9.65 1.55 9.85 最小值采样深度/m 9.15 5.25 0.85 5.65 5.65 0.85 2.15 0.85 2.4 影响因素分析
2.4.1 河口三角洲演化
河口区表层沉积物微量元素主要受地貌条件和沉积物粒径所控制, 这种现象在珠江口、长江口、黄河口表层沉积物都有表现, 河口地区的元素组成也反映了流域化学风化, 河口全新世地层中元素分布与沉积环境变化有关[16, 17, 21, 22]。ZK6孔所在位置为长江口的一个沉积中心,该钻孔反映了近1.5ka以来元素的组成、分布在气候控制下的源区化学风化和三角洲快速向河口推进过程中陆源碎屑物质的输入、河海相互作用发生的变化。自10~2m,As、Cd、Cr、Cu、Hg、Ni、Pb、Zn等元素含量变化幅度较小,其中As、Cd元素为含量逐步升高,Cr、Ni、Zn元素含量逐步降低,Cu、Hg、Pb元素表现为先降后升的趋势。河口三角洲的演化规律对ZK6孔元素含量变化影响较大,ZK6孔自底部到顶部沉积过程中,其位置距离长江口顶端的距离在发生逐步的靠近,反映出的元素含量变化为一致的变化趋势,比如一直升高或降低。另外有研究表明长江口不同沉积物环境对沉积物重金属的含量与形态都有一定影响[15], 长江口地区表层沉积物重金属残渣态占比由高到低依次为Cr(85.7%)、Ni(80.7%)、Zn(72.0%)、As(68.1%)、Cu(55.7%)、Pb(48.2%)、Hg(45.3%)、Cd(26.0%)[15]。残渣态占比最高的Cr、Ni、Zn元素含量逐步降低, As、Cd元素含量逐步升高。2m以浅沉积物粒径突然变粗,这与长江主泓从北支转入南支有直接关系,长江携带的粗颗粒物质在长江口地区经南支入海,粗颗粒物质沉积加剧。因此,河口三角洲的演化、沉积环境变化是影响元素含量变化的重要因素之一。长江自14至18世纪主泓一直由北支入海,表现为三角洲不断向海进积,沉积中心不断东移和南移。19世纪开始主泓逐步改走南支入海[23, 24],根据沉积速率测算孔深2m处对应的时间大致为1899年前后,因此, 长江主泓改走南支是ZK6孔自2m开始沉积物突然变粗的主要原因之一,也是控制沉积物重金属元素变化的重要因素之一。
2.4.2 人类活动影响
人类活动的影响主要体现在3个方面,一是历史时期过度的垦荒引起较严重的生态失控,比如森林砍伐、围湖造田等引发的水土流失、河湖淤塞等[4];二是流域内开发建设的各类水利工程,其中以支流和径流大坝的修建相对影响较大,主要表现为河流径流量与泥沙运移量的运移规律变化;三是由于大规模的“三废”的排放,通过流域内河流的输送,在长江口地区逐步累积。自10~2m,8个元素含量总体变幅不大,按照各自的趋势在增加或者减少,这期间元素含量的变化更多的是与流域内人类活动的恳荒有关。自2m以浅,8个元素都表现出含量相对升高、降低、升高、再逐步降低的趋势,这是人类活动多重因素共同作用的结果,其中长江口河势的演化和变化,进一步增加了元素规律的成因揭示难度。
2.5 重金属及沉积环境对流域环境变化响应
2.5.1 1500年以来总体响应
由测年数据可知,ZK6孔揭示了近1500年以来的沉积环境变化,历史时期长江流域南北文化的交融、流域的垦荒和开发以及近现代的工业活动,都对长江流域环境产生了一定的影响,进而可能会在长江口留下沉积记录。从层1到层4沉积物平均粒径分别为19.79、20.20、16.88、22.24μm,层4平均粒径最粗,层3平均粒径最细。从层1到层2平均粒径由19.79μm变化到20.20μm,粒径自孔底10m到4.8m有略微变粗的趋势。层1为10~7.6m,对应的年代为507-650AD,对应历史上南朝至唐代早期。层2为7.6~4.8m,对应的年代为650- 1233AD,对应历史上唐代早期至南宋。有成果研究表明,自三国时长江中下游地区的区域开发进程已呈现明显加快的趋势。从东晋、南北朝到隋、唐、宋时期的九百多年间, 北方的多年战乱导致大量人口朝南迁徙, 南方的人口数量明显大增, 迁徙居民纷纷转向丘陵山区开荒种地, 从而促进了长江流域山区的开发[4]。同时长江三角洲与我国东部地区又存在中世纪暖期[25]。综上因素,长江流域自南朝以来随着人类活动的逐步增强,同时加上气候的相对暖湿,长江流域来沙增多,长江三角洲向海进积增强,对应ZK6孔的响应为沉积物粒径略微变粗,主要为粉砂粒径沉积物占比增加,黏土粒级和砂粒级沉积物占比减少。这期间自层1到层2重金属元素对应的变化为As元素平均值增加6.20%、Cd元素平均值增加11.11%、Cr元素平均值减少4.92%、Cu元素平均值减少1.45%、Hg元素平均值减少7.84%、Ni元素平均值减少4.96%、Pb元素平均值减少3.47%、Zn元素平均值减少4.88%。
层3为4.8~2.0m,对应的年代为1233-1899 AD,对应历史上的南宋至清朝末期,沉积物粒径全孔最细。黏土粒级沉积物占比增大,粉砂和砂粒级沉积物占比减小。另有研究成果认为公元12世纪是一个明显的转折期, 即在这之前为相对湿润期, 在这之后为相对干燥期[26]。因此, 这期间沉积物粒径变细的主要原因与气候变化有关系,干燥的气候导致流域降水减少,这是沉积物粒径变细的主要原因。另外自南宋开始, 当时大批北方移民南移, 地区开发垦殖加快, 导致了水土流失的加重[4]。自层2到层3,这期间重金属元素对应的变化为As元素平均值增加14.19%、Cd元素平均值增加10%、Cr元素平均值减少0.62%、Cu元素平均值增加0.26%、Hg元素平均值增加12.77%、Ni元素平均值减少2.97%、Pb元素平均值增加1.09%、Zn元素平均值减少3.30%。
层4为2.0m以浅,对应的年代为1899 AD以来,对应历史上的清朝末期以来,沉积物粒径全孔最粗,主要表现为砂级沉积物含量的明显升高。自层3到层4,沉积物粒径总体变粗,黏土粒级沉积物占比减少,粉砂粒级沉积物变化不大,砂级沉积物占比明显增大,这期间自层3到层4重金属元素对应的变化为As元素平均值增加11.81%、Cd元素平均值增加27.27%、Cr元素平均值减少0.19%、Cu元素平均值增加17.77%、Hg元素平均值增加18.87%、Ni元素平均值增加1.37%、Pb元素平均值增加3.38%、Zn元素平均值增加1.42%。重金属元素的含量升高,流域人类活动的加剧是重要原因,自晚清以来长江流域开始的近现代工业的发展也是一个不容忽视的因素,另外长江入海主泓的南移也是一个重要原因之一。
另据中国水系沉积物元素地球化学系列背景值[27],与长江流域相关的构造单元水系沉积物类别包括滇藏造山系和扬子准地台,其中滇藏造山系水系沉积物8个重金属元素的RCC(区域浓集系数)值分别为As(1.56)、Cd(1.36)、Cr(1.07)、Cu(1.01)、Hg(0.85)、Ni(1.16)、Pb(0.98)、Zn(1.09),强烈富集(RCC>1.3)的指标由高到低为As、Cd。扬子准地台水系沉积物8个重金属元素的RCC值分别为As(1.13)、Cd(1.59)、Cr(1.26)、Cu(1.24)、Hg(2.04)、Ni(1.34)、Pb(1.15)、Zn(1.18),强烈富集的指标由高到低为Hg、Cd、Ni。
长江口主要涉及到长江流域和钱塘江流域的沉积物来源,与之相关的成矿带主要包括西南三江成矿带、川滇黔相邻成矿区、湘西鄂西成矿带、长江中下游成矿带、钦杭成矿带等。其中西南三江成矿带水系沉积物8个重金属元素的RCC值分别为As(1.46)、Cd(1.36)、Cr(1.10)、Cu(1.16)、Hg(1.15)、Ni(1.20)、Pb(1.06)、Zn(1.10),强烈富集的指标由高到低为As、Cd;川滇黔相邻成矿区水系沉积物8个重金属元素的RCC值分别为As(0.80)、Cd(1.82)、Cr(1.55)、Cu(2.19)、Hg(1.50)、Ni(1.77)、Pb(1.12)、Zn(1.36),强烈富集的指标由高到低为Cu、Ni、Cd、Cr、Hg、Zn;湘西鄂西成矿带水系沉积物8个重金属元素的RCC值分别为As(1.38)、Cd(2.13)、Cr(1.36)、Cu(1.35)、Hg(2.65)、Ni(1.47)、Pb(1.18)、Zn(1.22),强烈富集的指标由高到低为Hg、Cd、Ni、As、Cr、Cu;长江中下游成矿带水系沉积物8个重金属元素的RCC值分别为As(1.17)、Cd(1.09)、Cr(1.18)、Cu(1.18)、Hg(2.27)、Ni(1.17)、Pb(1.15)、Zn(0.99),强烈富集的指标主要为Hg;钦杭成矿带水系沉积物8个重金属元素的RCC值分别为As(1.48)、Cd(1.27)、Cr(1.03)、Cu(1.05)、Hg(2.69)、Ni(1.02)、Pb(1.15)、Zn(0.96),强烈富集的指标由高到低为Hg、As。
从长江流域相关的水系沉积物基准值调查对比可知,8个重金属元素的RCC值大多大于1.0,表明长江流域的许多地区水系沉积物重金属元素本底值高于全国本底值,其中强烈富集出现最多的指标主要为Cd、As、Hg。ZK6孔自底部到顶部Cd、As 2个指标含量处于逐步升高的趋势,这与流域内许多地方富集Cd、As有很大关系。Hg、Cu、Pb自层2开始含量呈现逐步升高的趋势,表明这3个指标开始逐步响应人类活动的影响。Ni、Zn 2个指标含量表现出自层1到层3降低、层4又升高的规律,以及Cr指标含量表现出自层1到层4一直逐步降低的规律,这一方面与长江流域这3个指标富集区域不多有关,另外也与这3个元素的残渣态占比含量较高有一定关系。因此,8个重金属元素对长江流域环境变化的响应敏感程度由高到低依次为Cd>As>Hg>Cu>Pb>Zn>Ni>Cr。
2.5.2 近百年来重金属含量变化与流域环境响应
自2m以浅8个重金属元素除Cr外,其他7个指标总体表现出含量突然升高的趋势,同时在1.55、0.85、0.35m存在阶段高含量点或低含量点。经粒度校正后,1.55、0.85的阶段高含量点和低含量点依旧明显,0.35m的阶段极值点已经不明显。其中2.0~1.55m,8个元素均表现出含量升高的趋势,其中As、Cd、Pb的含量在1.55m处达到全孔最大值。1.55~0.85m,8个元素均表现出含量降低的趋势,其中Cr、Ni、Zn的含量在0.85m处达到全孔最小值。0.85m以浅,8个元素均表现出含量升高的趋势,其中Hg元素在升高期间有减少的波动,Cu的含量在0.35m处达到全孔最大值。0.35m以浅, Cu、Zn、Ni、Cr、As、Cd、Hg、Pb均表现出高位波动的趋势。
因采样间隔为10cm,样品代表 10cm长岩心的混合样品,1.55m对应的时间大约为1921—1926年,0.85m对应的时间大约为1958—1964年,0.35m对应的时间大约为1985—1991年。自2.0m以浅,沉积物粒径突然变大,这与长江主泓由北支改走南支有很大关系,同时近现代工业的逐步开展也是一个重要原因。在人类活动方面清朝末年自太平天国运动结束后长江流域人口又恢复迅猛增长的趋势,进一步加大了对流域环境的影响,推测这是2.0m以来重金属元素突然升高的主要原因之一。自1926年以来直到建国初期,长江流域先后经历了北伐战争、抗日战争、解放战争等,多年的战乱对流域内的人口数量、人类活动强度、工业生产等都带来了一定影响,据推测相应的影响表现为1.55~0.85 m重金属元素含量阶段下降的趋势。自0.85m重金属元素含量达到阶段低点开始,重金属元素又恢复出增长的趋势,并呈现出高位波动的态势,这与长江流域的大规模开发建设有一定关系。虽然自20世纪80年代以来,国家逐步加强了流域水土流失以及环境治理,加大了环境保护的力度,但0.35m以浅沉积物重金属含量仍旧处于全孔的阶段高点,因此,长江流域的环境保护工作还需继续加强。
3. 结论
(1) ZK6孔沉积物总体以黏土质粉砂为主,沉积物粒径呈现自底部到顶部先变粗、再变细、再变粗的趋势,粒度变化规律与长江流域人类活动以及长江口三角洲演化有关,全孔平均沉积速率为1.85cm/a。
(2) 8个重金属元素垂向变化规律为:As、Cd自深部到浅部表现出元素含量一直在逐步升高的趋势;Cr元素自深部到浅部,表现出元素含量逐步降低的趋势;Cu、Hg、Pb元素,表现出自层1到层2为逐步降低,然后自层3到层4为含量升高的趋势;Ni、Zn元素,表现出含量自层1到层3为逐步降低,然后层4再逐步升高的规律。除Cr外,其他元素自2m以浅含量明显升高、变幅增大。自层1到层4,平均含量增长幅度最快的元素为Cd,其次为As。自层2到层4,平均含量增长幅度最快的元素为Hg,其次为Cu、Pb。
(3) 长江流域不少地区水系沉积物富集Cd、As、Hg等元素,是ZK6孔沉积物As、Cd等指标持续升高的主要原因之一,8个重金属元素对长江流域环境变化的响应敏感程度由高到低依次为Cd>As>Hg>Cu>Pb>Zn>Ni>Cr。Cd、As、Hg是长江流域特别需要加强环境风险监控的指标。
(4) 流域内气候变化、流域内水系沉积物重金属元素的本底值以及形态组成特征是ZK6孔沉积物重金属元素含量变化的首要影响因素。人类活动引发的水土流失加剧、工农业污染等是第二影响因素。1500年以来长江口河势的变化,尤其是主泓的摆动和变迁,是第三影响因素,同时也进一步加剧了元素含量变化规律的复杂性。
目前ZK6孔重金属元素的平均含量还未达到污染的程度,但是其潜在的含量变化趋势应引起高度重视。长江流域全流域的水土流失整治、环境保护治理等举措,不仅对长江流域意义重大,而且对长江口地区沉积环境的保护也意义非凡。
-
![]()
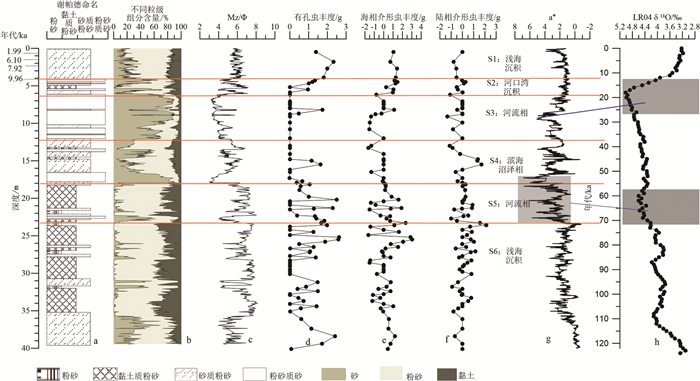
图 2 BH08岩性(a, b)、粒度(c)、颜色反射率a*(g)以及有孔虫与介形虫含量[35](d, e, f)随深度的变化及其与深海氧同位素LR04 δ18O[36](h)的对应关系
g与h之间的蓝色连接线表示BH08的a*指示的变化与LR04 δ18O的曲线变化的年代对应关系,水平红线代表沉积环境划分界限
Figure 2. Lithology (a, b), grain size (c), color reflectance a* (g), and content of foraminifera and ostracoda[35] (d, e, f) of core BH08 changes with depth and correlation to the deep-sea oxygen isotope LR04 δ18O[36] (h)
The blue connecting lines between g and h indicate the age-correlation between the change in a* and the curve LR04 δ18O, Horizontal red lines denote the boundary of sedimentary environments
![]()
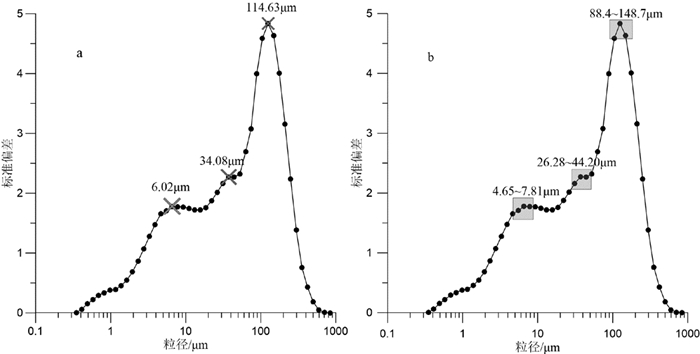
图 3 BH08孔标准偏差随粒级的变化曲线
Figure 3. Standard deviation distribution vs grain size of Core BH08
![]()
图 4 粒级-标准偏差法获得的敏感粒级的不同组分含量及平均粒径
Figure 4. The content of different components and average particle size of sensitive grain grades obtained by Grian size-Standard deviation method
![]()
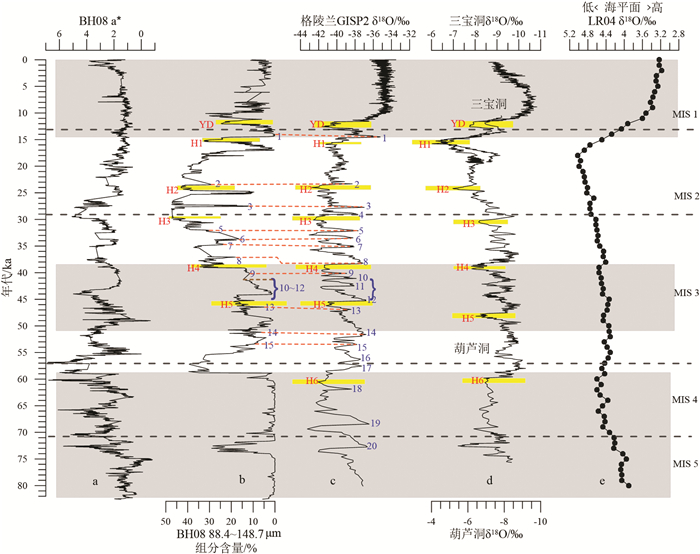
图 5 BH08岩芯颜色反射率a*(a)、粒度序列(b)与格陵兰GISP2冰芯(c)[13]、葫芦洞δ18O (d)[6]、三宝洞δ18O(d)[43]以及LR04 δ18O(e)[36]反映的海平面变化曲线的对比
图中黄色阴影区表示冷气候H事件,蓝色数字表示暖气候事件
Figure 5. Comparison of a*(a) and grain size sequence(b) between of Core BH08 and Greenland GISP2 ice core (c)[13], n δ18O of Hulu cave (d)[6], δ18O of Sanbao cave[43] and LR04 δ18O (e)[36] reflecting sea level change
The yellow shadow areas indicate cold climatic events (H events), and the blue number indicates warm climatic event
表 1 BH08孔年代控制点
Table 1 Age control points of core BH08
深度/m 样品类型 14C年龄/aBP 距今日历年龄/cal.aBP 沉积速率/(cm·ka-1) 1 0.18* 贝壳 600±20 498~300 45.11 2 0.66 混合底栖有孔虫 2190±30 2145~1846 30.07 3 0.96 混合底栖有孔虫 2740±30 2818~2495 45.39 4 1.37 混合底栖有孔虫 5520±30 6252~5957 11.89 5 2.25 混合底栖有孔虫 7290±30 8054~7790 48.42 6 3.47* 贝壳 8490±40 9470~8153 137.16 7 4.09* 混合底栖有孔虫 9010±35 10165~9762 53.82 8 5.46 混合底栖有孔虫 7930±30 8756~8415 - 9 8.17* 贝壳 9020±40 10175~9769 - 10 15.79# OSL - 52500 27.51 11 45.49** 控制点 - 140000 33.94 注:*引自文献[33, 34],**引自文献[33],#引自姚政权等未发表数据。  下载: 导出CSV
-
[1] Linsley B K. Oxygen-isotope record of sea level and climate variations in the Sulu Sea over past 150, 000 yars[J]. Nature, 1996, 380: 234-237. doi: 10.1038/380234a0
[2] Wang L J, Sarnthein M, Erlenkeuser H, et al. East Asian monsoon climate during the Late Pleistocene: High resolution sediment records from the South China Sea[J]. Marine Geology, 1999, 156: 245-284. doi: 10.1016/S0025-3227(98)00182-0
[3] 牛东风, 李保生, 温小浩, 等.萨拉乌苏河流域MGS1层段微量元素记录的全新世千年尺度的气候变化[J].地质学报, 2011, 85(2): 300-308. http://d.old.wanfangdata.com.cn/Periodical/dizhixb201102015 NIU Dongfeng, LI Baosheng, WEN Xiaohao, et al. The Holocene ka-scale climate variation indicated by trace elements of the MGS1 segment in the Salawusu River Valley, China[J]. Acta Geologica Sinica, 2011, 85(2): 300-308. http://d.old.wanfangdata.com.cn/Periodical/dizhixb201102015
[4] Lorius C, Jouzel J, Ritz C, et al. A 150, 000 year climatic record from Antarctic ice[J]. Nature, 1985, 316: 591-596. doi: 10.1038/316591a0
[5] 孙广友, 罗新正, Turner R E, 等.青藏东北部若尔盖高原全新世泥炭沉积年代学研究[J].沉积学报, 2001, 19(2): 177-181. doi: 10.3969/j.issn.1000-0550.2001.02.003 SUN Guangyou, LUO Xinzheng, Turner R E, et al.. A study on peat deposition chronology of Holocene of Zorge Plateau in the Northeast Qinghai-Tibetan Plateau[J]. Acta Sedimentologica Sinica, 2001, 19(2): 177-181. doi: 10.3969/j.issn.1000-0550.2001.02.003
[6] Wang Y J, Cheng H, Edwards R L, et al. A high-resolution absolute-dated late Pleistocene monsoon record from Hulu Cave, China[J]. Science, 2001, 294: 2345-2348. doi: 10.1126/science.1064618
[7] Genty. France Speleothem Stable Isotope Data[M]. National Climatic Data Center, 2003.
[8] Heinrich H. Origin and consequences of cyclic ice rafting in the Northeast Atlantic Ocean during the past 130000 years[J]. Quaternary Research, 1988, 29(2): 142-152. doi: 10.1016/0033-5894(88)90057-9
[9] Broecker W, Bond G, Klas M, et al. Origin of the northern Atlantic's Heinrich events[J]. Climate Dynamics, 1992, 6(3-4): 265-273. doi: 10.1007/BF00193540
[10] Bond G, Heinrich H, Broecker W, et al. Evidence for massive discharges of icebergs into the North Atlantic ocean during the last glacial period[J]. Nature, 1992, 360(6401): 245-249. doi: 10.1038/360245a0
[11] Andrews J T, Tedesco K. Detrital carbonate rich sediments, northwestern Labrador Sea: Implications for ice-sheet dynamics and iceberg rafting (Heinrich) events in the North Atlantic[J]. Geology, 1992, 12(20): 1087-1090.
[12] Berger W H, Burke S, Vincent E. Glacial-Holocene transition: climate pulsations and sporadic shutdown of Nadw Production[M]. Springer Netherlands, 1987.
[13] Dansgaard W, Johnsen S, Clausen, et al. Evidence for general instability of past climate from a 250 kyr ice-core record[J]. Nature, 1993, 364(6343): 218-220. doi: 10.1038-364218a0/
[14] Grootes P M, Stuiver M, White J W C, et al. Comparison of oxygen isotope records from the GISP2 and GRIP Greenlandice cores[J]. Nature, 1993, 366(6455): 552-554. doi: 10.1038/366552a0
[15] Sun Y, Clemens S C, Morrill C, et al. Influence of Atlantic meridional overturning circulation on the East Asian winter monsoon[J]. Nature Geoscience, 2011, 5(1): 46-49. http://d.old.wanfangdata.com.cn/Periodical/dqkxjz-e201809009
[16] Thompson L G, Yao T D, Davies M E, et al. Tropical climate instability: the last glacial cycle from a Qinghai Tibetan ice core[J]. Science, 1997, 276(5320): 1821-1825. doi: 10.1126/science.276.5320.1821
[17] Bender M, Sowers T, Dickson M L, et al. Climate correlations between Greenland and Antarctica during the past 100, 000 years[J]. Nature, 1994, 372(6507): 663-666. doi: 10.1038/372663a0
[18] Kennett J P, Cannariato K G, Hendy I L, et al. Methane hydrates in quaternary climate change: the clarhrate gun hypothesis[J]. Eos Transactions American Geophysical Union, 2002, 83(45): 513-516. doi: 10.1029/2002EO000359
[19] Sakia K, Peltier W R. A multibasin reduced model of the global thermohaline circulation: paleoceangraphic analyses of the origins of ice age climate instability[J]. Journal Geophysical Research Ocean, 1996, 101: 22535-22562. doi: 10.1029/96JC00539
[20] Broecker, Wallace S. Massive iceberg discharges as triggers for global climate change[J]. Nature, 1994, 372: 421-424. doi: 10.1038/372421a0
[21] Bond G C, Lotti R, et al. Iceberg discharges into the North Atlantic on millennial time scales during the last deglaciation[J]. Science, 1995, 273: 1257-1265. http://cn.bing.com/academic/profile?id=f2bcbe7e5e92dabff15cacc48d6828fc&encoded=0&v=paper_preview&mkt=zh-cn
[22] Lang C, Leuenberger M, Schwander J, et al. Rapid temperature variation in central Greenland 70000 years ago[J]. Science, 1999, 286: 934-937. doi: 10.1126/science.286.5441.934
[23] Shi X F, Yao Z Q, Liu Q S, et al. Sedimentary architecture of the Bohai Sea China over the last 1 Ma and implications for sea-level changes[J]. Earth and Planetary Science Letters, 2016, 451: 10-21. doi: 10.1016/j.epsl.2016.07.002
[24] Yao Z Q, Guo Z T, Xiao G Q, et al. Sedimentary history of the Western Bohai coastal plain since the late Pliocene: implications on tectonic, climatic and sea-level changes[J]. Journal of Asian Earth Science, 2012, 54(4): 192-202.
[25] Yan Y Z, Wang H, Li F L, et al. Different depositional processes of boreholes BQ1 and BQ2 in the late Pleistocene on the west coast of Bohai Bay[J]. Quaternary Sciences, 2006, 26: 321-326. http://www.wanfangdata.com.cn/details/detail.do?_type=perio&id=dsjyj200603002
[26] 庄振业, 许卫东, 刘东生, 等.渤海南部S3孔晚第四纪海相地层的划分及环境演变[J].海洋地质与第四纪地质, 1999, 19(2): 27-35. http://d.old.wanfangdata.com.cn/Periodical/hydzydsjdz199902004 ZHUANG Zhenye, XU Weidong, LIU Dongsheng, et al. Division and environmental evolution of late Quaternary marine beds of S3 hole in the Bohai Sea[J]. Marine Geology & Quaternary Geology, 1999, 19(2): 27-35. http://d.old.wanfangdata.com.cn/Periodical/hydzydsjdz199902004
[27] 秦蕴珊.渤海地质[M].北京:科学出版社, 1985. QIN Yunshan. Geology of Bohai Sea[M]. Beijing: Science Press, 1985.
[28] 秦蕴珊, 李凡.黄河入海泥沙对渤海和黄海沉积作用的影响[J].海洋科学集刊, 1986, 27: 125-135. http://cdmd.cnki.com.cn/Article/CDMD-80180-1016904163.htm QIN Yunshan, LI Fan. The influence of Yellow River Sediment into the sea on sedimentation in Bohai and Huanghai seas[J]. Studia Marina Sinca, 1986, 27: 125-135. http://cdmd.cnki.com.cn/Article/CDMD-80180-1016904163.htm
[29] 蓝先洪, 李日辉, 陈晓辉, 等.渤海西部晚更新世以来沉积地球化学研究[J].海洋科学进展, 2018, 36(1): 67-78. doi: 10.3969/j.issn.1671-6647.2018.01.006 LAN Xianhong, LI Rihui, CHEN Xiaohui, et al. Study of sedimentary geochemistry in the Western Bohai sea since late Pleistocene[J]. Advances in Marine Science, 2018, 36(1): 67-78. doi: 10.3969/j.issn.1671-6647.2018.01.006
[30] Konert M, Vandenberghe J E F. Comparison of laser grain size analysis with pipette and sieve analysis: a solution for the underestimation of the clay fraction[J]. Sedimentology, 1997, 44(3): 523-535. doi: 10.1046/j.1365-3091.1997.d01-38.x
[31] Bard E. Geochemical and geophysical implications of the radiocarbon calibration[J]. Geochimica et Cosmochimica Acta, 1998, 62(12): 2025-2038. doi: 10.1016/S0016-7037(98)00130-6
[32] Southon J, Kashgarian M, Fontugne M, et al. Marine reservoir corrections for the Indian Ocean and Southeast Asia[J]. Radiocarbon, 2002, 44(1): 167-180. doi: 10.1017/S0033822200064778
[33] Yao Z Q, Shi X F, Liu Q S, et al. Paleomagnetic and astronomical dating of sediment core BH08 from the Bohai Sea, China: Implications for glacial-interglacial sedimentation[J]. Palaeogeography Palaeoclimatology Palaeoecology, 2014, 393(393): 90-101.
[34] Yao Z Q, Shi X F, Qiao S Q, et al. Persistent effects of the Yellow River on the Chinese marginal seas began at least ~880ka ago[J]. Scientific Reports, 2017, 7(1): 2827. doi: 10.1038/s41598-017-03140-x
[35] 李小艳, 赵泉鸿, 姚政权, 等.渤海百万年以来的海侵记录: BH08孔有孔虫和介形类证据[J].海洋地质与第四纪地质, 2015, 35(6): 93-108. http://www.cnki.com.cn/Article/CJFDTotal-HYDZ201506016.htm LI Xiaoyan, ZHAO Quanhong, YAO Zhengquan, et al. Transgressive records of last million years in the Bohai Sea, China: evidence from foraminifera and ostracoda of core BH08[J]. Marine Geology & Quaternary Geology, 2015, 35(6): 93-108. http://www.cnki.com.cn/Article/CJFDTotal-HYDZ201506016.htm
[36] Lisiecki E, Raymo E. A Pliocence-Pleistocene stack of 57 globally distributed benthic δ18O records[J]. Paleoceanography, 2005, 20: 1-17. http://cn.bing.com/academic/profile?id=0e5531afb09190f1f4a35cb6f3ac7385&encoded=0&v=paper_preview&mkt=zh-cn
[37] 王中波, 李日辉, 张志珣, 等.渤海及邻近海区表层沉积物粒度组成及沉积分区[J].海洋地质与第四纪地质, 2016, 36(6): 101-109. http://www.wanfangdata.com.cn/details/detail.do?_type=perio&id=hydzydsjdz201606013 WANG Zhongbo, LI Rihui, ZHANG Zhixun, et al. Grain size composition and distribution pattern of seafloor sediments in Bohai Bay and adjacent areas[J]. Marine Geology & Quaternary Geology, 2016, 36(6): 101-109. http://www.wanfangdata.com.cn/details/detail.do?_type=perio&id=hydzydsjdz201606013
[38] 刘升发, 石学法, 刘焱光, 等.中全新世以来东亚冬季风的东海内陆架泥质沉积记录[J].科学通报, 2010, 55: 1387-1396. http://www.wanfangdata.com.cn/details/detail.do?_type=perio&id=kxtb201014014 LIU Shengfa, SHI Xuefa, LIU Yanguang, et al. Records of the East Asian winter monsoon from the mud area on the inner shelf of the East China Sea since the mid-Holocene[J]. Science Bulletin, 2010, 55: 1387-1396. http://www.wanfangdata.com.cn/details/detail.do?_type=perio&id=kxtb201014014
[39] Boulay S, Colin C, Trentesaux A, et al. Mineralogy and sedimentology of Pleistocene sediment on the South China Sea (ODP Site 1144)[M]. In: Prell W L, Wang P, Blum P, et al, eds. Proceedings of the Ocean Drilling Program, Scientific Results, 2003, 184: 1-21.
[40] 向荣, 杨作升, Y. Saito, 等.济州岛西南泥质区近2300a来环境敏感粒度组分记录的东亚冬季风变化[J].中国科学:地球科学, 2006, 36(7): 654-662. http://www.cnki.com.cn/Article/CJFDTOTAL-JDXK200607005.htm XIANG Rong, YANG Zuosheng, Satio Y, et al.Variation of East Asia winter monsoon according grain-size component records in the mud area southwest off Cheju island for 2300 year recently[J].Science in China: Earth Sciences, 2006, 36(7): 654-662. http://www.cnki.com.cn/Article/CJFDTOTAL-JDXK200607005.htm
[41] 涂路遥, 周鑫, 刘毅, 等.近海泥质沉积物敏感粒径作为冬季风强度指标的再研究:与器测数据的对比[J].第四纪研究, 2015, 35: 1393-1401. doi: 10.11928/j.issn.1001-7410.2015.06.08 TU Luyao, ZHOU Xin, LIU Yi, et al. Re-analysis of sensitive grain size of coastal muddy sediments as proxy of winter monsoon strength: Comparison with instrumental data[J]. Quaternary Science, 2015, 35: 1393-1401. doi: 10.11928/j.issn.1001-7410.2015.06.08
[42] 徐方建, 李安春, 万世明, 等.东海内陆架泥质区中全新世环境敏感粒度组分的地质意义[J].海洋学报, 2009, 31(3): 95-102. doi: 10.3321/j.issn:0253-4193.2009.03.011 XU Fangjian, LI Anchun, WANG Shiming, et al. The geological significance of environmental sensitive grain-size populations in the mud wedge of the East China Sea during the mid-Holocene[J]. Haiyang Xuebao, 2009, 31(3): 95-102. doi: 10.3321/j.issn:0253-4193.2009.03.011
[43] Wang Y, Cheng H, Edwards R L, et al. Millennial and orbital scale changes in the East Asian monsoon over the past 224000 years[J]. Nature, 2008, 451: 1090-1093. doi: 10.1038/nature06692
[44] Zhang Z L, Liu E F, Zhang Y, et al. Environmental evolution in the saltwater intrusion area south of Laizhou Bay since late Pleistocene[J]. Journal of Geographical Sciences, 2008, 18: 37-56. doi: 10.1007/s11442-008-0037-1
[45] Boulay S, Colin C, Trentesaux A, et al. Sedimentary responses to the Pleistocene climatic variations recorded in the South China Sea[J]. Quaternary Research, 2007, 68: 162-172. doi: 10.1016/j.yqres.2007.03.004
[46] Liu Z, Christophe C, Alain T, et al. Late Quaternary climatic control on erosion and weathering in the eastern Tibetan Plateau and the Mekong Basin[J]. Quaternary Research, 2005, 63(3): 316-328. doi: 10.1016/j.yqres.2005.02.005
[47] Porter S C, An Z S. Correlation between climate events in the North Atlantic and China during the last glaciation[J]. Nature, 1995, 375(6529): 305-308. doi: 10.1038/375305a0
[48] Tada R, Irino T, Koizumi I, et al. Land-ocean linkages over orbital and millennial timescales recorded in late Quaternary sediments of the Japan Sea[J]. Paleoceanography, 1999, 14(2): 236-247. doi: 10.1029/1998PA900016
[49] Li T G, Liu Z X, Michael A H, et al. Heinrich event imprints in the Okinawa Trough: evidence from oxygen isotope and planktonic foraminifera[J]. Palaeogeography Palaeoclimatology Palaeoecology, 2001, 176(1): 133-146. doi: 10.1016-S0031-0182(01)00332-7/
[50] 刘长征, 王会军, 姜大膀等.东亚季风区夏季风强度和降水的配置关系[J].大气科学, 2004, 28(5): 700-712. http://d.old.wanfangdata.com.cn/Periodical/daqikx200405005 LIU Changzheng, WANG Huijun, JIANG Dabang, et al. The configurable relationships between summer monsoon and precipitation over East Asia[J]. Chinese Journal of Atmospheric Sciences, 2004, 28(5): 700-712. http://d.old.wanfangdata.com.cn/Periodical/daqikx200405005
[51] 姚菁.渤海南岸LZ908孔海陆交互相地层气候代用指标及沉积环境研究[D].中国科学院研究生院(海洋研究所), 2014. YAO Jing. Climatic indicators and sedimentary environment studies inferred from transgressive and regressive sediment of core LZ908, south Bohai Sea[D]. Graduate School of Chinese Academy of Sciences (institute of oceanography), 2014.
[52] Yi L, Yu H J, Ortiz J D, et al. Late quaternary linkage of sedimentary records to three astronomical rhythms and the Asian monsoon, inferred from a coastal borehole in the south Bohai Sea, China[J]. Palaeogeography Palaeoclimatology Palaeoecology, 2012, 329-330(3): 101-117. http://www.wanfangdata.com.cn/details/detail.do?_type=perio&id=e49fa43a9d0ffd03f5f16a195b120c3e
[53] 孙红雨, 王长耀, 牛铮, 等.中国地表植被覆盖变化及其与气候因子关系──基于NOAA时间序列数据分析[J].遥感学报, 1998, 2(3):204-210. http://www.cnki.com.cn/Article/CJFDTotal-YGXB803.008.htm SUN Hongyu, WANG Changyao, NIU Zheng, et al. Analysis of the vegetation cover change and relationship between NDVI and environment factors by using NOAA time series data[J]. Journal of Remote Sensing, 1998, 2(3):204-210. http://www.cnki.com.cn/Article/CJFDTotal-YGXB803.008.htm
[54] Anklin M, Barnola J M, Beer J, et al. Climate instability during the last interglacial period recorded in the GRIP ice core[J]. Nature, 1993, 364(6434): 203-207. doi: 10.1038/364203a0
[55] Dansgaard W, Oeschger H. In the Environmental Record in Glaciers and Ice Sheets[M]. Chichester: Wiley, 1989: 287-318.
[56] Bond G C, Showers W, Elliot M, et al. The North Atlantic's 1-2 kyr climate rhythm: relation to Heinrich events, Dansgaard Oeschger cycles and the Little Ice Age[J]. Geophysical Monograph, 1999, 112: 35-58. http://cn.bing.com/academic/profile?id=d7d56a5d6a0126fb986e93559c1cbde8&encoded=0&v=paper_preview&mkt=zh-cn
[57] Schulz H, Rad U V, Erlenkeuser H, et al. Correlation between Arabian Sea and Greenland climate oscillations of the past 110000 years[J]. Nature, 1998, 393: 54-57. doi: 10.1038/31750
[58] Behl R, Kennett J. Brief interstadial events in the Santa Barbara basin, NE Pacific, during the past 60 kyr[J]. Nature, 1996, 379: 243-246. doi: 10.1038/379243a0
-
期刊类型引用(13)
1. 权蔚慈,杨凯,阚思蒙,孙叶龙,田应辉,万东,郑蕾,程红光. 金沙江上游堰塞湖相静水沉积物特性及其资源化利用研究. 环境工程. 2024(08): 1-7 .  百度学术
百度学术
2. 倪和平,毕磊,郭玉龙,何中发,杨守业. 长江口沉积物化学相态分析及主泓变迁的指示. 沉积学报. 2023(01): 243-255 . 百度学术
3. 何中发,温晓华,王丹妮,赵宝成,谢建磊. 上海海岸带沉积物地球化学基准值特征. 上海国土资源. 2022(01): 34-39 . 百度学术
4. 姜宇,郭庆军,邓义楠. 长江流域沉积物和土壤重金属分布规律研究进展. 生态学杂志. 2022(04): 804-812 . 百度学术
5. 张诺,刘其根,陈丽平,展源,胡忠军. 长江口盐沼湿地沉积物重金属空间分布特征及其潜在生态风险评价. 大连海洋大学学报. 2021(01): 135-146 . 百度学术
6. 朱宜平,李小飞,梁霞. 上海青草沙水库表层沉积物重金属含量水平及其生态风险评价. 华东师范大学学报(自然科学版). 2021(02): 54-62 . 百度学术
7. Yu'na Zhang,Qianwen Wang. Determination and ecological risk assessment of arsenic and mercury in sediments from the Changjiang River Estuary and adjacent East China Sea. Acta Oceanologica Sinica. 2021(04): 32-38 . 必应学术
8. 张明宇,常鑫,胡利民,毕乃双,王厚杰,刘喜停. 东海内陆架有机碳的源—汇过程及其沉积记录. 沉积学报. 2021(03): 593-609 . 百度学术
9. 马香菊,徐慧韬,王丽平. 天津临港滨海湿地公园重金属污染特征及风险评价. 环境工程技术学报. 2021(05): 908-918 . 百度学术
10. 曹昉,杨守业,杨承帆,郭玉龙,毕磊,李雨泽. 锂同位素定量提取河流碎屑沉积物中大陆风化信号. 中国科学:地球科学. 2021(10): 1742-1752 . 百度学术
11. 林梵宇,尹希杰,黄杰超,粟蓉,李云海,孙治雷. 利用微区XRF技术测定地质样品中元素含量研究. 矿物岩石. 2021(04): 59-67 . 百度学术
12. 潘柳波,王舟,杨淋清. 深圳市售贝类铅的污染状况与健康风险评价. 中国公共卫生管理. 2020(01): 63-66 . 百度学术
13. 毕宝帅,余宏昌,张亚,唐文乔. 上海东风西沙水库表层沉积物重金属含量及生态风险评价. 上海海洋大学学报. 2020(05): 709-719 . 百度学术
其他类型引用(6)


计量
- 文章访问数: 3874
- HTML全文浏览量: 641
- PDF下载量: 68
- 被引次数: 19