Vicissitude of Cenozoic carbonate platforms in the South China Sea:Sedimentation in semi-closed marginal seas
-
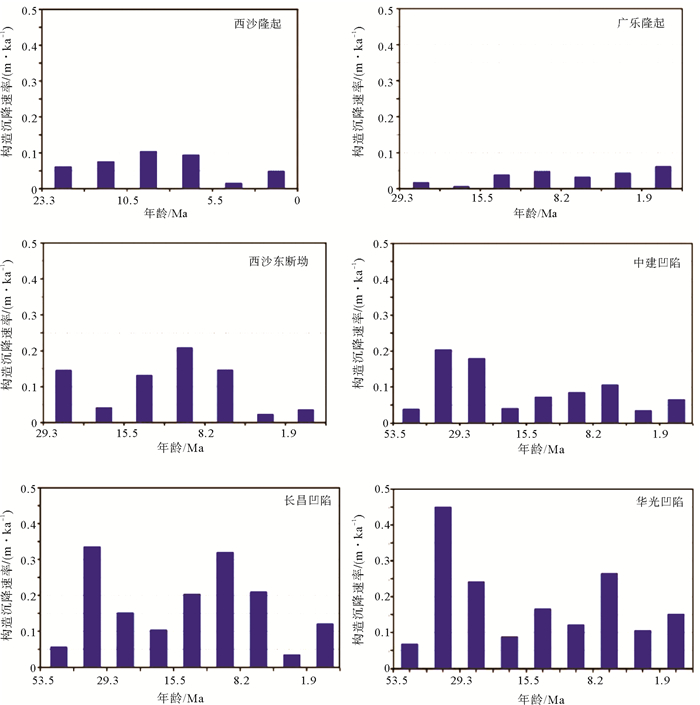
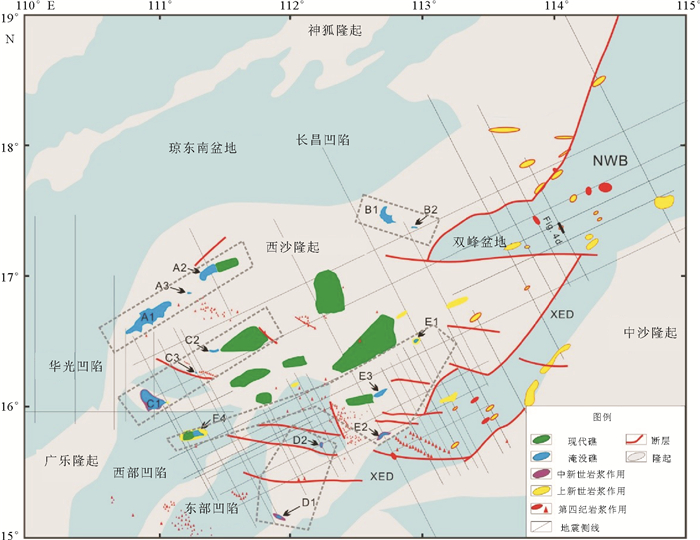
摘要: 南海发育了广泛的碳酸盐台地,具有分布面积广和时空变化大的特点。南海碳酸盐台地的生命演化史总体上经历了萌生期、扩展期、繁盛期、淹没期和残留期等演化阶段。根据近年来国内外关于南海地质地球物理研究进展,发现南海碳酸盐台地是伴随着华南陆缘张裂、陆海巨变而萌生,台地基底往往发育在两个共轭陆缘伸展地块的伸展断块构造高地。随着大陆岩石圈进一步伸展、减薄和地幔剥露等过程,台地经历了晚渐新世末至早中新世初的萌生,到中中新世的勃发。此外,张裂和扩张期的岩浆构造也成为台地发育的重要控制因素,比如构造沉降提供了台地生长的可容纳空间,构造掀斜作用、断裂作用和前陆盆地前沿挤压褶皱的迁移控制了台地各单元厚度、沉积相和地震反射终止特征在横向上的变化,构造控制的相对海平面控制了不同级序生物礁碳酸盐台地的沉积旋回,而晚中新世构造作用导致半封闭边缘海的形成和大量碳酸盐台地淹没。最后,10.5Ma半封闭边缘海的形成,造成南海海盆古海洋环境的巨大变化,限制了台地的广泛发育,仅残留了数量少、面积小的现代孤立碳酸盐台地。Abstract: Cenozoic carbonate platforms are widely distributed in the South China Sea. They are characterized by large thickness and strong spatio-temporal variations. This study summarized most of the recently published findings on the geological and geophysical features of the South China Sea. It is found that all these carbonate platforms have experienced a progressive evolution from initiation, extension, flourishing, drowning and relict stages. Most of them are drowned in Late Cenozoic, and often called drowned carbonate platforms by some researchers. The carbonate platforms are unique in the South China Sea and contain rich information on tectonic evolution. The development of carbonate platforms follows the rifting process. They are usually initiated on the high shoulders of a faulted block at the conjugated rifting margin in Eocene and Early Oligocene. By rifting, thinning, and mantle exhumation of the South China Sea margin, the carbonate platforms has kept growing as NE-SW direction ridges, and flourished till Late Early Miocene. Tectonic subsidence provided accommodation space for platform growth. Tectonic tilt, faulting and migration of compressive folds in the front of foreland basins controlled the distribution of thickness and lateral variation in seismic reflection features. Tectonic induced relative sea level change controlled the sedimentary cycles of carbonate platforms in different orders. Furthermore, the rapid subsidence in Late Miocene and the formation of the semi-closed marginal sea caused the drowning of most carbonate platforms. Only a few carbonate platforms might leave behind as isolated platforms with limited distribution and small scale up to present.
-
Keywords:
- carbonate platform /
- conjugated margin /
- tectonic evolution /
- marginal sea /
- South China Sea
-
河口潮滩位于陆海毗连的沉积动力敏感地带,具有缓冲风暴潮侵袭沿海城市、提供生物栖息地、维持物种多样性以及存贮碳等重要功能。潮滩的进退表征三角洲对流域和海洋动力的耦合强弱与泥沙供给多寡的响应,是三角洲地貌冲淤的指示器[1]。然而,因流域建坝和水土保持工程的修建导致河流入海泥沙急剧减少、河口局部围垦、航槽开挖以及相对海平面上升,世界沿海大部分河口潮滩都面临侵蚀与沉溺的风险。近20年来受高强度人类活动及复杂的海洋应力交互影响,全球已有超过50%的滨海湿地消亡[2],进而严重危及沿海生态系统及沿岸居民生活环境安全[3]。因此,河口潮滩地貌变化,特别是近期河口潮滩时空变化格局已引起众多学者关注[4-5]。
河口潮滩在三角洲城市和沿海经济发展中扮演极为重要的角色。已有成果相继指出,河口潮滩利用方式改变,如潮滩变为稻田[6-7]、潮滩圈围成陆变为工业用地[8]、潮滩变为鱼塘[9]等,不同潮滩利用改变了潮滩性质,造成潮滩永久性的损失。潮滩物质供给主要来自流域入海泥沙,因此较多研究已指出,当前大坝、森林恢复引起的入海泥沙减少,也在较大程度导致潮滩出现侵蚀、淤积减缓或由淤转冲的格局[10]。值得提及的是,河口潮滩一般由覆盖植被的盐沼或红树林以及其外没有覆盖植被的光滩构成[11],由此形成相对完整的潮滩沉积地貌系统和湿地生态系统。国内外已有不少学者针对盐沼或红树林覆盖的潮滩以及其外缘的光滩演化过程及机制展开研究[12],但关于北部湾北部河口潮滩光滩的分析成果几乎没有报道。光滩作为潮滩的有机构成,不仅是潮滩植被扩展的重要空间,更是众多候鸟或底栖动物活动的场所[13-14],其时空变化状态直接关联潮滩冲淤进退与植被的变化过程。基于此,本文以茅尾海北部钦江河口前沿光滩作为研究对象,通过长时间遥感影像解译和实地踏勘等探讨区域光滩空间分布及变化状态,给茅尾海潮滩资源可持续高效利用及红树林保护与培育提供部分理论与技术支撑。
1. 研究区域概况
钦江发源于广西壮族自治区(图1a)灵山县罗阳山,流经灵山县、浦北县和钦州市区,干流全长179 km [15],海拔高度约为−13~846 m, 主流坡度为0.36‰ [16](图1b)。钦江于尖山镇黎头咀分两支分别在沙冲村和沙井港附近注入茅尾海(以下称钦江沙冲河口和钦江沙井河口)(图1c)。钦江河口区域涨潮潮差最大为2.21 m,平均潮差0.97 m,落潮潮差最大为2.20 m,平均潮差1.01 m,属不正规混合全日潮型[17]。受径流与潮流共同作用,在钦江河口区域共形成约3 000 hm2的潮滩,其中光滩约占潮滩面积的60%。潮滩沉积物主要以砂质沉积物为主[18],分布有红树植物11科16种[19]。在此根据钦江入海河口的分布将钦江河口潮滩分为3个区域,分别为钦江沙冲河口、钦江河口中部潮滩和钦江沙井河口(图1d),由此分析其光滩的时空变化特征。
![]() 图 1 研究区域图a. 钦江流域在广西的位置,b. 钦江流域海拔高程和陆屋水文站位置,c. 钦江河口河道支流、光滩和植被空间分布与钦州潮位站和研究区(红色实线包络)位置,d. 4个子区域的用于数字岸线分析的基线、法线和岸线。Figure 1. Study areaa: Location of the Qinjiang River Basin in Guangxi, b: elevation and location of Luwu hydrological station within the Qinjiang River Basin, c: spatial distribution of upstream river distributaries, bare flats and mangroves forests and location of Qinzhou tidal gauging station and study area (solid red line enclosed) in the Qinjiang River estuary, d: the baselines, normal lines and shorelines for digital shoreline analyses in four subregions.
图 1 研究区域图a. 钦江流域在广西的位置,b. 钦江流域海拔高程和陆屋水文站位置,c. 钦江河口河道支流、光滩和植被空间分布与钦州潮位站和研究区(红色实线包络)位置,d. 4个子区域的用于数字岸线分析的基线、法线和岸线。Figure 1. Study areaa: Location of the Qinjiang River Basin in Guangxi, b: elevation and location of Luwu hydrological station within the Qinjiang River Basin, c: spatial distribution of upstream river distributaries, bare flats and mangroves forests and location of Qinzhou tidal gauging station and study area (solid red line enclosed) in the Qinjiang River estuary, d: the baselines, normal lines and shorelines for digital shoreline analyses in four subregions.2. 数据与方法
2.1 数据来源
本研究数据包括潮位、遥感影像及钦江入海水沙三套数据。其中潮位数据为钦州潮位站1986—2021年的逐小时潮高数据(1985国家高程基准),来自国家海洋局南海分局,潮位站位于钦州市钦州港港口附近(图1c),距离钦江河口约16 km。遥感影像数据分别来自美国地质勘探局(United States Geological Survey,USGS)和欧空局(European Space Agency,ESA),通过GEE(Google Earth Engine)平台获取。由于卫星过境时当地潮位通常为中到高潮位潮情,难以捕捉到最低潮位时的卫星影像,同时就光滩而言,一般人类活动对光滩进行改造都聚集于光滩上部,即中潮位以上的光滩。基于此,本文从300余景影像中选取了13景(1986—2021年)研究区中无云且其中包含两组潮位相近的影像数据,进而将潮位相近的影像分为中潮平均低潮位组和平均中潮位组,影像数据涵盖Landsat 5 TM、Landsat8 OLI和Sentinel-2 MSI卫星遥感影像(表1)。此外,钦江流量及泥沙数据采用的是钦江陆屋水文站1971—2021年的实测年平均数据,该水文站距离钦江河口约60 km(图1b)。
表 1 遥感影像信息及对应潮位Table 1. Satellite remote sensing imageries and corresponding tide levels序号 成像日期 卫星 分辨率/m 潮位/m 影像分组 1 1988-06-06 Landsat 5 TM 30 1.62
中潮平均低潮位2 2008-05-12 Landsat 5 TM 30 1.63 3 2020-04-15 Sentinel-2 MSI 10 1.60 4 1986-08-04 Landsat 5 TM 30 3.01 平均中潮位 5 1992-10-23 Landsat 5 TM 30 2.88 6 1997-08-02 Landsat 5 TM 30 2.98 7 1999-09-25 Landsat 5 TM 30 2.92 8 2002-11-04 Landsat 5 TM 30 2.97 9 2007-07-29 Landsat 5 TM 30 2.79 10 2011-05-29 Landsat 5 TM 30 2.74 11 2014-06-14 Landsat 8 OLI 30 2.97 12 2017-04-01 Sentinel-2 MSI 10 2.98 13 2021-07-24 Sentinel-2 MSI 10 3.03 2.2 研究方法
2.2.1 研究区域界定
研究区域范围通过在ArcGIS软件中以美国环境系统研究所公司(Environmental Systems Research Institute, Inc., ESRI)提供的World Imagery数据集为底图,采用目视解译的方法,沿钦江河口沿岸堤坝及潮滩前缘附近海域进行勾绘获得(图1c)。由于该区域潮间带内生长的植被几乎都是红树林,在此将红树林向海边缘到多年平均最低潮位的非植被潮滩定义为光滩(裸滩)。考虑到卫星过境时潮位波动,较难获得研究区域相同潮位的不同时间卫星成像,同时当地成熟红树林边缘基本位于中高潮位附近位置。因此,本文选取同时处于中潮平均低潮位及平均中潮位的二组卫星影像以探讨光滩不同部位的面积变化过程(表1)。卫星过境获取的影像基本处于平均中潮位附近,因而以平均中潮位组影像数据为基础,获取研究区内不同时期的植被及红树林植被边缘到平均中潮位附近之间的光滩面积。为便于分析,在此将红树林植被边缘到平均中潮位附近之间的光滩定义为高于中潮位的光滩,这部分光滩的变化和红树林进退直接相关。因此本文将着重分析其时空变化与影响因素。
2.2.2 影像处理
基于GEE平台,利用遥感影像数据的红、绿、蓝、近红外和短波红外波段的反射率,分别计算归一化水体指数(Normalized Difference Water Index,NDWI)、改进归一化水体指数(Modified Normalized Difference Water Index,MNDWI)、归一化植被指数(Nominalized Difference Vegetation Index,NDVI)和增强型植被指数(Enhanced Vegetation Index,EVI)(表2)。随后,以NDWI、MNDWI、NDVI和EVI作为随机森林分类算法的输入数据,将每一景影像的地物分为水体、植被和光滩三类,提取相应范围并生成矢量数据导出。每景影像分类结果的Kappa系数和Overall系数均高于85%和89%。
表 2 用于分类的光谱指数及计算公式Table 2. Spectral indices used for classification and the calculation formula指数名称 计算公式 归一化水体指数(NDWI)[20] $\dfrac{({\rho }_{\text{green} }-{\rho }_{\text{nir} })}{({\rho }_{\text{green} }+{\rho }_{\text{nir} })}$ 改进归一化水体指数(MNDWI)[21] $ \dfrac{({\mathrm{\rho }}_{\mathrm{g}\mathrm{r}\mathrm{e}\mathrm{e}\mathrm{n}}-{\rho }_{\mathrm{s}\mathrm{w}\mathrm{i}\mathrm{r}})}{({\rho }_{\mathrm{g}\mathrm{r}\mathrm{e}\mathrm{e}\mathrm{n}}+{\rho }_{\mathrm{s}\mathrm{w}\mathrm{i}\mathrm{r}})} $ 归一化植被指数(NDVI)[22] $ \dfrac{({\rho }_{\mathrm{n}\mathrm{i}\mathrm{r}}-{\rho }_{\mathrm{r}\mathrm{e}\mathrm{d}})}{({\rho }_{\mathrm{n}\mathrm{i}\mathrm{r}}+{\rho }_{\mathrm{r}\mathrm{e}\mathrm{d}})} $ 增强型植被指数(EVI)[23] $ \dfrac{2.5\times ({\rho }_{\mathrm{n}\mathrm{i}\mathrm{r}}-{\rho }_{\mathrm{r}\mathrm{e}\mathrm{d}})}{({\rho }_{\mathrm{n}\mathrm{i}\mathrm{r}}+6\times {\rho }_{\mathrm{r}\mathrm{e}\mathrm{d}}-7.5\times {\rho }_{\mathrm{b}\mathrm{l}\mathrm{u}\mathrm{e}}+1)} $ 注:ρnir为近红外波段,ρred为红波段,ρgreed为绿波段,ρswir为短波红外波段,ρblue为蓝波段。 2.2.3 光滩和植被信息提取
将在GEE平台导出的光滩、植被及水体范围矢量数据基于ArcGIS软件进行去噪、掩膜、叠加等处理,分别计算和统计各景影像中光滩和植被面积,分析光滩历年变化趋势以及植被覆盖程度对光滩的可能影响。同时,本文沿钦江河口潮滩前缘共布设8条基线,生成45条基线法线,法线间隔为100 m(图1d)。随后根据各景影像的水体范围提取出各时期潮滩的水边线,进而利用ArcGIS数字岸线分析系统(Digital Shoreline Analysis System,DSAS)中的岸线移动(Net Shoreline Movement,NSM)和终点变化速率(End Point Rate,EPR)工具来量化45条基线法线的变化过程,以分析光滩的时空变化趋势。
2.2.4 不同分辨率影像及潮位下提取光滩面积差异分析
本研究中使用的遥感影像数据分辨率有30 m和10 m两种,影像分辨率越高,地物信息提取越准确,光滩面积计算越精确。为分析基于两种分辨率的卫星影像数据提取的光滩、植被等地物的面积差异,采用两景时间、潮位相近的Landsat 8 OLI 和Sentinel-2 MSI影像数据,分别提取相同区域的光滩、植被面积进行比较,进而分析使用不同分辨率卫星影像数据分析研究区域光滩时空变化过程的可靠性。为避免由于潮位差异对提取光滩面积的影响,验证区域选择在远离水边线以上区域(图2)。结果显示,两组影像在两个检验区域提取的光滩面积分别相差约4.4%和6.0%(表3)。由不同分辨率差异造成的解译偏差在误差范围内,对于分析近40 a光滩时空的变化趋势,数据结果相对可靠。
表 3 检验区地物面积提取结果Table 3. Extraction results of ground object area in the inspection area卫星型号 成像时间 检验区1 检验区2 检验区面积/hm2 植被/hm2 光滩/hm2 光滩面积差值
占比/%检验区
面积/hm2植被
/hm2光滩
/hm2光滩面积
差值/%Sentinel-2 MSI 2021/07/24 171.8 133.5 38.3 4.4 94.6 68.2 26.4 6.0 Landsat 8 OLI 2021/09/05 135.2 36.6 4.6 69.8 24.8 6.4 3. 结果
3.1 光滩总体面积变化特征
1988—2020年光滩展现明显时空变化差异。其中1988—2008年,钦江河口光滩整体向海淤积,淤涨部分集中于钦江沙井河口口门及内侧河槽与潮汐通道边缘,淤涨面积为288 hm2,年平均淤积14.4 hm2,平均向海推展32.5 m。侵蚀部分集中于钦江沙冲河口河道和潮沟边缘,侵蚀面积为170 hm2,年平均侵蚀8.5 hm2(图3a)。2008—2020年,钦江河口光滩出现大面积损失,损失面积高达1 146 hm2,年平均损失为95.5 hm2。该时期损失的光滩主要分布于钦江沙井河口及钦江沙冲河口航道、潮沟区域。零星淤涨的仅54 hm2,且主要出现在沙井河口南部。同时口门光滩每年向陆退却的速率约为104.5 m/a(图3b),特别是光滩向陆与红树林毗连的上部几乎都出现损失,这将在下一节细述。整体上,1988—2020年,钦江河口光滩共有1 077 hm2面积损失,新增面积为103 hm2,即32年间光滩以平均每年33.6 hm2的速度消失(图3c)。
3.2 平均中潮位以上的光滩面积变化特征
1986—2021年间,平均中潮位以上的光滩(以下称中潮位光滩)面积总体呈减少趋势(图4)。其中1986—2002年间,该位置的面积以小幅波动为主,基本维持冲淤平衡状态(图5a-d)。2002—2007年中潮位光滩淤积明显,淤积区域主要位于钦江口潮滩中部前缘、钦江沙冲河口河道及潮汐通道之间,总体淤积面积为373 hm2,年平均淤涨速率为74.6 hm2/a(图5e)。2007—2014年期间,中潮位光滩以91.5 hm2/a的速率急剧损失,损失面积达641 hm2(图5f、g),钦江河口中部潮滩前缘是损失的主要区域。2014—2021年,中潮位光滩主要以11.2 hm2/a的速率缓慢淤涨为主,淤涨面积为79 hm2,淤涨区域集中于钦江河口中部潮滩前缘(图5h、i)。总体而言,在钦江河口中部潮滩前缘和钦江沙冲河口口门处新增约90 hm2光滩的情况下(图5j),近40年来中潮位以上光滩面积仍减少370 hm2(图4)。
![]() 图 5 平均中潮位以上光滩变化特征a-d. 光滩面积基本维持冲淤平衡状态,e. 光滩快速淤涨,f-g. 光滩面积持续减少,h-i. 光滩面积呈现缓慢增长趋势,j. 光滩整体变化格局。Figure 5. Gains and losses of bare flats above the mean middle tide level from 1986 to 2021a-d: Overall stability in 1986-2002, e: quick accretion in high progradation rate in 2002-2007, f-g: quick erosion in 2001-2014, h-i: slow progradation in 2014-2021, j: the overall pattern.
图 5 平均中潮位以上光滩变化特征a-d. 光滩面积基本维持冲淤平衡状态,e. 光滩快速淤涨,f-g. 光滩面积持续减少,h-i. 光滩面积呈现缓慢增长趋势,j. 光滩整体变化格局。Figure 5. Gains and losses of bare flats above the mean middle tide level from 1986 to 2021a-d: Overall stability in 1986-2002, e: quick accretion in high progradation rate in 2002-2007, f-g: quick erosion in 2001-2014, h-i: slow progradation in 2014-2021, j: the overall pattern.3.3 平均中潮位以上的光滩水边线变化特征
1986—2021年光滩区域历年水边线变化过程与其面积变化过程保持一致。其中1986—2002年,平均中潮位以上光滩水边线处于小幅波动变化过程,基本保持进退平衡状态(图6a-d)。2002—2007年期间,此范围光滩平均向海推进98 m,平均推进速率为20.8 m/a,最大向海推进距离达500 m,且主要发生在钦江河口中部潮滩前缘和潮汐通道之间(图6e)。在2007—2014期间,钦江河口中部潮滩前缘区域连续向岸蚀退,平均向岸后退161 m,平均后退速度为23 m/a(图6e、f、g)。2014—2021年平均中潮位以上光滩平均向海淤涨143 m,平均淤涨速率为31.7 m/a(图6i),淤涨区域主要集中于钦江口潮滩中部和钦江沙冲河口前缘,该区域淤涨最远距离近700 m。总体而言,1986—2021年平均中潮位以上光滩平均向海推进176 m,平均推进速率为5.0 m/a(图6j),且冲淤变化的活跃地带主要集中于钦江口中部潮滩和钦江沙冲河口区域。
![]() 图 6 平均中潮位以上光滩水边线移动过程a-d. 水边线基本维持进退平衡状态,e. 快速向海推进,f-g. 连续向岸蚀退,h-i. 缓慢向海淤进,j. 整体变化格局。Figure 6. Spatial migrations of bare flats’ edges above the mean middle tide levela-d: Stability period of the edges in 1986-2002, e: rapid seaward advancement in 2002-2007, f-g: landward erosion in 2001-2014, h-i: slow seaward advancement in 2014-2021, j: the overall patterns.
图 6 平均中潮位以上光滩水边线移动过程a-d. 水边线基本维持进退平衡状态,e. 快速向海推进,f-g. 连续向岸蚀退,h-i. 缓慢向海淤进,j. 整体变化格局。Figure 6. Spatial migrations of bare flats’ edges above the mean middle tide levela-d: Stability period of the edges in 1986-2002, e: rapid seaward advancement in 2002-2007, f-g: landward erosion in 2001-2014, h-i: slow seaward advancement in 2014-2021, j: the overall patterns.4. 讨论
4.1 河流入海水沙的影响
河流入海水沙物质的多寡在河口潮滩发育和地貌塑造过程中扮演着重要的角色[24-25]。钦江河口位于茅尾海北部,钦江入海泥沙是区域潮滩物质的主要来源之一[26]。据钦江陆屋水文站历年水沙数据,自1971年以来,钦江年平均流量和输沙量总体呈波动下降趋势(图7a)。其中年平均输沙量在1971—1982年间出现较大波动,而后1982—2021年呈持续波动下降趋势,下降速率约为0.67×10⁴ t/a(图7a)。将钦江年平均输沙量与平均中潮位以上光滩面积进行相关性分析后发现,除了2007年和2021年外,两者呈显著的正相关性(图7b)。钦江年平均输沙量越高,钦江河口平均中潮位以上光滩面积越大,造成2007年的光滩面积出现远高于拟合值的原因可能是卫星成像时的实际潮位与潮位站提供的测量数据相差过大。但由于缺乏更多相关数据,要探明其中的具体影响因素,需要进一步研究。另外,造成2021年光滩面积远低于拟合值的原因则可能是茅尾海清淤工程的影响,将在下文进行阐述。此外,由于径流挟带泥沙自上而下注入茅尾海时,河面突然展宽,加上地形与红树林植被的作用,流速降低,其挟带的泥沙在平均中潮位以上光滩更容易沉积。相较而言河道、潮汐通道和平均中潮位以下光滩的沉积效果更不显著(图5i),因此,钦江入海水沙是钦江河口光滩向海延伸的动力条件和物质基础,且一定程度上决定冲淤变化在何处发生。但由于钦江输沙量减少是一个相对缓慢的过程,光滩面积响应上游泥沙的减少同样是逐渐变小的态势,但当前光滩面积在2007—2014年呈现急剧下降,因此,输沙量的减少不是区域光滩急剧减少的主要原因。
![]() 图 7 钦江陆屋水文站1971—2021年实测平均流量及输沙量变化趋势(a)以及钦江输沙量与平均中潮位以上光滩面积的关系(b)Figure 7. Changes in riverine annual water discharge and suspended sediment load (SSL) discharged from the Qinjiang River at Luwu Station in 1971—2021 (a), and the relationship between bare flats area above the mean mid-tidal level and riverine SSL (b)
图 7 钦江陆屋水文站1971—2021年实测平均流量及输沙量变化趋势(a)以及钦江输沙量与平均中潮位以上光滩面积的关系(b)Figure 7. Changes in riverine annual water discharge and suspended sediment load (SSL) discharged from the Qinjiang River at Luwu Station in 1971—2021 (a), and the relationship between bare flats area above the mean mid-tidal level and riverine SSL (b)4.2 植被的影响
钦江河口潮滩主要由植被和光滩构成,植被以桐花树和无瓣海桑等红树植物为主[19]。红树林与光滩之间存在着相互促进的关系,红树林的扩张将逐渐填补光滩的空间使光滩面积变小,而其沉沙促淤的作用又促进光滩的发育、扩张,光滩的发育将为红树林提供更多生长空间[27-28]。钦江河口潮滩也呈现出光滩与植被相互促进的趋势。在提取1986—2021年期间钦江河口潮滩上植被的面积后发现,其面积呈逐年上升的趋势,由1986年的769 hm2增长到2021年的1 170 hm2,共增长了401 hm2,年平均增速为12.56 hm2(图8)。逐年扩张和不断向海推移的植被不断填补潮间带的光滩斑块,使光滩上部面积不断下降,相比1986年共减少了370 hm2(图8)。然而根据1986—2021年平均中潮位以上的光滩水边线变化趋势,近40年来该区域光滩平均向海推进了176 m,最远超过600 m(图6j),意味着平均中潮位以上的光滩面积虽受植被扩张的影响而不断减少,但其前缘仍不断向海淤涨。植被的促淤沉沙作用可能是其不断向海淤涨的影响因子之一。
4.3 海平面上升的影响
研究表明,由于全球气候变暖,海平面逐年上升,造成潮滩淤积速率减缓,海岸带侵蚀加剧[29-30]。钦江河口位于茅尾海的北部,是北部湾最北端的海域。根据《2020年中国海平面公报》,1980—2020年北部湾海平面以平均每年0.2 cm的速度上升,40年来海平面上升约10 cm(图9)。然而在此期间,钦江河口平均中潮位以上的光滩前缘平均向海推进176 m,面积增加了263 hm2(图5i、6i)。意味着,海平面的上升对钦江河口光滩的发育未造成明显影响。1986—2021年期间,钦江河口红树林的不断扩张和向海推进,为悬浮泥沙的沉积营造了有利条件,进一步促进光滩的淤积和发育,一定程度上减小区域受海平面上升所带来的影响。
4.4 茅尾海清淤工程的影响
钦江河口光滩面积自1986—2020年总体出现大规模损失,其中1986—2007年光滩面积增加(图6a、7),而后处于递减状态(图6b、7)。即光滩面积约在2008年出现明显转折,造成光滩出现该变化的主要因素可能是人类活动(图10a-f)。2010年钦州市出台《茅尾海综合整治规划》,该规划中指出,为改善茅尾海水动力条件、加大航道水深及船舶通航能力,将分三期对茅尾海航道及浅滩进行清淤、整治。清淤深度到-2.47 m(1985国家高程基准),清淤量约1.3亿 m3,其中沙量340万m3,淤泥12 360万m3,泥岩200万m3 [31],该海区清淤而搬运的1.3亿m3泥沙大部分来自茅尾海北部的河口潮滩。清淤工程的实施直接作用于光滩,使光滩面积急剧下降,此现象与前人研究结果相符。该研究认为,在清淤工程的实施下,茅尾海潮滩在2013年后面积显著缩小[32]。然而,2017—2021年光滩面积出现明显向海淤积,这很可能和茅尾海清淤工程完成后的海区纳潮量与近岸水深变化有关:即因清淤范围内的水深加深,茅尾海纳潮量得到显著提升,其中区域大潮纳潮量分别提升6.1%、13.0%和21.7%,而平均纳潮量分别提升3.1%、9.8%和18.1% [33]。纳潮量的增加和水深的加深使潮流流速降低,利于泥沙沉积,进而导致清淤后的钦江河口潮滩光滩不减反增(图5i)。
![]() 图 10 人类活动对钦江河口光滩的影响a-c. 茅尾海清淤工程的实施,d-f. 利用清淤而来的泥沙对沙井港部分区域进行吹填,g-i. 钦江河口大范围的生蚝养殖。Figure 10. Influence of human activities on the bare flats in the Qinjiang River estuarya-c: Implementation of dredging project in the Maowei Sea; d-f: parts of the adjacent Shajing harbor were filled with dredged sediments; g-i: extensive oyster cultivations in the estuary.
图 10 人类活动对钦江河口光滩的影响a-c. 茅尾海清淤工程的实施,d-f. 利用清淤而来的泥沙对沙井港部分区域进行吹填,g-i. 钦江河口大范围的生蚝养殖。Figure 10. Influence of human activities on the bare flats in the Qinjiang River estuarya-c: Implementation of dredging project in the Maowei Sea; d-f: parts of the adjacent Shajing harbor were filled with dredged sediments; g-i: extensive oyster cultivations in the estuary.4.5 茅尾海近岸海水养殖影响
茅尾海海水养殖主要以生蚝养殖为主,是目前国内最大的天然生蚝产卵和养殖区,面积约2 340 hm2,主要集中于茅尾海中部偏北区域、南部偏中区域和近东岸区域[34-36]。研究表明,大范围的生蚝养殖将造成水动力减弱,延长水循环周期,促使悬浮泥沙沉积,进而造成滩涂淤积[37]。据钦州市近年来生蚝天然采苗器投放量的监测数据显示,2011年采苗器投放量为2 500 万串,是2009和2010年的3倍,2015年采苗串投放增至5 000万串,2016年爆发增长至9 000万串,2017与2018年分别为9 200万串和9 300万串,2019年为1.3亿串[38]。其中,钦江河口分布着较大面积的生蚝养殖区(图10g、h、i)。通过分析钦江河口光滩上部的变化趋势发现,2014—2021年期间,光滩面积呈缓慢上升趋势(图8),钦江河口中部潮滩前缘不断向海淤进(图5h、i),与茅尾海生蚝养殖的增长趋势呈正相关的关系。因此,除清淤工程完成后可能导致区域光滩产生淤积效应外,大范围的生蚝养殖为钦江河口光滩面积不断增长的主要驱动因素。
此外,考虑到不同影像的潮位差异可能造成解译偏差,本研究通过采用RTK实测的方式,计算出研究区平均中潮位潮滩坡度约0.45%。而本研究使用的影像对应潮位最大相差0.29 m,由此造成的水边线提取距离偏差约为64 m,在相应的影像中占2个像元。文中关于两组相近潮位影像解译得到的光滩淤积和侵蚀速率远超过2个像元,因此,文中解译的潮滩冲淤结果可信。
5. 结论
(1)1988—2020年钦江河口光滩总体减少1 077 hm2,减少区域主要集中于钦江沙井河口和钦江沙冲河口航道、潮沟区域。1986—2021年钦江河口平均中潮位以上光滩减少370 hm2,期间经历了1986—2002年冲淤平衡、2002—2007年快速淤积、2007—2014年急剧下降和2014—2021年缓慢淤涨4个阶段。近40年来,该区域平均中潮位以上光滩以5 m/a的速度平均向海推进176 m,淤涨范围主要集中于钦江河口中部潮滩。
(2)钦江入海输沙量的变化是钦江河口平均中潮位光滩面积增减的主控要素,近年来入海泥沙的减少引起该河口光滩面积减少。区域潮间带植被面积的增长有利于滩面泥沙沉降而促使钦江河口光滩面积向海扩展。
(3)茅尾海清淤工程的实施是钦江河口光滩突然减少的直接因素。2015年后呈爆发式增长的生蚝养殖减缓潮流流速,促使钦江河口中部潮滩以上光滩面积在2014—2021年期间出现缓慢上升。此外,近40年来,海平面的上升未对区域光滩造成明显影响。
-
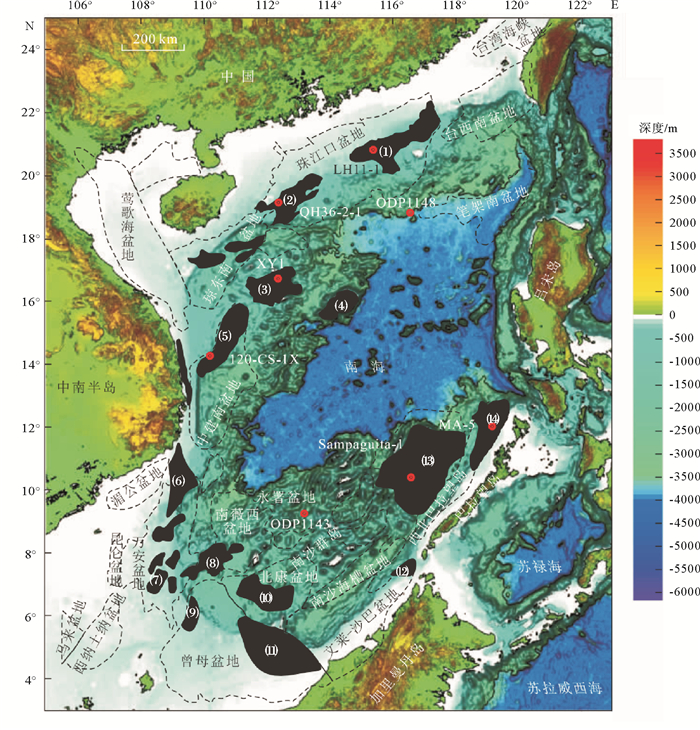
图 3 南海早中新世碳酸盐台地分布[3]
图中碳酸盐台地依次为:(1)流花,(2)宝岛,(3)西沙,(4)中沙,(5)广乐,(6)潘壤,(7)万安,(8)南微,(9)东纳土纳,(10)北康,(11)科尼亚,(12)婆罗,(13)礼乐,(14)巴拉望
Figure 3. Distribution of Early Miocene carbonate platforms in the South China Sea
The name of carbonate platform read: (1)Liuhua, (2)Baodao, ⑶Xisha, (4)Zhongsha, (5)Guangle, ⑹Phanh Rang, (7)Wan'an, (8)Nanwei, (9)East Natuna, (10)Beikang, (11)Luconia, (12)Borneo, (13)Liyue, and (14) Palawan
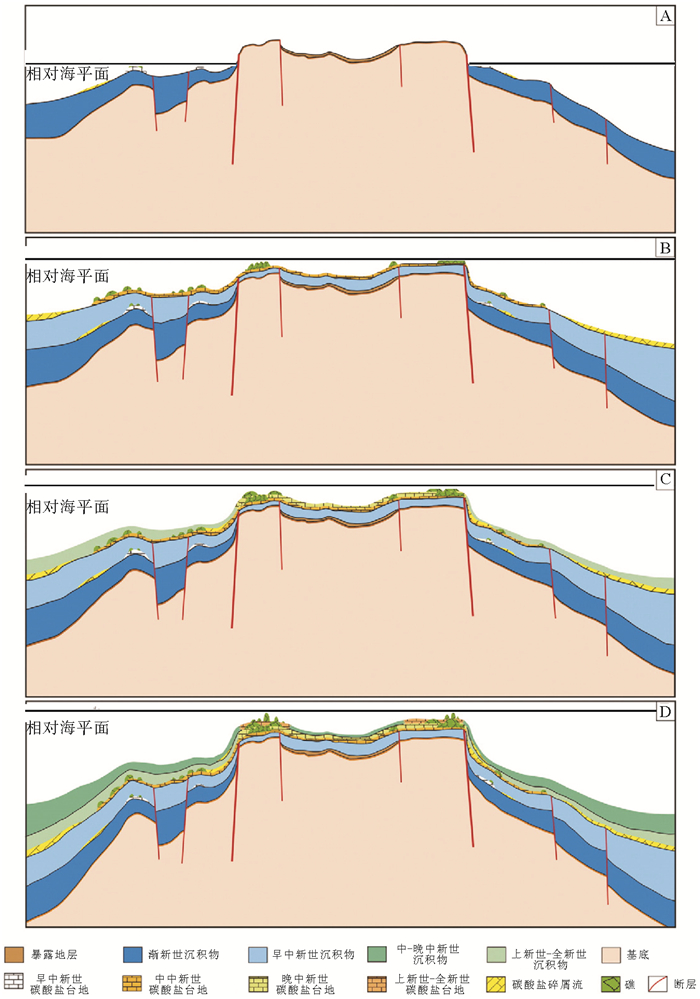
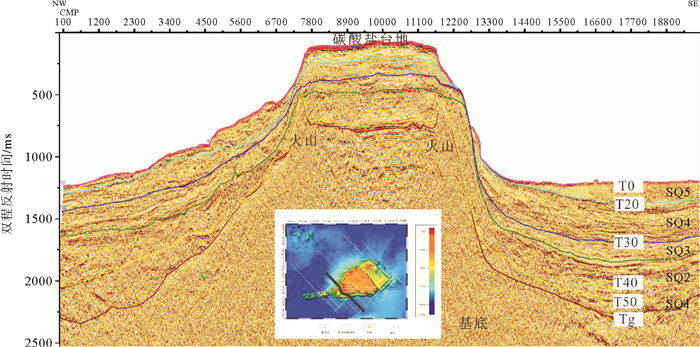
图 5 西沙碳酸盐台地演化模式[8]
A:萌生阶段,西沙隆起早期一直为陆地,受到强烈的剥蚀;早中新世开始随着中央海盆的裂张被海水淹没并接受沉积,此时在构造高部位前期剥蚀的基底之上,孤立的碳酸盐台地开始接受沉积;B:繁盛阶段,构造沉降速率相对较低,随着海平面的继续上升,碳酸盐岩由早期形成的孤立台地开始向周围推进,至中中新世早期西沙隆起碳酸盐台地繁盛发育,覆盖于整个隆起之上;C:衰退阶段,中中新世晚期,相对海平面上升缓慢,碳酸盐台地面积缩小,台地边缘后退至构造高部位,大量碳酸盐碎屑覆盖于早期形成的台地之上;D:淹没阶段,晚中新世开始,基底加速沉降,相对海平面加速上升,促使了碳酸盐台地向构造高部位迁移,面积迅速减小,仅在构造高点形成多个孤立的小规模台地。上新世至今,台地沉积退却至岛屿周围,以垂向生长的环礁为主
Figure 5. Development model of Xisha carbonate platform and its relation to sea-level change
A. Initiation stage, carbonate platform occurred at early Miocene over the Xisha uplift which was a erosion land; B. flourish stage, carbonate platforms have laterally, and have become a large united carbonate deposits when sea-level rose and thermal tectonic subsidence was stable; C.decay stage, carbonate platforms were decay and developed upward in the basement high when sea-level was slow rise at end of Middle Miocene; D. drown stage, isolated carbonate platforms were developed at peak of geomorphology and become small
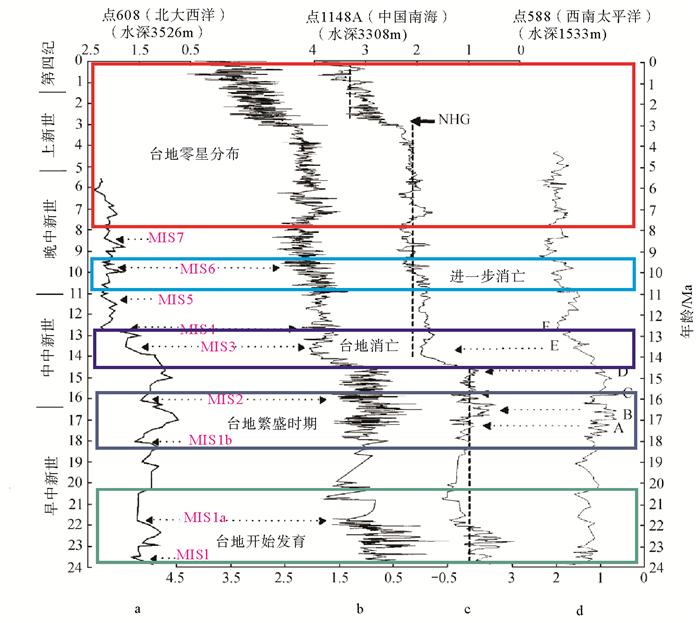
图 7 南海碳酸盐台地演化阶段[61]
Figure 7. The evolutionary stages of carbonate platforms in the South China Sea
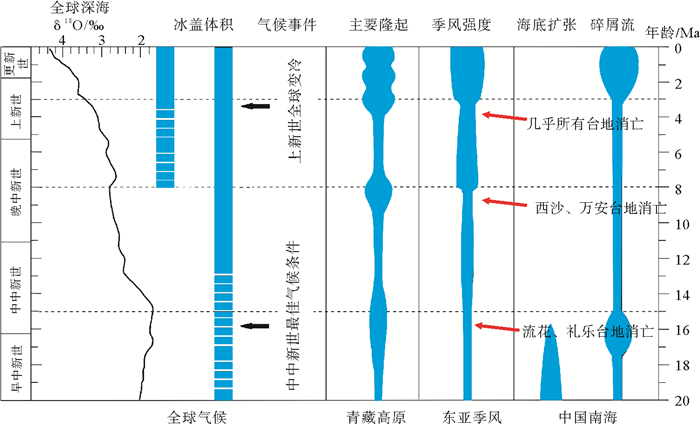
图 8 南海碳酸盐台地淹没的主要事件[62]
Figure 8. Main drowning events of carbonate platform in the South China Sea
-
[1] Zhang Qiaomin. Coral reefs conservation and management in China[C]//In: Ahmed M, Chong C K, Cesar H (eds). Economic Valuation and Policy Priorities for Sustainable Management of Coral Reefs. WorldFish Center Conference Procedings 70. Penang Malaysia: WorldFish Center, 2004: 198-202.
[2] 张乔民, 余克服, 施祺, 等.全球珊瑚礁监测与管理保护[J].热带海洋学报, 2006, 25(2):71-78. doi: 10.3969/j.issn.1009-5470.2006.02.013 ZHANG Qiaomin, YU Kefu, SHI Qi, et al. A review of monitoring conservation and management of global coral reefs[J]. Journal of Tropical Oceanography, 2006, 25(2):71-78. doi: 10.3969/j.issn.1009-5470.2006.02.013
[3] Wu S, Zhang X, Yang Z, et al. Spatial and temporal evolution of Cenozoic carbonate platforms on the continental margins of the South China Sea: Response to opening of the ocean basin[J]. Interpretation-A Journal of Subsurface Characterization, 2016, 4(3): 1-19.
[4] Fournier F, Borgomano J, Montaggioni L F. Development patterns and controlling factor of Tertiary carbonate buildups: Insights from high resolution seismic data and well data in Malampaya gas field (offshore Palawan, Philippines)[J]. Sedimentary Geology, 2005, 175(1-4): 189-215. doi: 10.1016/j.sedgeo.2005.01.009
[5] Steuer S, Frane D, Meresse F, et al. Oligocene-Miocene carbonates and their role for constraining the rifting and collision histroy of the Dangerous Grouds, South China Sea[J]. Marine and Petroleum Geology, 2013, 58: 1-14. https://www.researchgate.net/publication/259512283_Oligocene-Miocene_carbonates_and_their_role_for_constraining_the_rifting_and_collision_history_of_the_Dangerous_Grounds_South_China_Sea
[6] Fyhn M, Nielsen L, Boldreel L, et al. Geological evolution, regional perspectives and hydrocarbon potential of the northwest Phu Khanh Basin, offshore Central Vietnam[J]. Marine and Petroleum Geology, 2009, 26: 1-24. doi: 10.1016/j.marpetgeo.2007.07.014
[7] Shao L, Li Q, Zhu W, et al. Neogene carbonate platform development in the NW South China Sea: Litho-, bio- and chemo-stratigraphic evidence[J]. Marine Geology, 2017, 385: 233-243. doi: 10.1016/j.margeo.2017.01.009
[8] Wu S, Yang Z, Wang D, et al. Architecture, development and geological control of the Xisha carbonate platforms, northwestern South China Sea[J]. Marine Geology, 2014, 350: 71-83. doi: 10.1016/j.margeo.2013.12.016
[9] Zhao Q, Wu S, Xu H, et al. Sedimentary facies and evolution of aeolianites on Shidao Island, Xisha Islands[J]. Chinese Journal of Oceanology and Limnology, 2011, 29(2):398-413. doi: 10.1007/s00343-011-0018-6
[10] 周小康, 汪瑞良, 曾驿, 等.珠江口盆地东沙隆起珠江组碳酸盐岩层序地层及沉积模式[J].石油天然气学报, 2011, 33(9): 1-6. doi: 10.3969/j.issn.1000-9752.2011.09.001 ZHOU Xiaokang, WANG Ruiliang, ZENG Yi, et al. Carbonate sequence stratigraphy and sedimentary modes of Dongsha Massif in Pearl River Mouth Basin[J]. Journal of Oil and Gas Technology, 2011, 33(9): 1-6. doi: 10.3969/j.issn.1000-9752.2011.09.001
[11] Chen D, Wu S, Dong D, et al. Focused fluid flow in the Baiyun Sag, northern South China Sea: implications for the source of gas in hydrate reservoirs[J]. Chinese Journal of Oceanology and Limnology, 2013, 31(1):178-189. doi: 10.1007/s00343-013-2075-5
[12] Swart P, Carling P. Editorial: Citations and other musings[J]. Sedimentology, 2008, 55(5): 1115-1116. doi: 10.1111/j.1365-3091.2008.01000.x
[13] 魏喜, 邓晋福, 谢文彦, 等.南海盆地演化对生物礁的控制及礁油气藏潜力分析[J].地学前缘, 2005, 12(3): 245-252. doi: 10.3321/j.issn:1005-2321.2005.03.026 WEI Xi, DENG Jinfu, XIE Wenyan et al. Constraints on biogenetic reef formation during evolution of the South China Sea and exploration potential nalysis[J]. Earth Science Frontiers, 2005, 12(3): 245-252. doi: 10.3321/j.issn:1005-2321.2005.03.026
[14] 张功成, 赵志刚, 柳永杰.北部湾盆地伸展构造对油气聚集的控制作用[C].中国石油地质年会, 2009. http://www.wanfangdata.com.cn/details/detail.do?_type=conference&id=7225783 ZHANG Gongcheng, ZHAO Zhigang, LIU Yongjie. Characteristics of fault structure and it control on hydrocarbons in the Beibuwan Basin[C]. CAPG annual meeting, 2009. http://www.wanfangdata.com.cn/details/detail.do?_type=conference&id=7225783
[15] 朱伟林, 张功成, 钟锴, 等.中国南海油气资源前景[J].中国工程科学, 2013, 12(5): 46-50. http://d.old.wanfangdata.com.cn/Periodical/zggckx201005007 ZHU Werlin, ZHANG Gongcheng, ZHONG Kai, et al. South China Sea: Oil and gas outlook[J]. Engineering Sciences, 2013, 12(5): 46-50. http://d.old.wanfangdata.com.cn/Periodical/zggckx201005007
[16] 范嘉松.中国生物礁与油气[M].北京:科学出版社, 1996: 329. FAN Jiasong. China Reefs, Oil and Gas[M]. Beijing: Science Press, 1996: 329.
[17] Story C, Peng P, Heubeck C, et al. An integrated geoscience and reservoir simulation study of the Liuhua 11-1 Field: South China Sea[C]//In 32nd Annual Offshore Technology Conference Transactions, Houston, 2000: 1-11. https://www.researchgate.net/publication/249856885_An_integrated_study_of_the_Liuhua_11-1_Field_using_an_ultra_high_resolution_3D_seismic_dataset_South_China_Sea
[18] Wilson M E J. Cenozoic carbonates in Southeat Asia: Implications for equatorial carbonate development[J]. Sedimentary Geology, 2002, 147: 295-428. doi: 10.1016/S0037-0738(01)00228-7
[19] Betzler C, Lindhorst S, Eberli G P, et al. Periplatform drift: The combined result of contour current and off-bank transport along carbonate platforms[J]. Geology, 2014, 42: 871-874. doi: 10.1130/G35900.1
[20] Willams T D, Kroon S, Spezzaferri. Middle-upper-Miocene cyclostratigraphy of downhole logs and short to long term astronomical cycles in carbonate production of Great Bahama Bank[J]. Marine Geology, 2002, 185:75-93 doi: 10.1016/S0025-3227(01)00291-2
[21] Harris P M, Purkis S J, Ellis J, et al. Mapping bathymetry and depositional facies on Great Bahama Bank[J]. Sedimentology, 2015, 62(2): 566-589. doi: 10.1111/sed.12159
[22] Jorry S J, Camoin G F, Jouet G, et al. Modern sediments and Pleistocene reefs from isolated carbonate platforms (Iles Eparses, SW Indian Ocean): A preliminary study[J]. Acta Oecol, 2016, 72: 129-143. doi: 10.1016/j.actao.2015.10.014
[23] Saqab M M, Bourget J. Seismic geomorphology and evolution of early-mid Miocene isolated carbonate build-ups in the Timor Sea, North West Shelf of Australia[J]. Marine Geology, 2016, 379: 224-245. doi: 10.1016/j.margeo.2016.06.007
[24] 何起祥, 张明书, 业治铮, 等.西沙群岛石岛晚更新世碳酸盐沉积物的稳定同位素地层学[J].海洋地质与第四纪地质, 1986, 3(3): 3-10. http://d.old.wanfangdata.com.cn/Conference/108093 HE Qixiang, ZHANG Mingshu, YE Zhizheng, et al. Carbonand oxygen stable isotope stratigraphy of late Pleistocene carbonate deposits at Shidao island, Xisha island, Chna[J]. Marine Geology & Quaternary Geology, 1986, 3(3): 3-10. http://d.old.wanfangdata.com.cn/Conference/108093
[25] Yi L, Jian Z, Liu X, et al. Astronical tuning and magnetostratigraphy of Neogene biogenic reefs in the Xisha Islands, South China Sea[J]. Science Bulletin, 2018, 63: 564-573. doi: 10.1016/j.scib.2018.04.001
[26] Zhu W L, Xie X N, Wang Z F, et al. New insights on the origin of the basement of the Xisha Uplift, South China Sea[J]. Science China Earth Science, 2017, 60: 2214-2222. doi: 10.1007/s11430-017-9089-9
[27] Briais A, Patriat P, Tapponnier P. Updated interpretation of magnetic anomalies and seafloor spreading stages in the south China Sea: Implications for the Tertiary tectonics of Southeast Asia[J]. Journal of Geophysical Research Solid Earth, 1993, 98(B4): 6299-6328. doi: 10.1029/92JB02280
[28] Cullen A, Reemst P, Henstra G, et al. Rifting of the South China Sea: new perspectives[J]. Petroleum Geoscience, 2010, 16(3): 273-282. doi: 10.1144/1354-079309-908
[29] Franke D, Savva D, Pubellier M, et al. The final rifting evolution in the South China Sea[J]. Marine and Petroleum Geology, 2014, 43: 63-87. http://www.wanfangdata.com.cn/details/detail.do?_type=perio&id=84cf03738e5f31266e5d95ad8bc9642d
[30] Hayes D E, Nissen S S. The South China sea margins: Implications for rifting contrasts[J]. Earth & Planetary Science Letters, 2005, 237(3): 601-616. https://www.researchgate.net/publication/222827346_The_South_China_Sea_margins_Implications_for_rifting_contrasts
[31] Li C, Xu X, Lin J, et al. Ages and magnetic structures of the South China Sea constrained by deep tow magnetic surveys and IODP Expedition 349[J]. Geochemistry Geophysics Geosystems, 2015, 15(12): 4958-4983. http://www.wanfangdata.com.cn/details/detail.do?_type=perio&id=10.1002/2014GC005567
[32] Taylor B, Hayes D E. Origin and history of the South China Sea[C]//In Hayes D E (Ed.).The tectonics and geological evolution of Southeast Asia Seas and islands, Part 2. American Geophysical Union Monograph, 1983, 27: 23-56. https://www.researchgate.net/publication/258928283_Origin_and_History_of_the_South_China_Sea_Basin
[33] Morley R. Correlation across the South China Sea Using VIM Transgressive-Regressive Cycles[C]// American Association of Petroleum Geologists Workshop on Southchina Sea Kota Kinabalu May, 2015.
[34] Clift P, Lin J. Preferential mantle lithospheric extension under the South China margin[J]. Marine & Petroleum Geology, 2001, 18(8): 929-945. http://www.wanfangdata.com.cn/details/detail.do?_type=perio&id=224f4679ff8f8be29b5644a4ab57502d
[35] Franke D, Savva D, Pubellier M, et al. The final rifting evolution in the South China Sea[J]. Marine & Petroleum Geology, 2014, 58: 704-720.
[36] 李家彪.南海大陆边缘动力学:科学实验与研究进展[J].地球物理学报, 2011, 54(12): 2993-3003. doi: 10.3969/j.issn.0001-5733.2011.12.002 LI Jiabiao. Dynamics of the continental margins of South China Sea: scientific experiments and research progress[J]. Chinese J. Geophysics, 2011, 54(12): 2993-3003. doi: 10.3969/j.issn.0001-5733.2011.12.002
[37] Ding W, Li J, Clift P D. Spreading dynamics and sedimentary process of the Southwest Sub-basin, South China Sea: Constraints from multi-channel seismic data and IODP Expedition 349[J]. Journal of Asian Earth Sciences, 2016, 115: 97-113. doi: 10.1016/j.jseaes.2015.09.013
[38] Gao J, Wu S, Mcintosh K, et al. Crustal structure and extension mode in the northwestern margin of the South China Sea[J]. Geochemistry Geophysics Geosystems, 2016, 17(6): 2143-2167. doi: 10.1002/2016GC006247
[39] Reston. The extension discrepance at North Atlantic non-volcanic rifted margins: depth dependent stretching or unrecognized fault?[J]. Geology, 2007, 35: 367-370. doi: 10.1130/G23213A.1
[40] Sun Z, Zhong Z, Keep M, et al. 3D analogue modeling of the South China Sea: A discussion on breakup pattern[J]. Journal of Asian Earth Sciences, 2009, 34(4): 544-556. doi: 10.1016/j.jseaes.2008.09.002
[41] Hutchison C S. Marginal basin evolution: the south Southern China Sea[J]. Marine & Petroleum Geology, 2004, 21: 1129-1148. http://d.old.wanfangdata.com.cn/Periodical/zgsykt200702005
[42] Savva D, Pubellier M, Franke D, et al. Different expressions of rifting on the South China Sea margins[J]. Marine & Petroleum Geology, 2014, 58: 579-598. http://www.wanfangdata.com.cn/details/detail.do?_type=perio&id=e4907d54982ff67ebaba3b3aba3c59d2
[43] Steuer S, Franke D, Meresse F, et al. Using Oligocene to Pliocene limestone formations to constrain the collision history of Palawan Island and the Dangerous Grounds at the southeastern margin of the South China Sea[C]// Petroleum Geology and Exploration of Palawan and Surrounding areas. 2014. https://www.sciencedirect.com/science/article/pii/S136791201300031X
[44] Bai Y, Wu S, Liu Z, et al. Full-fit reconstruction of the South China Sea conjugate margins[J]. Tectonophysics, 2015, 661: 121-135. doi: 10.1016/j.tecto.2015.08.028
[45] Fan J K, Wu S G. P-wave seismic tomography of the Manila subduction zone[J]. Chinese Journal of Geophysics, 2014, 57(7): 2127-2137. http://www.wanfangdata.com.cn/details/detail.do?_type=perio&id=ad92b788851e03301c42b39ad2a450ab
[46] Wu J, Suppe J. Proto-South China Sea plate tectonics using subducted slab constraints from tomography[J]. Journal of Earth Science, 2017(B4):1-15. http://d.old.wanfangdata.com.cn/Periodical/dqkx-e201806002
[47] Rudolph K W, Lehmann P J. Platform evolution and sequence stratigraphy of the Natuna Platform, South China Sea[M]// Controls on Carbonate Platforms and Basin Development. 1987: 353-361.
[48] Williams, Harold H. Play concepts-northwest Palawan, Philippines[J]. Journal of Southeast Asian Earth Sciences, 1997, 15(2-3): 251-273. doi: 10.1016/S0743-9547(97)00011-1
[49] 姚永坚, 姜玉坤, 曾祥辉.南沙海域新生代构造运动特征[J].中国海上油气, 2002, 16(2): 113-117. http://d.old.wanfangdata.com.cn/Periodical/zghsyq-dz200202008 YAO Yongjian, JIANG Yukun, ZENG Xianghui. Cenozoic tectonic movements in Nansha area, South China Sea[J], China Offshore Oll and Gas(Geology), 2002, 16(2): 113-117. http://d.old.wanfangdata.com.cn/Periodical/zghsyq-dz200202008
[50] Zampetti V, Schlager W. Architecture and growth history of a Miocene carbonate platform from 3D seismic reflection data, Luconia province, off shore Sarawak, Malaysia[J]. Marine and Petroleum Geology, 2004, 21: 517-534. doi: 10.1016/j.marpetgeo.2004.01.006
[51] Sattler U, Zampetti V, Schlager W, et al. Late Leaching under deep burial conditions: a case study from the Miocene Zhujiang Carbonate Reservoir, South China Sea[J]. Marine and Petroleum Geology, 2004, 21(8): 977-992. doi: 10.1016/j.marpetgeo.2004.05.005
[52] 朱伟林, 张功成, 杨少坤, 等.南海北部大陆边缘盆地天然气地质[M].北京:石油工业出版社, 2007: 391. ZHU Weilin, ZHANG Gongcheng, YANG Shaokun, et al. Gas geology of continental margin basins in Northern South China Sea[M]. Beijing: Petroleum Industry Press, 2007:391.
[53] 杜学斌, 陆永潮, 裴建祥, 等.南海南部礼乐盆地上渐新统-下中新统生物礁生长模式及分布规律[J].海洋地质与第四纪地质, 2018, 38(6):85-94. DU Xuebin, LU Yongchao, PEI Jianxiang, et al. The characteristics and distribution of Upper Oligocene to Lower Miocene reefs in Liyue Basin, South China Sea[J]. Marine Geology & Quaternary Geology, 2018, 38(6):85-94
[54] 鄢伟, 张光学, 张莉, 等.南海北康盆地碳酸盐台地的地震响应及分布特征[J].海洋地质与第四纪地质, 2018, 38(6):105-113. YAN Wei, ZHANG Guangxue, ZHANG Li, et al. The seismic response and distribution characteristics of the Middle Miocene carbonate platform in Beikang Basin of the southern South China Sea[J]. Marine Geology & Quaternary Geology, 2018, 38(6):105-113.
[55] 王彬, 吴时国, 吕福亮, 等.南海中建岛礁的地震反射特征及其沉积演化研究[J].海洋地质与第四纪地质, 2018, 38(6):18-24. WANG Bin, WU Shiguo, LV Fuliang, et al. Seismic Reflect Characteristics and Evolution of Sedimentary at Zhongjian Ree, South China Sea[J], Marine Geology & Quaternary Geology, 2018, 38(6):18-24.
[56] 周小康, 卫哲, 傅恒, 等.南海北部珠江口盆地深水区碳酸盐岩发育特征及地震识别[J].海洋地质与第四纪地质, 2018, 38(6):123-135. http://www.cnki.com.cn/Article/CJFDTotal-HYDZ201806014.htm ZHOU Xiaokang, WEI Zhe, FU heng, et al. Development characteristics and seismic identification of carbonate rocks in the deep-water area of the Pearl River Mouth Basin in the northern South China Sea[J]. Marine Geology & Quaternary Geology, 2018, 38(6):123-135. http://www.cnki.com.cn/Article/CJFDTotal-HYDZ201806014.htm
[57] 杨朝云, 韩孝辉, 冯亚坤, 等.西沙海区宣德环礁的地震层序发育特征[J].海洋地质与第四纪地质, 2018, 38(6):25-36. http://www.cnki.com.cn/Article/CJFDTotal-HYDZ201806003.htm YANG Chaoyun, HAN Xiaohui, FENG Yakun, et al. Seismic Sequence Development Characteristics of Xuande Atoll, Xisha Area[J]. Marine Geology & Quaternary Geology, 2018, 38(6):25-36. http://www.cnki.com.cn/Article/CJFDTotal-HYDZ201806003.htm
[58] Betzler C, Fürstenau J, Lüdmann T, et al. Sea-level and ocean-current control on carbonate-platform growth, Maldives, Indian Ocean[J]. Basin Research, 2013, 25(2):172-196. doi: 10.1111/j.1365-2117.2012.00554.x
[59] Christian B, Eberli G P, Dick K, et al. The abrupt onset of the modern South Asian Monsoon winds[J]. Scientific Reports, 2016, 6:29838. doi: 10.1038/srep29838
[60] Wan S, Li A, Clift P D, et al. Development of the East Asian monsoon: Mineralogical and sedimentologic records in the northern South China Sea since 20Ma[J]. Palaeogeography Palaeoclimatology Palaeoecology, 2007, 254(3):561-582.
[61] Zhao Quanhong, Jian Zhimin, Wang Jiliang, et al. Neogene oxygen isotopic stratigraphy, ODP Site 1148, northern South China Sea[J]. Science China Earth Sciences, 2001, 44(10):934-942. doi: 10.1007/BF02907086
[62] Bosence D. A genetic classification of carbonate platforms based on their basinal and tectonic settings in the Cenozoic[J]. Sedimentary Geology, 2005, 175: 49-72. doi: 10.1016/j.sedgeo.2004.12.030
[63] Purser B H. Syn-rift diagenesis of Middle Miocene carbonate platforms on the north-western Red Sea coast, Egypt[J]. 1998. doi: 10.1007%2F978-94-011-4930-3_20
[64] Lü C L, Wu S G, Yao Y, et al. Development and controlling factors of Miocene carbonate platform in the Nam Con Son Basin, Southwestern South China Sea[J]. Marine and Petroleum Geology, 2013, 45: 55-68. doi: 10.1016/j.marpetgeo.2013.04.014
[65] 吕炳全, 徐国强, 王红罡, 等.南海新生代碳酸盐台地淹没事件纪录的海底扩张[J].地质科学, 2002, 37(4): 405-414. doi: 10.3321/j.issn:0563-5020.2002.04.003 LV Binquan, XU Guoqiang, WANG Hongzheng, et al. Sea floor spreading recorded by drowning events of Cenozoic carbonate platforms in the South China Sea[J]. Chinese journal of geology, 2002, 37(4): 405-414. doi: 10.3321/j.issn:0563-5020.2002.04.003
[66] 徐国强, 吕炳全, 王红罡.新生代南海北部碳酸盐台地的淹没事件研究[J], 同济大学学报, 2002, 30(1): 35-40. doi: 10.3321/j.issn:0253-374X.2002.01.007 XU Guoqiang, LV Bingquan, WANG Hongzheng. Drowning events research: insights from Cenozoic carbonate platforms in Northern South China Sea[J]. Journal of Tongji University, 2002, 30(1): 35-40. doi: 10.3321/j.issn:0253-374X.2002.01.007
[67] Wu S, Gao J, Zhao S, et al. Post-rift uplift and focused fluid flow in the passive margin of northern South China Sea[J]. Tectonophysics, 2014, 615: 27-39. https://www.researchgate.net/publication/261013664_Post-rift_uplift_and_focused_fluid_flow_in_the_passive_margin_of_northern_South_China_Sea
[68] Ma Y, Wu S, Lv F, et al. Seismic characteristics and development of the xisha carbonate platforms, northern margin of the South China Sea[J]. Journal of Asian Earth Sciences, 2011, 40(3), 770-783. doi: 10.1016/j.jseaes.2010.11.003
[69] Moldovanyi E P, Wall F M, Zhang J Y. Regional exposure events and platform evolution of Zhujiang Formation carbonates, Pearl River Mouth Basin: Evidence from primary and diagenetic seismic facies[J]. AAPG Memoir, 1995, 63: 125-140.
[70] 施小斌, 丘学林, 夏戡原, 等.南海热流特征及其构造意义[J].热带海洋学报, 2003, 22(2):63-73. doi: 10.3969/j.issn.1009-5470.2003.02.007 SHI Xiaobin, QIU Xuelin, XIA Kanyuan, et al. Heat flow characteristics and its tectonic significance of South China Sea[J]. Journal of Tropical Oceanography, 2003, 22(2):63-73. doi: 10.3969/j.issn.1009-5470.2003.02.007
[71] 徐行, 罗贤虎, 许鹤华, 等.南海地热流探测、研究与展望[J].南海地质研究, 2015:1-18. http://www.cnki.com.cn/Article/CJFDTotal-NHDZ201500001.htm XU Dai, LUO Xianhu, XU Hehua, et al, Heat flow's detection, research and prospects in South China Sea[J]. Research of Eological South China Sea, 2015:1-18 http://www.cnki.com.cn/Article/CJFDTotal-NHDZ201500001.htm
[72] Lin M, Zhang J. Thermal structure about southwest sub-basin of South China Sea[J]. Earthquake Science, 2011, 24(5):427-436 doi: 10.1007/s11589-011-0805-3
[73] 施小斌, 于传海, 陈梅, 等.南海北部陆缘热流变化特征及其影响因素分析[J].地学前缘, 2017, 24(3):56-64. http://d.old.wanfangdata.com.cn/Periodical/dxqy201703005 SHI Xiaobin, YU Chuanhai, CHEN Mei, et al. Analyses of variation features and influential factors of heat flow in the northern margin of the South China Sea[J]. Earth Science Frontiers, 2017, 24(3): 56-64. http://d.old.wanfangdata.com.cn/Periodical/dxqy201703005
[74] 陈爱华, 徐行, 罗贤虎, 等.南海北康盆地热流分布特征及其构造控制因素探讨[J].地质学报, 2017, 91(8):1720-1728. doi: 10.3969/j.issn.0001-5717.2017.08.005 CHEN Aihua, XU Xing, LUO Xianhu, et al. Heat flow characteristics and controlling factors of Beikang Basin in South China Sea[J], Acta Geological Sinica, 2017, 91(8): 1720-1728. doi: 10.3969/j.issn.0001-5717.2017.08.005
[75] 徐行, 姚永坚, 彭登, 等.南海西南次海盆的地热流特征与分析[J].地球物理学报, 2018(7):2915-2925. http://d.old.wanfangdata.com.cn/Periodical/dqwlxb201807021 XU Hang, YAO Yongjian, PEN Deng, et al. The Characteristics and analysis of heat flow in the Southwest sub-basin of South China Sea[J]. Chinese Journal of Geophysic, 2018(7): 2915-2925. http://d.old.wanfangdata.com.cn/Periodical/dqwlxb201807021
[76] Li Q, Wang P, Zhao Q, et al. A 33 Ma lithostratigraphic record of tectonic and paleoceanographic evolution of the South China Sea[J]. Marine Geology, 2006, 230 (3): 217-235. http://www.wanfangdata.com.cn/details/detail.do?_type=perio&id=23faff45b02eed9c5929cdc3eab7d69b
[77] Ma B, Wu S, Betzler C, et al. Geometry, internal architecture, and evolution of buried volcanic mounds in the northern South China Sea[J]. Marine and Petroleum Geology, 2018, 97: 540-555. doi: 10.1016/j.marpetgeo.2018.07.029


 下载:
下载:


